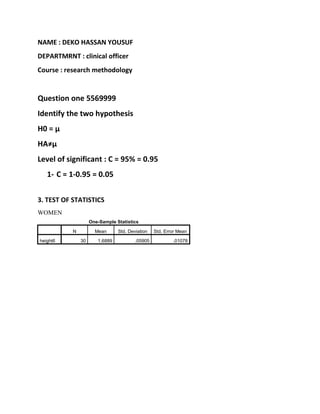
1. The document reports on various statistical analyses conducted on data related to height, weight, smoking status, and fetal outcomes. Hypothesis tests were conducted to compare means across groups.
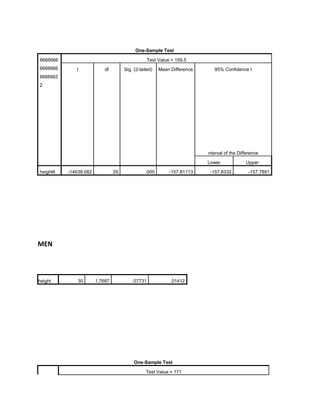
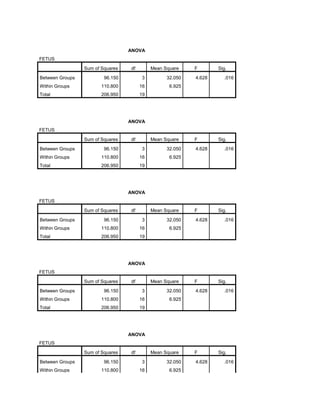
2. Null hypotheses of equal means could not be rejected for tests comparing height of men and women, weight change before and after surgery, and smoking vs non-smoking status. The null hypothesis was rejected for differences in fetal outcomes between groups.
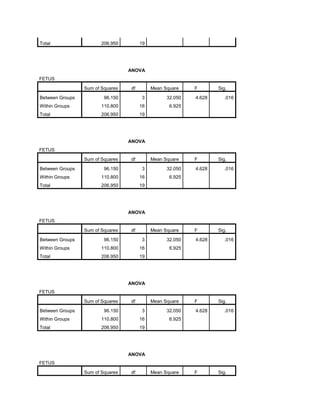
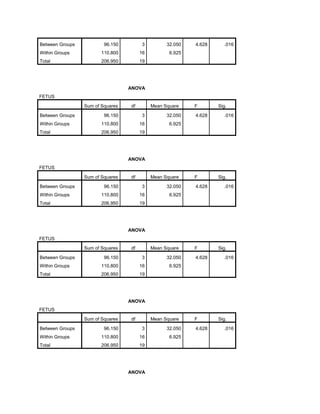
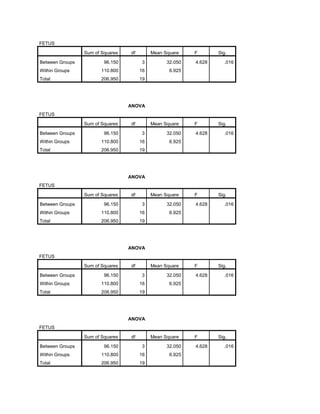
3. ANOVA tests found a significant effect of group on fetal outcomes.
![t df Sig. (2-tailed) Mean Difference 95% Confidence Interval of the
Difference
Lower Upper
height -11988.992 29 .000 -169.23133 -169.2602 -169.2025
Paired Samples Statistics
Mean N Std. Deviation Std. Error Mean
Pair 1
preop 38.5333 12 30.05868 8.67719
postop 56.6083 12 27.80011 8.02520
Paired Samples Correlations
N Correlation Sig.
Pair 1 preop & postop 12 .364 .245
--
Paired Samples Test
- Paired Differences t
Mean Std. Deviation Std. Error Mean 95% Confidence Interval of the
Difference
Lower Upper
Pair 1 preop - postop -18.07500 32.68169 9.43439 -38.83996 2.68996 -1.91
1] H0=U1-U2=O
HA=U1-U2 NOT =0
2} C=95% PVALUE= 0.05
3} TEST STATICS
4=FAILED TO REJCT HO](https://image.slidesharecdn.com/deqoxasan-230217104027-59d5203d/85/DEQO-XASAN-docx-3-320.jpg)
![1}HO=µ
HA ≠µ
2}C=95% PVALUE
3]TEST STASTICS
4]REJECT THE NULL HO
Group Statistics
MEASURMENT N Mean Std. Deviation Std. Error Mean
SMOKING
SMOKING 10 45.3300 20.83576 6.58885
NONSMOKING 12 32.5833 16.42204 4.74063
Independent Samples Test
Levene's Test for Equality of Variances
F Sig. t df Sig. (2-tailed
SMOKING
Equal variances assumed 1.693 .208 1.606 20 .1
Equal variances not assumed 1.570 17.002 .1
1}HO=µ
HA≠µ
2}C=95%=O.05
3]TEST OF STATISTIC
4]FAILED TO REJECT THE HO](https://image.slidesharecdn.com/deqoxasan-230217104027-59d5203d/85/DEQO-XASAN-docx-8-320.jpg)