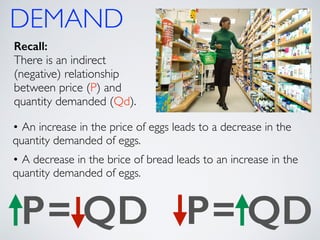
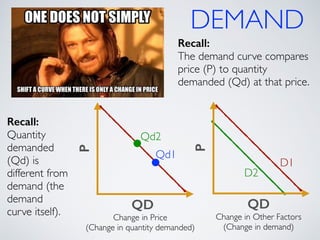
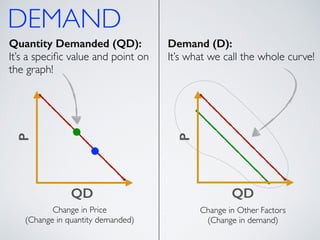
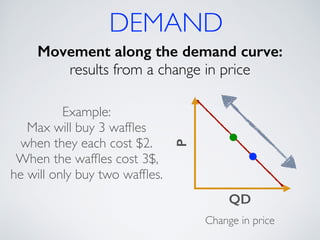
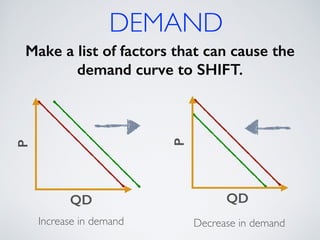
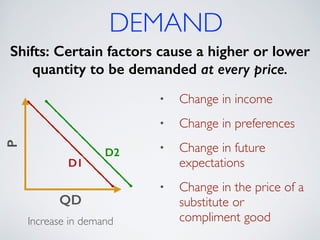
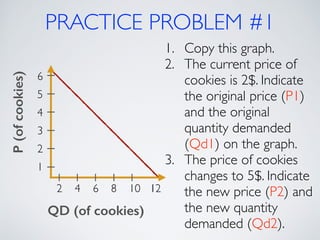
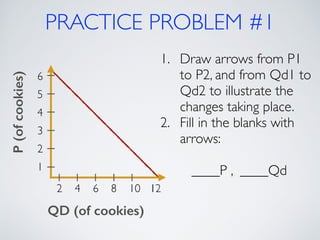
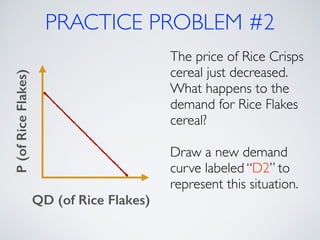
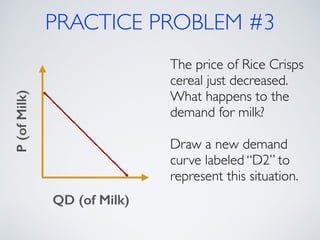
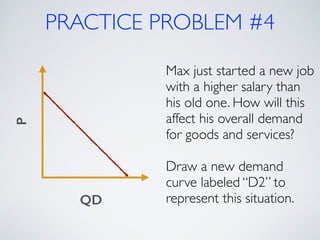
DEMAND 
(part 2)
DEMAND 
Recall: 
There is an indirect 
(negative) relationship 
between price (P) and 
quantity demanded (Qd). 
• An increase in the price of eggs leads to a decrease in the 
quantity demanded of eggs. 
! 
• A decrease in the brice of bread leads to an increase in the 
quantity demanded of eggs. 
P= QD P= QD
DEMAND 
The amount of a good that buyers 
purchase at a higher price is less 
because as the price of a good 
goes up, so does the opportunity 
cost of buying that good. 
P= QD P= QD
DEMAND 
Recall: 
Quantity 
demanded 
(Qd) is 
different from 
demand (the 
demand 
curve itself). Change in Other Factors 
P 
Qd2 
QD 
Recall: 
The demand curve compares 
price (P) to quantity 
demanded (Qd) at that price. 
P 
QD 
Change in Price 
(Change in quantity demanded) 
(Change in demand) 
Qd1 
D1 
D2
DEMAND 
Quantity Demanded (QD): 
It’s a specific value and point on 
the graph! 
P 
QD 
Demand (D): 
It’s what we call the whole curve! 
P 
QD 
Change in Price 
(Change in quantity demanded) 
Change in Other Factors 
(Change in demand)
DEMAND 
Movement along the demand curve: 
results from a change in price P 
QD 
Change in price 
Example: 
Max will buy 3 waffles 
when they each cost $2. 
When the waffles cost 3$, 
he will only buy two waffles.
DEMAND 
Make a list of factors that can cause the 
demand curve to SHIFT. P 
QD 
P 
QD 
Increase in demand Decrease in demand
DEMAND 
Shifts: Certain factors cause a higher or lower 
quantity to be demanded at every price. 
P 
D1 
QD 
D2 
Increase in demand 
• Change in income 
! 
• Change in preferences 
! 
• Change in future 
expectations 
! 
• Change in the price of a 
substitute or 
compliment good
PRACTICE PROBLEM #1 
6 
!5 
!4 
!3 
!2 
1 
2 4 6 8 10 12 
P (of cookies) 
QD (of cookies) 
1. Copy this graph. 
2. The current price of 
cookies is 2$. Indicate 
the original price (P1) 
and the original 
quantity demanded 
(Qd1) on the graph. 
3. The price of cookies 
changes to 5$. Indicate 
the new price (P2) and 
the new quantity 
demanded (Qd2).
PRACTICE PROBLEM #1 
6 
!5 
!4 
!3 
!2 
1 
1. Draw arrows from P1 
to P2, and from Qd1 to 
Qd2 to illustrate the 
changes taking place. 
2. Fill in the blanks with 
arrows: 
! 
2 4 6 8 10 12 
QD (of cookies) 
____P , ____Qd 
! 
P (of cookies)
PRACTICE PROBLEM #2 
P (of Rice Flakes) 
QD (of Rice Flakes) 
The price of Rice Crisps 
cereal just decreased. 
What happens to the 
demand for Rice Flakes 
cereal? 
! 
Draw a new demand 
curve labeled “D2” to 
represent this situation.
PRACTICE PROBLEM #3 
P (of Milk) 
QD (of Milk) 
The price of Rice Crisps 
cereal just decreased. 
What happens to the 
demand for milk? 
! 
Draw a new demand 
curve labeled “D2” to 
represent this situation.
PRACTICE PROBLEM #4 
P 
QD 
Max just started a new job 
with a higher salary than 
his old one. How will this 
affect his overall demand 
for goods and services? 
! 
Draw a new demand 
curve labeled “D2” to 
represent this situation.
Complete “Demand Worksheet #2” NOW

Demand Part 2

  • 1.
  • 2.
    DEMAND Recall: Thereis an indirect (negative) relationship between price (P) and quantity demanded (Qd). • An increase in the price of eggs leads to a decrease in the quantity demanded of eggs. ! • A decrease in the brice of bread leads to an increase in the quantity demanded of eggs. P= QD P= QD
  • 3.
    DEMAND The amountof a good that buyers purchase at a higher price is less because as the price of a good goes up, so does the opportunity cost of buying that good. P= QD P= QD
  • 4.
    DEMAND Recall: Quantity demanded (Qd) is different from demand (the demand curve itself). Change in Other Factors P Qd2 QD Recall: The demand curve compares price (P) to quantity demanded (Qd) at that price. P QD Change in Price (Change in quantity demanded) (Change in demand) Qd1 D1 D2
  • 5.
    DEMAND Quantity Demanded(QD): It’s a specific value and point on the graph! P QD Demand (D): It’s what we call the whole curve! P QD Change in Price (Change in quantity demanded) Change in Other Factors (Change in demand)
  • 6.
    DEMAND Movement alongthe demand curve: results from a change in price P QD Change in price Example: Max will buy 3 waffles when they each cost $2. When the waffles cost 3$, he will only buy two waffles.
  • 7.
    DEMAND Make alist of factors that can cause the demand curve to SHIFT. P QD P QD Increase in demand Decrease in demand
  • 8.
    DEMAND Shifts: Certainfactors cause a higher or lower quantity to be demanded at every price. P D1 QD D2 Increase in demand • Change in income ! • Change in preferences ! • Change in future expectations ! • Change in the price of a substitute or compliment good
  • 9.
    PRACTICE PROBLEM #1 6 !5 !4 !3 !2 1 2 4 6 8 10 12 P (of cookies) QD (of cookies) 1. Copy this graph. 2. The current price of cookies is 2$. Indicate the original price (P1) and the original quantity demanded (Qd1) on the graph. 3. The price of cookies changes to 5$. Indicate the new price (P2) and the new quantity demanded (Qd2).
  • 10.
    PRACTICE PROBLEM #1 6 !5 !4 !3 !2 1 1. Draw arrows from P1 to P2, and from Qd1 to Qd2 to illustrate the changes taking place. 2. Fill in the blanks with arrows: ! 2 4 6 8 10 12 QD (of cookies) ____P , ____Qd ! P (of cookies)
  • 11.
    PRACTICE PROBLEM #2 P (of Rice Flakes) QD (of Rice Flakes) The price of Rice Crisps cereal just decreased. What happens to the demand for Rice Flakes cereal? ! Draw a new demand curve labeled “D2” to represent this situation.
  • 12.
    PRACTICE PROBLEM #3 P (of Milk) QD (of Milk) The price of Rice Crisps cereal just decreased. What happens to the demand for milk? ! Draw a new demand curve labeled “D2” to represent this situation.
  • 13.
    PRACTICE PROBLEM #4 P QD Max just started a new job with a higher salary than his old one. How will this affect his overall demand for goods and services? ! Draw a new demand curve labeled “D2” to represent this situation.
  • 14.