Download as PDF, PPTX


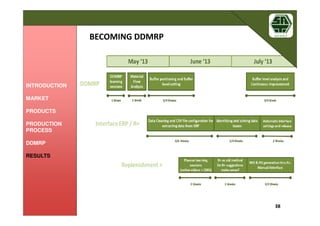
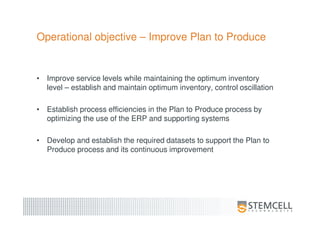
![Good forecasting?
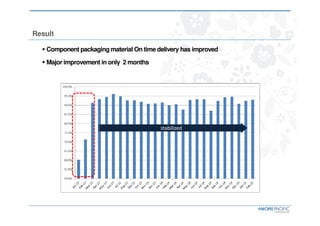
• Sales Forecast : The accuracy of M+3 forecast is less than 10%.
Purchasing team could not depend on the sales forecast,
used only as a reference.
• Best policy of purchasing department : Try to reduce the lead time
because the accuracy of short term forecast is high.
[ Accuracy of Sales Forecast]](https://image.slidesharecdn.com/erikbushpowerpointpresentation-150601190927-lva1-app6892/85/Demand-Driven-MRP-10-320.jpg)
![11
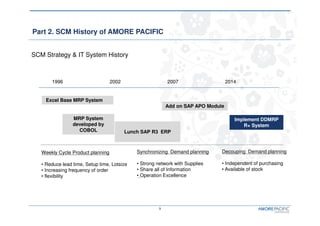
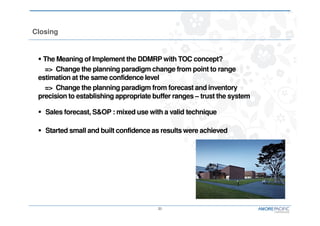
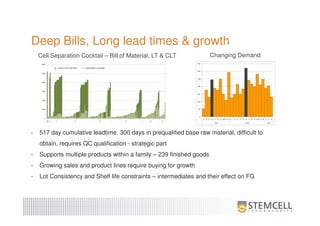
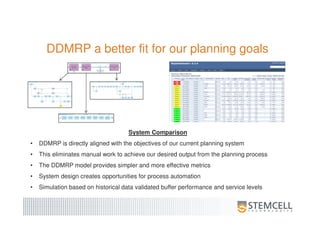
Part 3. Lunching DDMRP [ 30분분분분 ]
The Five Components of DDMRP
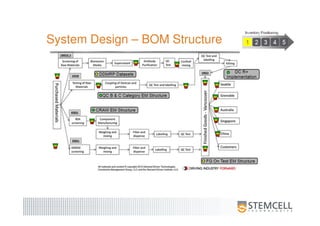
Demand Driven Material Requirements Planning
Strategic
Inventory
Positioning
1
Buffer Profiles
and Levels
2
Dynamic
Adjustments
3
Demand
Driven
Planning
4
Visible and
Collaborative
Execution
5
Modeling/Re-modeling the Environment Plan Execute](https://image.slidesharecdn.com/erikbushpowerpointpresentation-150601190927-lva1-app6892/85/Demand-Driven-MRP-11-320.jpg)
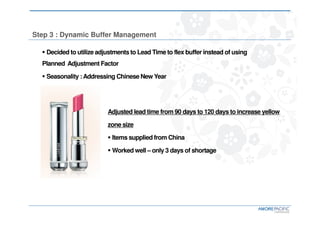
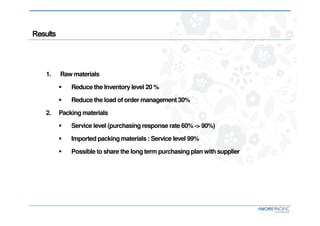


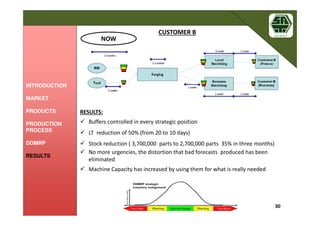


Demand Driven MRP Case Studies provides an overview of three successful DDMRP implementations at Amore Pacific, Satuerca, and StemCell. At Amore Pacific, DDMRP helped reduce raw material inventory by 20% and order management workload by 30%. Satuerca saw a 35% reduction in inventory levels and 50% reduction in lead times. StemCell adopted DDMRP to improve service levels while maintaining optimal inventory levels and establish efficient planning processes.


![Demand driven mrp rudi - sap forum - sept 2017[2521]](https://cdn.slidesharecdn.com/ss_thumbnails/demanddrivenmrp-rudi-sapforum-sept20172521-171213190111-thumbnail.jpg?width=640&height=640&fit=bounds)


