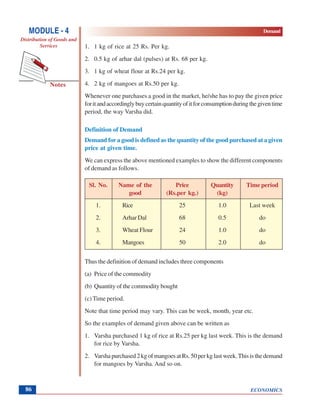
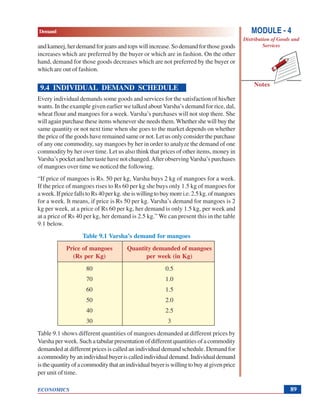
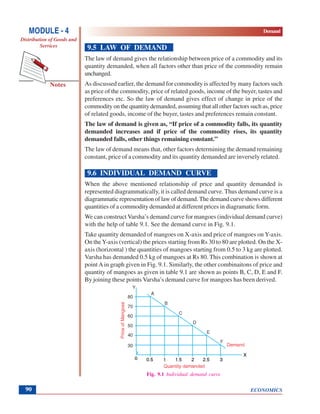
This document discusses demand and the factors that influence it. It begins by defining demand as the quantity of a good purchased at a given price and time period. It then explains that demand is influenced by price, income, tastes/preferences, and prices of related goods. The document provides an example of an individual's demand schedule for mangoes and uses it to construct an individual demand curve, which graphs the inverse relationship between price and quantity demanded as described by the law of demand. It concludes by defining market demand as the total quantity demanded by all individual buyers in the market.
Elasticity of Demand
Law of demand explains the directions of changes in demand. A fall in price leads to an increase in quantity demanded and vice versa.
But it does not tell us the rate at which demand changes to change in price.
The concept of elasticity of demand was introduced by Marshall.
This concept explains the relationship between a change in price and the consequent change in quantity demanded.
Nutshell, it shows the rate at which changes in demand take place.
This is a small and easy description of demand and its determinants. PLEASE MUST WATCH IT AND UNDERSTAND IT AND ASK YOUR QUARRIES ALSO , i would love to solve it and give your peaceful reviews regarding this presentation weather it is bad or good.
THANK YOU!!
Economics, Law of Demand, Determinants of Demand, increase and Decrease in Demand, Extension and Contraction in Demand, Exception of Demand, Assumptions of Demand
June 3, 2024 Anti-Semitism Letter Sent to MIT President Kornbluth and MIT Cor...Levi Shapiro
Letter from the Congress of the United States regarding Anti-Semitism sent June 3rd to MIT President Sally Kornbluth, MIT Corp Chair, Mark Gorenberg
Dear Dr. Kornbluth and Mr. Gorenberg,
The US House of Representatives is deeply concerned by ongoing and pervasive acts of antisemitic
harassment and intimidation at the Massachusetts Institute of Technology (MIT). Failing to act decisively to ensure a safe learning environment for all students would be a grave dereliction of your responsibilities as President of MIT and Chair of the MIT Corporation.
This Congress will not stand idly by and allow an environment hostile to Jewish students to persist. The House believes that your institution is in violation of Title VI of the Civil Rights Act, and the inability or
unwillingness to rectify this violation through action requires accountability.
Postsecondary education is a unique opportunity for students to learn and have their ideas and beliefs challenged. However, universities receiving hundreds of millions of federal funds annually have denied
students that opportunity and have been hijacked to become venues for the promotion of terrorism, antisemitic harassment and intimidation, unlawful encampments, and in some cases, assaults and riots.
The House of Representatives will not countenance the use of federal funds to indoctrinate students into hateful, antisemitic, anti-American supporters of terrorism. Investigations into campus antisemitism by the Committee on Education and the Workforce and the Committee on Ways and Means have been expanded into a Congress-wide probe across all relevant jurisdictions to address this national crisis. The undersigned Committees will conduct oversight into the use of federal funds at MIT and its learning environment under authorities granted to each Committee.
• The Committee on Education and the Workforce has been investigating your institution since December 7, 2023. The Committee has broad jurisdiction over postsecondary education, including its compliance with Title VI of the Civil Rights Act, campus safety concerns over disruptions to the learning environment, and the awarding of federal student aid under the Higher Education Act.
• The Committee on Oversight and Accountability is investigating the sources of funding and other support flowing to groups espousing pro-Hamas propaganda and engaged in antisemitic harassment and intimidation of students. The Committee on Oversight and Accountability is the principal oversight committee of the US House of Representatives and has broad authority to investigate “any matter” at “any time” under House Rule X.
• The Committee on Ways and Means has been investigating several universities since November 15, 2023, when the Committee held a hearing entitled From Ivory Towers to Dark Corners: Investigating the Nexus Between Antisemitism, Tax-Exempt Universities, and Terror Financing. The Committee followed the hearing with letters to those institutions on January 10, 202
Francesca Gottschalk - How can education support child empowerment.pptxEduSkills OECD
Francesca Gottschalk from the OECD’s Centre for Educational Research and Innovation presents at the Ask an Expert Webinar: How can education support child empowerment?
2024.06.01 Introducing a competency framework for languag learning materials ...Sandy Millin
http://sandymillin.wordpress.com/iateflwebinar2024
Published classroom materials form the basis of syllabuses, drive teacher professional development, and have a potentially huge influence on learners, teachers and education systems. All teachers also create their own materials, whether a few sentences on a blackboard, a highly-structured fully-realised online course, or anything in between. Despite this, the knowledge and skills needed to create effective language learning materials are rarely part of teacher training, and are mostly learnt by trial and error.
Knowledge and skills frameworks, generally called competency frameworks, for ELT teachers, trainers and managers have existed for a few years now. However, until I created one for my MA dissertation, there wasn’t one drawing together what we need to know and do to be able to effectively produce language learning materials.
This webinar will introduce you to my framework, highlighting the key competencies I identified from my research. It will also show how anybody involved in language teaching (any language, not just English!), teacher training, managing schools or developing language learning materials can benefit from using the framework.
Embracing GenAI - A Strategic ImperativePeter Windle
Artificial Intelligence (AI) technologies such as Generative AI, Image Generators and Large Language Models have had a dramatic impact on teaching, learning and assessment over the past 18 months. The most immediate threat AI posed was to Academic Integrity with Higher Education Institutes (HEIs) focusing their efforts on combating the use of GenAI in assessment. Guidelines were developed for staff and students, policies put in place too. Innovative educators have forged paths in the use of Generative AI for teaching, learning and assessments leading to pockets of transformation springing up across HEIs, often with little or no top-down guidance, support or direction.
This Gasta posits a strategic approach to integrating AI into HEIs to prepare staff, students and the curriculum for an evolving world and workplace. We will highlight the advantages of working with these technologies beyond the realm of teaching, learning and assessment by considering prompt engineering skills, industry impact, curriculum changes, and the need for staff upskilling. In contrast, not engaging strategically with Generative AI poses risks, including falling behind peers, missed opportunities and failing to ensure our graduates remain employable. The rapid evolution of AI technologies necessitates a proactive and strategic approach if we are to remain relevant.
Palestine last event orientationfvgnh .pptxRaedMohamed3
An EFL lesson about the current events in Palestine. It is intended to be for intermediate students who wish to increase their listening skills through a short lesson in power point.
A Strategic Approach: GenAI in EducationPeter Windle
Artificial Intelligence (AI) technologies such as Generative AI, Image Generators and Large Language Models have had a dramatic impact on teaching, learning and assessment over the past 18 months. The most immediate threat AI posed was to Academic Integrity with Higher Education Institutes (HEIs) focusing their efforts on combating the use of GenAI in assessment. Guidelines were developed for staff and students, policies put in place too. Innovative educators have forged paths in the use of Generative AI for teaching, learning and assessments leading to pockets of transformation springing up across HEIs, often with little or no top-down guidance, support or direction.
This Gasta posits a strategic approach to integrating AI into HEIs to prepare staff, students and the curriculum for an evolving world and workplace. We will highlight the advantages of working with these technologies beyond the realm of teaching, learning and assessment by considering prompt engineering skills, industry impact, curriculum changes, and the need for staff upskilling. In contrast, not engaging strategically with Generative AI poses risks, including falling behind peers, missed opportunities and failing to ensure our graduates remain employable. The rapid evolution of AI technologies necessitates a proactive and strategic approach if we are to remain relevant.
Synthetic Fiber Construction in lab .pptxPavel ( NSTU)
Synthetic fiber production is a fascinating and complex field that blends chemistry, engineering, and environmental science. By understanding these aspects, students can gain a comprehensive view of synthetic fiber production, its impact on society and the environment, and the potential for future innovations. Synthetic fibers play a crucial role in modern society, impacting various aspects of daily life, industry, and the environment. ynthetic fibers are integral to modern life, offering a range of benefits from cost-effectiveness and versatility to innovative applications and performance characteristics. While they pose environmental challenges, ongoing research and development aim to create more sustainable and eco-friendly alternatives. Understanding the importance of synthetic fibers helps in appreciating their role in the economy, industry, and daily life, while also emphasizing the need for sustainable practices and innovation.
Biological screening of herbal drugs: Introduction and Need for
Phyto-Pharmacological Screening, New Strategies for evaluating
Natural Products, In vitro evaluation techniques for Antioxidants, Antimicrobial and Anticancer drugs. In vivo evaluation techniques
for Anti-inflammatory, Antiulcer, Anticancer, Wound healing, Antidiabetic, Hepatoprotective, Cardio protective, Diuretics and
Antifertility, Toxicity studies as per OECD guidelines
Unit 8 - Information and Communication Technology (Paper I).pdfThiyagu K
This slides describes the basic concepts of ICT, basics of Email, Emerging Technology and Digital Initiatives in Education. This presentations aligns with the UGC Paper I syllabus.
Operation “Blue Star” is the only event in the history of Independent India where the state went into war with its own people. Even after about 40 years it is not clear if it was culmination of states anger over people of the region, a political game of power or start of dictatorial chapter in the democratic setup.
The people of Punjab felt alienated from main stream due to denial of their just demands during a long democratic struggle since independence. As it happen all over the word, it led to militant struggle with great loss of lives of military, police and civilian personnel. Killing of Indira Gandhi and massacre of innocent Sikhs in Delhi and other India cities was also associated with this movement.
Model Attribute Check Company Auto PropertyCeline George
In Odoo, the multi-company feature allows you to manage multiple companies within a single Odoo database instance. Each company can have its own configurations while still sharing common resources such as products, customers, and suppliers.
1. Demand
ECONOMICS
Notes
MODULE - 4
Distribution of Goods and
Services
85
9
DEMAND
We have already studied about needs and wants in lesson 2.To satisfy these wants,
you buy goods and services from the market.We buy goods and services by paying
different prices. Now a days the market is flooded with various types of goods. So
we have to make a choice before purchasing any good. But, just making a choice
or selecting a particular good to purchase is not enough. When we go to the market,
we carry certain amount of money which we use to buy the goods and services.
As consumers in the market, we decide to purchase certain amount of goods or
combinationofvariousgoodsdependingontheamountofmoneywehave,theprice
we have to pay, our liking for the goods etc.All these things are involved in the study
of demand which depicts our behavior as consumers in the market.
OBJECTIVES
After completing this lesson, you will be able to:
explain the concept of demand;
differentiate between individual demand and market demand of a commodity;
discuss the factors affecting demand;
state the law of demand and establish relationship between price and
quantity demanded;
construct an individual demand curve;
interpret the shape of individual demand curve.
9.1 MEANING OF DEMAND
Suppose, Varsha went to the market last week and made the following purchases
for the week for herself.
2. ECONOMICS
MODULE - 4 Demand
Distribution of Goods and
Services
Notes
86
1. 1 kg of rice at 25 Rs. Per kg.
2. 0.5 kg of arhar dal (pulses) at Rs. 68 per kg.
3. 1 kg of wheat flour at Rs.24 per kg.
4. 2 kg of mangoes at Rs.50 per kg.
Whenever one purchases a good in the market, he/she has to pay the given price
foritandaccordinglybuycertainquantityofitforconsumptionduringthegiventime
period, the way Varsha did.
Definition of Demand
Demand for a good is defined as the quantity of the good purchased at a given
price at given time.
We can express the above mentioned examples to show the different components
of demand as follows.
Sl. No. Name of the Price Quantity Time period
good (Rs.per kg.) (kg)
1. Rice 25 1.0 Last week
2. Arhar Dal 68 0.5 do
3. Wheat Flour 24 1.0 do
4. Mangoes 50 2.0 do
Thus the definition of demand includes three components
(a) Price of the commodity
(b) Quantity of the commodity bought
(c) Time period.
Note that time period may vary. This can be week, month, year etc.
So the examples of demand given above can be written as
1. Varsha purchased 1 kg of rice at Rs.25 per kg last week. This is the demand
for rice by Varsha.
2. Varshapurchased2kgofmangoesatRs.50perkglastweek.Thisisthedemand
for mangoes by Varsha. And so on.
3. Demand
ECONOMICS
Notes
MODULE - 4
Distribution of Goods and
Services
87
Now read the following examples:
(i) Nitin bought 2 pairs of shoes last month.
(ii) Mr. Jafri purchased 5 kg of apple at Rs.40 per kg.
(iii) Ms. Harmit Kaur paid Rs.25 per litre for milk last month.
Are these examples of demand? No. You can easily see that in the case of Nitin,
price of a pair of shoe is not given. In case of Mr. Jafri, time period is not mentioned.
Finally in case of Ms. Harmit Kaur, quantity of milk consumed is not given.
INTEXT QUESTIONS 9.1
1. Definedemand.
2. Name the three components included in the definition of demand.
9.2 DIFFERENCE BETWEEN DEMAND AND DESIRE
On many occasions people confuse between desire and demand and use them inter-
changeably. In fact these are two different terms. Demand is desire backed by ability
to purchase. This means that if somebody desires to have a good, he/she can demand
it if he/she has the money to purchase it by paying its price.Anyone can desire any
good or service. But just by desiring something, one cannot have it without paying
the price. Once the price is paid by the person who has desired it, only then it
becomes the demand for the good by that person. Take the example given above
once again- “Varsha purchased 2 kg of mangoes at Rs. 50 per kg last week.” This
is the demand for mangoes by Varsha. Had Varsha desired to have mangoes but
could not pay the price to buy, then it would have been said as Varsha’s desire but
not demand for mangoes.
9.3 FACTORS AFFECTING INDIVIDUAL DEMAND
Individual demand refers to the quantity of a commodity that an individual buyer is
willingtobuyatgivenpriceperunitoftime.Buthowmuchquantityofacommodity
one is willing to buy depends upon the following factors. These are also called
determinants of demand. These are
(i) Price of the commodity
(ii) Price of related goods
(iii) Income of the buyer
(iv) Tastes and preferences of the buyer
4. ECONOMICS
MODULE - 4 Demand
Distribution of Goods and
Services
Notes
88
Let us discuss these factors one by one.
1. Price of the commodity
When you visit a market to buy a commodity, you go to a seller of that commodity
andaskforitspricefirst.Ifyouthinkthatthepriceisreasonable,youbuytherequired
quantity of the commodity. On the other hand, if the price is higher in your opinion,
you may not buy or buy less quantity of it. Generally we are willing to buy more
quantity of a commodity at a lower price and less of it at a higher price, if all other
factors determining demand remain constant.
2. Price of related goods
The demand for a commodity is also influenced by the prices of its related goods.
Related goods can be of two types : (a) substitute goods (b) complementary goods
Substitute goods are those goods which can easily be used in place of each other.
Example of substitute goods are coke and pepsi, tea and coffee etc. If price of coffee
increases, people will demand more of tea and thus demand for tea will increase.
If price of coffee falls, people will demand more of coffee and thus demand for tea
willfall.So,thedemandforacommodityisdirectlyrelatedtothepriceofitssubstitute
goods.
On the other hand, complementary goods are those goods which are used together
insatisfyingaparticularwant.Examplesofcomplementarygoodsarecarandpetrol,
ball pen and refill etc. If we have a car, we also require petrol to run it. Imagine,
if price of petrol rises, what will happen to the demand for car? Demand for car
will decrease. If the price of one of them increases, the demand for other good will
decrease and if price of one of them falls, the demand for the other will increase.
So,thedemandforacommodityisinverselyrelatedtothepriceofitscomplementary
goods.
3. Income of the buyer
The demand for a commodity also depends on the income of the buyer.When your
income increases, you are likely to spend more on purchase of some goods such
as fruits, full cream milk, butter etc. Such goods are normal goods. Normal goods
are those goods whose demand increases with the increase in income. So, the
demand for normal goods is directly related to the income of the buyer.
But there are some goods whose demand decreases when income of the buyer
increases,suchasjowar,bajra,tonedmilketc.Thesegoodsarecalledinferiorgoods,
so, the demand for inferior goods is inversely related to the income of the buyer.
4. Tastes, preferences and fashion
Tastes, preference and fashion are important factors which affect the demand for a
commodity. For example, if Monika prefers jeans and tops in comparison to salvar
5. Demand
ECONOMICS
Notes
MODULE - 4
Distribution of Goods and
Services
89
and kameej, her demand for jeans and tops will increase. So demand for those goods
increases which are preferred by the buyer or which are in fashion. On the other
hand, demand for those goods decreases which are not preferred by the buyer or
which are out of fashion.
9.4 INDIVIDUAL DEMAND SCHEDULE
Every individual demands some goods and services for the satisfaction of his/her
wants. In the example given earlier we talked about Varsha’s demand for rice, dal,
wheat flour and mangoes for a week. Varsha’s purchases will not stop there. She
will again purchase these items whenever she needs them. Whether she will buy the
same quantity or not next time when she goes to the market depends on whether
the price of the goods have remained same or not. Let us only consider the purchase
of any one commodity, say mangoes by her in order to analyze the demand of one
commodity by her over time. Let us also think that prices of other items, money in
Varsha’s pocket and her taste have not changed.After observingVarsha’s purchases
of mangoes over time we noticed the following.
“If price of mangoes is Rs. 50 per kg, Varsha buys 2 kg of mangoes for a week.
If the price of mangoes rises to Rs 60 per kg she buys only 1.5 kg of mangoes for
aweek.IfpricefallstoRs40perkg.sheiswillingtobuymorei.e.2.5kg.ofmangoes
for a week. It means, if price is Rs 50 per kg. Varsha’s demand for mangoes is 2
kg per week, at a price of Rs 60 per kg, her demand is only 1.5 kg, per week and
at a price of Rs 40 per kg, her demand is 2.5 kg.” We can present this in the table
9.1 below.
Table 9.1 Varsha’s demand for mangoes
Price of mangoes Quantity demanded of mangoes
(Rs per Kg) per week (in Kg)
80 0.5
70 1.0
60 1.5
50 2.0
40 2.5
30 3
Table 9.1 shows different quantities of mangoes demanded at different prices by
Varsha per week. Such a tabular presentation of different quantities of a commodity
demanded at different prices is called an individual demand schedule. Demand for
acommoditybyanindividualbuyeriscalledindividualdemand.Individualdemand
isthequantityofacommoditythatanindividualbuyeriswillingtobuyatgivenprice
per unit of time.
6. ECONOMICS
MODULE - 4 Demand
Distribution of Goods and
Services
Notes
90
9.5 LAW OF DEMAND
The law of demand gives the relationship between price of a commodity and its
quantity demanded, when all factors other than price of the commodity remain
unchanged.
As discussed earlier, the demand for commodity is affected by many factors such
as price of the commodity, price of related goods, income of the buyer, tastes and
preferences etc. So the law of demand gives effect of change in price of the
commodity on the quantity demanded, assuming that all other factors such as, price
of related goods, income of the buyer, tastes and preferences remain constant.
The law of demand is given as, “If price of a commodity falls, its quantity
demanded increases and if price of the commodity rises, its quantity
demanded falls, other things remaining constant.”
The law of demand means that, other factors determining the demand remaining
constant, price of a commodity and its quantity demanded are inversely related.
9.6 INDIVIDUAL DEMAND CURVE
When the above mentioned relationship of price and quantity demanded is
represented diagrammatically, it is called demand curve. Thus demand curve is a
diagrammatic representation of law of demand. The demand curve shows different
quantities of a commodity demanded at different prices in diagramatic form.
We can construct Varsha’s demand curve for mangoes (individual demand curve)
with the help of table 9.1. See the demand curve in Fig. 9.1.
Take quantity demanded of mangoes on X-axis and price of mangoes on Y-axis.
On theY-axis (vertical) the prices starting from Rs 30 to 80 are plotted. On the X-
axis (horizontal ) the quantities of mangoes starting from 0.5 to 3 kg are plotted.
Varsha has demanded 0.5 kg of mangoes at Rs 80. This combination is shown at
point A in graph given in Fig. 9.1. Similarly, the other combinaitons of price and
quantity of mangoes as given in table 9.1 are shown as points B, C, D, E and F.
By joining these points Varsha’s demand curve for mangoes has been derived.
Fig. 9.1 Individual demand curve
7. Demand
ECONOMICS
Notes
MODULE - 4
Distribution of Goods and
Services
91
Thus, the demand schedule and the demand curve both represent the same
relationship between price and quantity demanded but the demand schedule
represents it in a tabular form and demand curve in a diagrammatic form.
INTEXT QUESTIONS 9.2
1. State the law of demand.
2. What are the assumptions of law of demand.
3. What will happen to your demand for apples if price of apples rises from Rs
80 per kg to Rs 100 per kg, assuming that your income, taste and preferences
etc. do not change?
9.7 SHAPE OF INDIVIDUAL DEMAND CURVE
According to the law of demand, when all other factors determining demand remain
constant, the buyer buys more quantity of a commodity at lower price and less of
it at a higher price. Due to this inverse relationship between price and quantity
demanded, the demand curve slopes downwards from left to right. But the question
arises why does a buyer buys more quantity of commodity at a lower price and less
of it at a higher price? Put it in another way, why does the demand curve slope
downwardsfromlefttoright?Themostimportantreasonsfortheinverserelationship
between price and quantity demanded are explained below.
1. When more and more units of a commodity are consumed, satisfaction derived
from successive units of the commodity goes on diminishing. For example, a
hungrypersongetsmaximumsatisfactionfromthefirstchapatti,lessersatisfaction
from second chapatti and still lesser from third chapatti, and so on. If he gets
more satisfaction, he will be ready to pay more and if he gets less satisfaction,
he will be ready to pay less price for it. It means he will be willing to buy more
quantity of a commodity at lower price and less of it at higher price. The law
ofdemandalsoprovidesthesameinformationwhichwillleadtodownwardslope
of demand curve.
2. Suppose, you buy mangoes from the market. If the price of mangoes is Rs 40
per kg and you buy 2 kgs of mangoes at this price. If the price of mangoes falls
from Rs 40 per kg to Rs 20 per kg, your real income or purchasing power is
doubled and you can now buy double quantity i.e. 4 kg of mangoes with the
same money income. Thus a buyer can buy more quantity of a commodity when
its price falls and less of it when its price rises leading to the downward slope
of the demand curve.
8. ECONOMICS
MODULE - 4 Demand
Distribution of Goods and
Services
Notes
92
3. Whenpriceofacommodityfalls,itbecomesrelativelycheaperthanitssubstitutes
(althoughpriceofsubstitutesremainsthesame).Forexample,ifthepriceofcoke
falls, it becomes comparatively cheaper than its substitute i.e. pepsi. People start
buyingcokeinplaceofpepsi.(alternativelypepsiissubstitutedbycoke),leading
to more demand for coke when its price falls. On the other hand, demand for
the commodity will fall when its price rises. It will lead to downward slope of
the demand curve.
INTEXT QUESTIONS 9.3
1. What will happen to the real income of the buyer if price of a commodity falls?
2. Whatwillbetheshapeofthedemandcurvewhenthereisaninverserelationship
between price and its quantity demanded?
3. You are thirsty and you have already taken one glass of water. Whether the
satisfaction derived from second glass of water you drink, will increase or
decrease?
4. Draw demand curve with the help of data given below:
Price (Rs per unit) 1 2 3 4 5
Quantity demanded (units) 20 16 12 8 4
9.8 MARKET DEMAND FOR A GOOD
Varsha is not the only buyer of mangoes in the market. There may be some other
persons who may demand mangoes in the market. Suppose there are two other
buyers Vibha and Somya who are willing to buy mangoes in the market.
The total quantity of a commodity demanded by all the individual buyers in
the market at the given price at given time is called market demand of that
commodity.
Let there are only three buyers buying mangoes in the market – Varsha, Vibha and
Somya,marketdemandwillbethesumofindividualdemandschedulesofthesethree
buyers. Now if we add another two columns showing respective demand of Vibha
and Somya in table 9.1 along with the demand by Varsha, we can get the market
demand schedule. This is shown in table 9.2 below.
9. Demand
ECONOMICS
Notes
MODULE - 4
Distribution of Goods and
Services
93
Table 9.2 Market demand for Mangoes
Price of mangoes Quantity demanded of Market demand of
(Rs per Kg) mangoes per week mangoes per week
(in kg) (in kg)
Varsha Vibha Somya
80 0.5 1.0 0 1.5
70 1.0 1.5 0.5 3.0
60 1.5 2.0 1.0 4.5
50 2.0 2.5 1.5 6.0
40 2.5 3.0 2.0 7.5
30 3 3.5 2.5 9.0
When price of mangoes is Rs. 80 per Kg, Varsha demands 0.5 Kg of mangoes,
Vibha demands 1.0 kg of mangoes and Somya demands no mangoes. Thus market
demand for mangoes at a price of Rs 80 per kg. is 0.5 + 1.0 + 0 = 1.5 kg of mangoes
per week. Likewise, market demand for mangoes can be obtained at other prices
also as shown.in the table 9.2.
INTEXT QUESTION 9.4
1. If there are only three households buying a commodity in the market, calculate
their market demand in the table given below:
Price Quantity demanded Market demand
(Rs per unit) (in units) (in units)
House- House- House-
holdA hold B hold C
5 15 13 30 –
6 12 11 25 –
7 9 9 20 –
8 6 7 15 –
9 3 5 10 –
10. ECONOMICS
MODULE - 4 Demand
Distribution of Goods and
Services
Notes
94
2. Complete the following table
Price Quantity demanded Market demand
(Rs per unit) (in units) (in units)
House- House- House-
holdA hold B hold C
1 10 12 – 48
2 8 15 – 40
3 6 12 – 32
4 4 9 – 24
5 2 6 – 16
9.9 FACTORS AFFECTING MARKET DEMAND
As stated earlier, market demand is the total quantity of a commodity that all the
individual buyers in the market are willing to buy at given prices per unit of time.
Inadditiontothefactorsaffectingindividualdemandforacommoditymarketdemand
is also influenced by the following factors.
1. Number of buyers: Number of buyers buying a commodity determine the
demand for the commodity in the market.As you have seen inTale 9.2 showing
market demand of mangoes there were three buyers of mangoes in the market
namely, Varsha, Vibha and Somya. Now if one more buyer Abha also starts
buying mangoes, what will happen to the market demand of mangoes? Market
demand of mangoes will definitely increase, so, if the number of buyer of a
commodityislarge,marketdemandforthecommoditywillbemore.Ontheother
hand, if the number of buyers is small, market demand for the commodity will
be less.
2. Distribution of income and wealth: The distribution of income and wealth in
a society also determines the market demand of a commodity. If the distribution
of income and wealth is more in favour of the rich, demand for the commodities
preferred by the rich is likely to be higher. On the other hand, if the distribution
of income and wealth is more in favour of poor, demand for the commodities
preferred by the poor is likely to be higher.
3. Climatic condition: It is generally observed that the demand for ice increases
during summer season. Similarly, demand for umbrella and rain coats increases
during rainy season and demand for woolens increases during winter season. So
themarketdemandforacommodityisalsoinfluencedbytheclimaticconditions.
11. Demand
ECONOMICS
Notes
MODULE - 4
Distribution of Goods and
Services
95
INTEXT QUESTIONS 9.5
1. Name four factors that affect the individual demand for a commodity.
2. What will happen to the demand for tea if price of sugar increases?
3. What will happen to the demand for coke if price of pepsi falls?
4. Distinguish between normal goods and inferior goods.
5. Prepare a list of at least five items which are in fashion now a days.
6. Fill in the blanks with appropriate words:
(i) If the income of a buyer falls, his demand for inferior goods will
....................
(ii) Whenpriceofinkincreases,thedemandforfountainpenwill....................
(iii) ....................isthenumberofbuyersofacommodityinthemarket,higher
will be the demand for the commodity.
(iv) If the distribution of income and wealth is more in favour of the
.................... the demand for goods used by the poor will be more.
WHAT YOU HAVE LEARNT
Demand for a commodity refers to the quantity of the commodity that a buyer
is willing to buy at given price at given time.
Individualdemandisthequantityofacommoditythatanindividualbuyeriswilling
to buy at the given price at given time.
Marketdemandisthetotalquantityofacommoditythatalltheindividualbuyers
in the market are willing to buy at given price at given time.
The determinants of individual demand are – price of the commodity, price of
related goods, income of the buyer, tastes, preferences and fashion.
The determinants of market demand are – number of individual buyers buying
that commodity, distribution of income and wealth and climatic condition in
addition to the determinants of individual demand.
The law of demand states that if all other factors affecting demand remain
constant, the buyers will buy more quantity of a commodity at lower price and
less of it at a higher price.
Demand curve is a diagramatic representation of law of demand.
The demand curve of a commodity slopes downwards from left to right.
12. ECONOMICS
MODULE - 4 Demand
Distribution of Goods and
Services
Notes
96
TERMINAL EXERCISE
1. Define demand. Distinguish between individual demand and market demand.
2. Briefly explain the determinants of individual demand for a commodity.
3. State the factors which may affect market demand for a commodity.
4. State and explain the law of demand with the help of a hypothetical numerical
example/schedule.
5. What is a demand curve? Draw an individual demand curve with the help of a
hypothetical demand schedule.
6. Why does the demand curve slope downwards from left to right?
7. What are the reasons behind the law of demand.
ANSWERS TO INTEXT QUESTIONS
Intext Questions 9.1
1. Demand refers to the quantity of a commodity that a buyer is willing to buy at
given price per unit of time.
2. (i) Price of the commodity
(ii) Quantity of the commodity to be bought
(iv) The time period
Intext Questions 9.2
1. The law of demand states that other factors determining the demand remaining
constant, price of a commodity and quantity demanded are inversely related.
2. (i) Income of the buyer does not change.
(ii) Price of related goods does not change
(iii) Tastes, preferences and fashion do not change.
3. Demand for apple will fall
Intext Questions 9.3
1. Real income will increase
2. Demand curve will slope downwards from left to right.
13. Demand
ECONOMICS
Notes
MODULE - 4
Distribution of Goods and
Services
97
3. Decrease
Intext Questions 9.4
1. 58, 48, 38, 28, 18
2. 26, 17, 14, 11, 8
Intext Questions 9.5
1. Price of the commodity, Price of related goods, Income of the buyer, tastes,
preferences and fashion.
2. fall
3. fall
4. Demandfornormalgoodsincreaseswiththeincreaseinincomewhereasdemand
for inferior goods decreases with the increase in income of the buyer.
5. Jeans, Tops, electronic watches, ball pen, Mobile phone
6. (i) Increase (ii) Decrease (iii) More (iv) poor