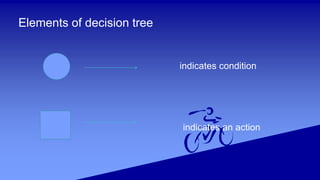
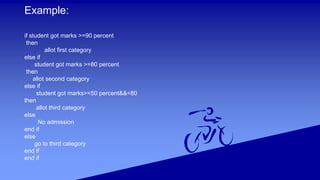
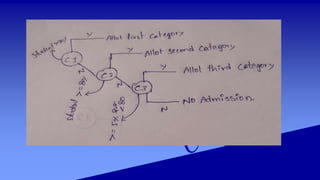
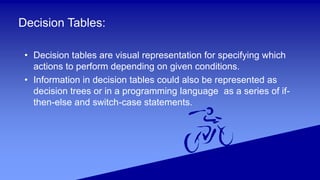
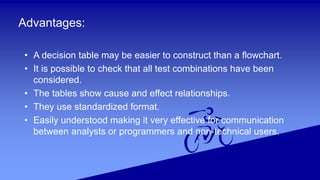
DECISION TREES AND TABLES
Divya Sure
17MIS7054
What is decision tree?
• A decision tree is a graphical representation of possible solutions
to a decision based on certain conditions.
• Decision tree requires a systematic, documented thought process.
• Decision trees shows each decision sequentially.
• Provides for randow elements for business conditions that will be
related in future.
Decision tree in various sectors:
• Decision tree diagrams are often used by businesses to plan a
strategy, analyze research, and come to conclusions.
• Lenders and banks use decision trees to calculate the riskiness
of loans and investment opportunities.
Elements of decision tree
indicates condition
indicates an action
Limitations for Decision Tree:
• The biggest limitation of our decision making is that we
can only selecting from the known alternatives
• Provide less information of the relationship
Advantages:
• Easy to Understand
• Useful in Data exploration
• Less data cleaning required.
• Data type is not a constant.
• Decision trees help formalize the brainstorming process so we
can identify more potential solutions.
• The advantages of a decision tree are fairly obvious: a “path”
through possibilities, with alternatives, leading toward a desirable
outcome.
Disadvantages:
• Over fitting
• Not fit for continous variables.
• Loss of innovation-only past experience go into the branching
of choices, new ideas donot get much consideration
Example:
if student got marks >=90 percent
then
allot first category
else if
student got marks >=80 percent
then
allot second category
else if
student got marks>=50 percent&&<80
then
allot third category
else
No admission
end if
else
go to third category
end if
end if
Decision Tables:
• Decision tables are visual representation for specifying which
actions to perform depending on given conditions.
• Information in decision tables could also be represented as
decision trees or in a programming language as a series of if-
then-else and switch-case statements.
Why use decision tables?
• Powerful visualization
• Preventing errors is easier
Advantages:
• A decision table may be easier to construct than a flowchart.
• It is possible to check that all test combinations have been
considered.
• The tables show cause and effect relationships.
• They use standardized format.
• Easily understood making it very effective for communication
between analysts or programmers and non-technical users.
Disadvantages:
• The total sequence is not clearly shown, i.e., no overall picture
is given by decision tables as presented by flowcharts.
• Where the logic of a system is simple, flowcharts nearly always
serve the purpose better than a decision table.
Steps to draw decision table:
1.Analyze the requirement and create the first coloumn.
2.Add coloumn
3.Reduce the table.
Mark insignificant values with”-”.
4.Determine actions
5.Write test cases
Conditio
ns
Rule 1 Rule 2 Rule 3 Rule 4 Rule 5 Rule 6 Rule 7 Rule 8
marks>=
90percen
t
N N N N T T T T
marks>=
80percen
t
N N T T - - - -
marks>=
50%&&<
80%
N T - - - - - -
Actions
First
Category
- - - - X X X X
Second
Category
- - X X - - - -
Third
Category
-ss X - - - - - -
No
admissio
n
X - - - - - - -
References:
• https://www.slideshare.net/DMANIMALA/decision-table-44548879
• http://www.answers.com/Q/What_are_advantages_and_disadvantages_of_d
ecision_tables
• https://www.coursehero.com/file/p4bc0fm/What-are-the-Advantages-of-
Decision-Tables-1-This-type-of-testing-also-works/
• http://tryqa.com/what-is-decision-table-in-software-testing/
• https://en.wikipedia.org/wiki/Decision_table
• https://study.com/academy/lesson/what-is-a-decision-tree-examples-
advantages-role-in-management.html
• https://en.wikipedia.org/wiki/Decision_tree
• https://www.analyticsvidhya.com/blog/2016/04/complete-tutorial-tree-based-
modeling-scratch-in-python/
• https://www.kaggle.com/dmilla/introduction-to-decision-
trees-titanic-dataset
• https://gormanalysis.com/decision-trees/
THANK YOU

Decision Tree and Tables

  • 1.
    DECISION TREES ANDTABLES Divya Sure 17MIS7054
  • 2.
    What is decisiontree? • A decision tree is a graphical representation of possible solutions to a decision based on certain conditions. • Decision tree requires a systematic, documented thought process. • Decision trees shows each decision sequentially. • Provides for randow elements for business conditions that will be related in future.
  • 3.
    Decision tree invarious sectors: • Decision tree diagrams are often used by businesses to plan a strategy, analyze research, and come to conclusions. • Lenders and banks use decision trees to calculate the riskiness of loans and investment opportunities.
  • 4.
    Elements of decisiontree indicates condition indicates an action
  • 5.
    Limitations for DecisionTree: • The biggest limitation of our decision making is that we can only selecting from the known alternatives • Provide less information of the relationship
  • 6.
    Advantages: • Easy toUnderstand • Useful in Data exploration • Less data cleaning required. • Data type is not a constant. • Decision trees help formalize the brainstorming process so we can identify more potential solutions. • The advantages of a decision tree are fairly obvious: a “path” through possibilities, with alternatives, leading toward a desirable outcome.
  • 7.
    Disadvantages: • Over fitting •Not fit for continous variables. • Loss of innovation-only past experience go into the branching of choices, new ideas donot get much consideration
  • 8.
    Example: if student gotmarks >=90 percent then allot first category else if student got marks >=80 percent then allot second category else if student got marks>=50 percent&&<80 then allot third category else No admission end if else go to third category end if end if
  • 10.
    Decision Tables: • Decisiontables are visual representation for specifying which actions to perform depending on given conditions. • Information in decision tables could also be represented as decision trees or in a programming language as a series of if- then-else and switch-case statements.
  • 11.
    Why use decisiontables? • Powerful visualization • Preventing errors is easier
  • 12.
    Advantages: • A decisiontable may be easier to construct than a flowchart. • It is possible to check that all test combinations have been considered. • The tables show cause and effect relationships. • They use standardized format. • Easily understood making it very effective for communication between analysts or programmers and non-technical users.
  • 13.
    Disadvantages: • The totalsequence is not clearly shown, i.e., no overall picture is given by decision tables as presented by flowcharts. • Where the logic of a system is simple, flowcharts nearly always serve the purpose better than a decision table.
  • 14.
    Steps to drawdecision table: 1.Analyze the requirement and create the first coloumn. 2.Add coloumn 3.Reduce the table. Mark insignificant values with”-”. 4.Determine actions 5.Write test cases
  • 15.
    Conditio ns Rule 1 Rule2 Rule 3 Rule 4 Rule 5 Rule 6 Rule 7 Rule 8 marks>= 90percen t N N N N T T T T marks>= 80percen t N N T T - - - - marks>= 50%&&< 80% N T - - - - - - Actions First Category - - - - X X X X Second Category - - X X - - - - Third Category -ss X - - - - - - No admissio n X - - - - - - -
  • 16.
    References: • https://www.slideshare.net/DMANIMALA/decision-table-44548879 • http://www.answers.com/Q/What_are_advantages_and_disadvantages_of_d ecision_tables •https://www.coursehero.com/file/p4bc0fm/What-are-the-Advantages-of- Decision-Tables-1-This-type-of-testing-also-works/ • http://tryqa.com/what-is-decision-table-in-software-testing/ • https://en.wikipedia.org/wiki/Decision_table • https://study.com/academy/lesson/what-is-a-decision-tree-examples- advantages-role-in-management.html • https://en.wikipedia.org/wiki/Decision_tree • https://www.analyticsvidhya.com/blog/2016/04/complete-tutorial-tree-based- modeling-scratch-in-python/
  • 17.
  • 18.