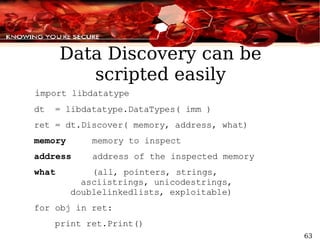
- Immunity Debugger is a tool for security researchers and exploit developers that provides improved interfaces, Python integration, and automated binary analysis capabilities compared to other debuggers.
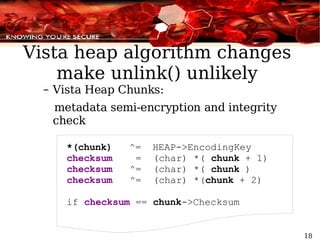
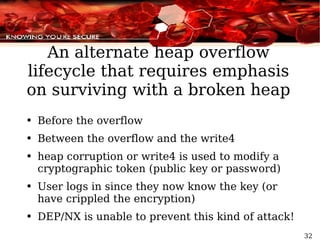
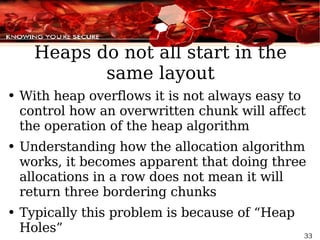
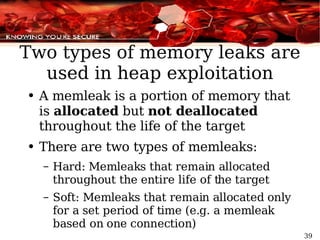
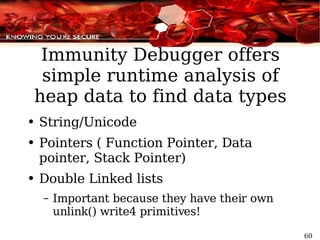
- It helps with challenges like heap exploitation on modern OSes, which requires understanding heap algorithms, controlling memory layout through leaks, and discovering data types in memory.
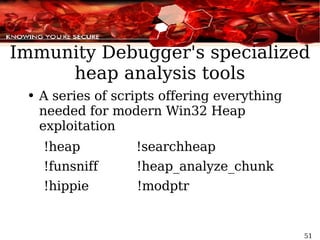
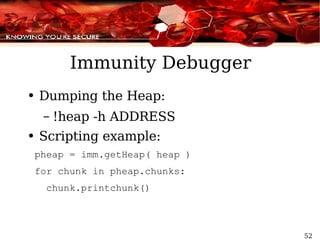
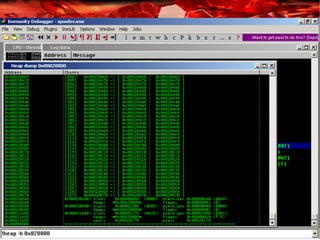
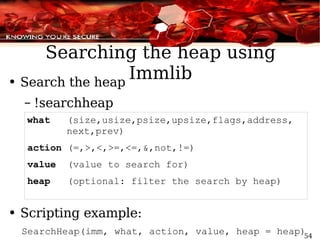
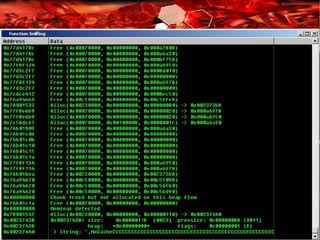
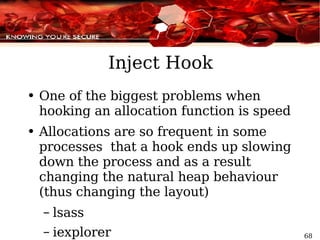
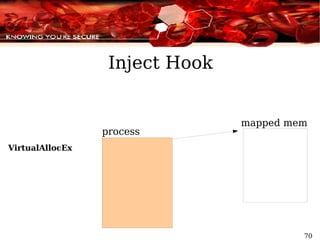
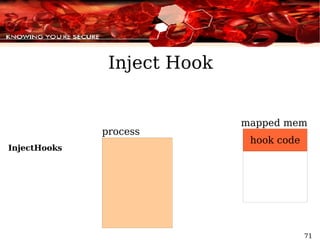
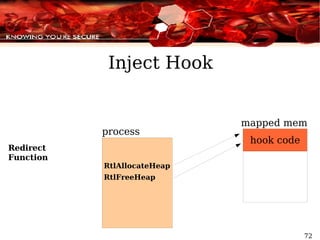
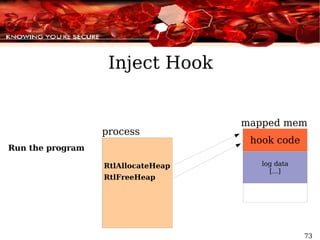
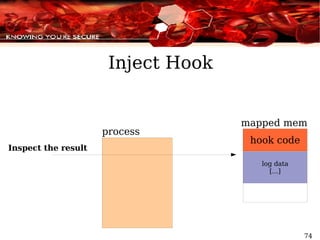
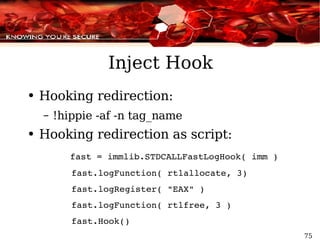
- The debugger includes specialized scripts and hooks to aid tasks like heap analysis, fingerprinting allocation patterns, fuzzing heaps, and injecting hooks to speed up analysis.
![Using Immunity Debugger to Write Exploits Security Research Dave Aitel, Nicolas Waisman [email_address] [email_address]](https://image.slidesharecdn.com/debuggingwithid-1217777741851007-8/85/Debugging-With-Id-1-320.jpg)

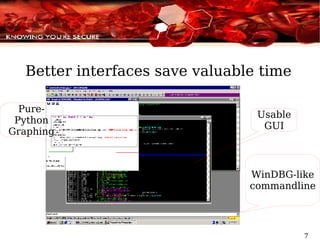
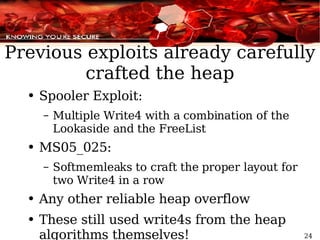
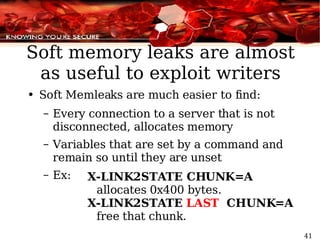
![A lot of excellent work has been done to bypass heap protections Taking advantage of Freelist[0] split mechanism (“ Exploiting Freelist[0] on XP SP2” by Brett Moore) Taking advantage of Single Linked List unlink on the Lookaside ( Oded Horovitz and Matt Connover) Heap Feng Shui in Javascript (Alexander Sotirov)](https://image.slidesharecdn.com/debuggingwithid-1217777741851007-8/85/Debugging-With-Id-21-320.jpg)
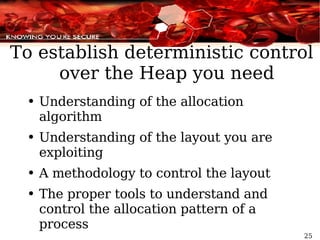
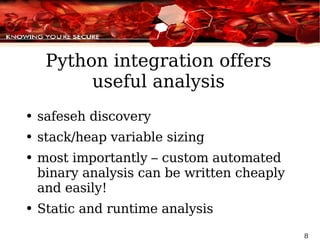
![Heap Holes Assume Vulnerable(function) A = Allocate(0x300); B = Allocate(0x300); [...] Overwrite(A); fn_ptr = B[4]; fn_ptr(“hello world”); Chunk is part of the FreeList[97]](https://image.slidesharecdn.com/debuggingwithid-1217777741851007-8/85/Debugging-With-Id-34-320.jpg)
![Heap Holes Assuming Vulnerable(function) A = Allocate(0x300); B = Allocate(0x300); [...] Overwrite(A); fn_ptr = B[4]; fn_ptr(“hello world”);](https://image.slidesharecdn.com/debuggingwithid-1217777741851007-8/85/Debugging-With-Id-35-320.jpg)
![Heap Holes Suppose Vulnerable(function) A = Allocate(0x300); B = Allocate(0x300); [...] Overwrite(A); fn_ptr = B[4]; fn_ptr(“hello world”);](https://image.slidesharecdn.com/debuggingwithid-1217777741851007-8/85/Debugging-With-Id-36-320.jpg)
![Heap Holes Suppose Vulnerable(function) A = Allocate(0x300); B = Allocate(0x300); [...] Overwrite(A); fn_ptr = B[4]; fn_ptr(“hello world”);](https://image.slidesharecdn.com/debuggingwithid-1217777741851007-8/85/Debugging-With-Id-37-320.jpg)
![Heap Holes Suppose Vulnerable(function) A = Allocate(0x300); B = Allocate(0x300); [...] Overwrite(A); fn_ptr = B[4]; fn_ptr(“hello world”);](https://image.slidesharecdn.com/debuggingwithid-1217777741851007-8/85/Debugging-With-Id-38-320.jpg)
![Heap Rule #1: Force and control the layout Assume again Vulnerable(function) A = Allocate(0x300); B = Allocate(0x300); [...] Overwrite(A); fn_ptr = B[4]; fn_ptr(“hello world”);](https://image.slidesharecdn.com/debuggingwithid-1217777741851007-8/85/Debugging-With-Id-43-320.jpg)
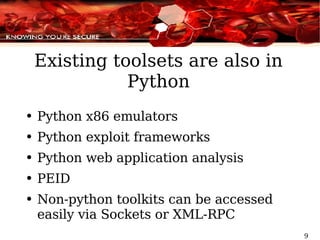
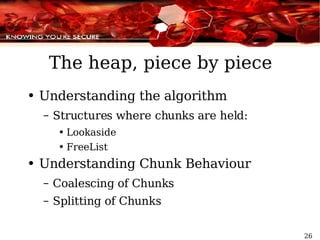
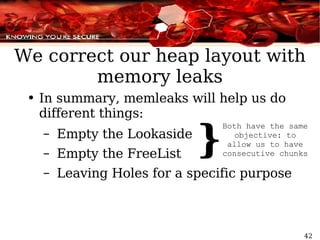
![memleak(768) Vulnerable(function) A = Allocate(0x300); B = Allocate(0x300); [...] Overwrite(A); fn_ptr = B[4]; fn_ptr(“hello world”); Heap Rule #1: Force and control the layout Calculating size: 768 + 8 = 776 776/8 = entry 97](https://image.slidesharecdn.com/debuggingwithid-1217777741851007-8/85/Debugging-With-Id-44-320.jpg)
![memleak(768) Vulnerable(function) A = Allocate(0x300); B = Allocate(0x300); [...] Overwrite(A); fn_ptr = B[4]; fn_ptr(“hello world”); Heap Rule #1: Force and control the layout](https://image.slidesharecdn.com/debuggingwithid-1217777741851007-8/85/Debugging-With-Id-45-320.jpg)
![memleak(768) Vulnerable(function) A = Allocate(0x300); B = Allocate(0x300); [...] Overwrite(A); fn_ptr = B[4]; fn_ptr(“hello world”); Heap Rule #1: Force and control the layout](https://image.slidesharecdn.com/debuggingwithid-1217777741851007-8/85/Debugging-With-Id-46-320.jpg)
![memleak(768) Vulnerable(function) A = Allocate(0x300); B = Allocate(0x300); [...] Overwrite(A); fn_ptr = B[4]; fn_ptr(“hello world”); Heap Rule #1: Force and control the layout](https://image.slidesharecdn.com/debuggingwithid-1217777741851007-8/85/Debugging-With-Id-47-320.jpg)
![memleak(768) Vulnerable(function) A = Allocate(0x300); B = Allocate(0x300); [...] Overwrite(A); fn_ptr = B[4]; fn_ptr(“hello world”); Heap Rule #1: Force and control the layout](https://image.slidesharecdn.com/debuggingwithid-1217777741851007-8/85/Debugging-With-Id-48-320.jpg)


![Thank you for your time Contact us at: [email_address] [email_address] Security Research Team](https://image.slidesharecdn.com/debuggingwithid-1217777741851007-8/85/Debugging-With-Id-79-320.jpg)


![[ENG] Hacktivity 2013 - Alice in eXploitland](https://cdn.slidesharecdn.com/ss_thumbnails/exploitland-131019060054-phpapp02-thumbnail.jpg?width=640&height=640&fit=bounds)


![Reversing & Malware Analysis Training Part 11 - Exploit Development [Advanced]](https://cdn.slidesharecdn.com/ss_thumbnails/reversingmalwareanalysistrainingpart11-exploitdevelopmentadvanced-120908121200-phpapp02-thumbnail.jpg?width=640&height=640&fit=bounds)