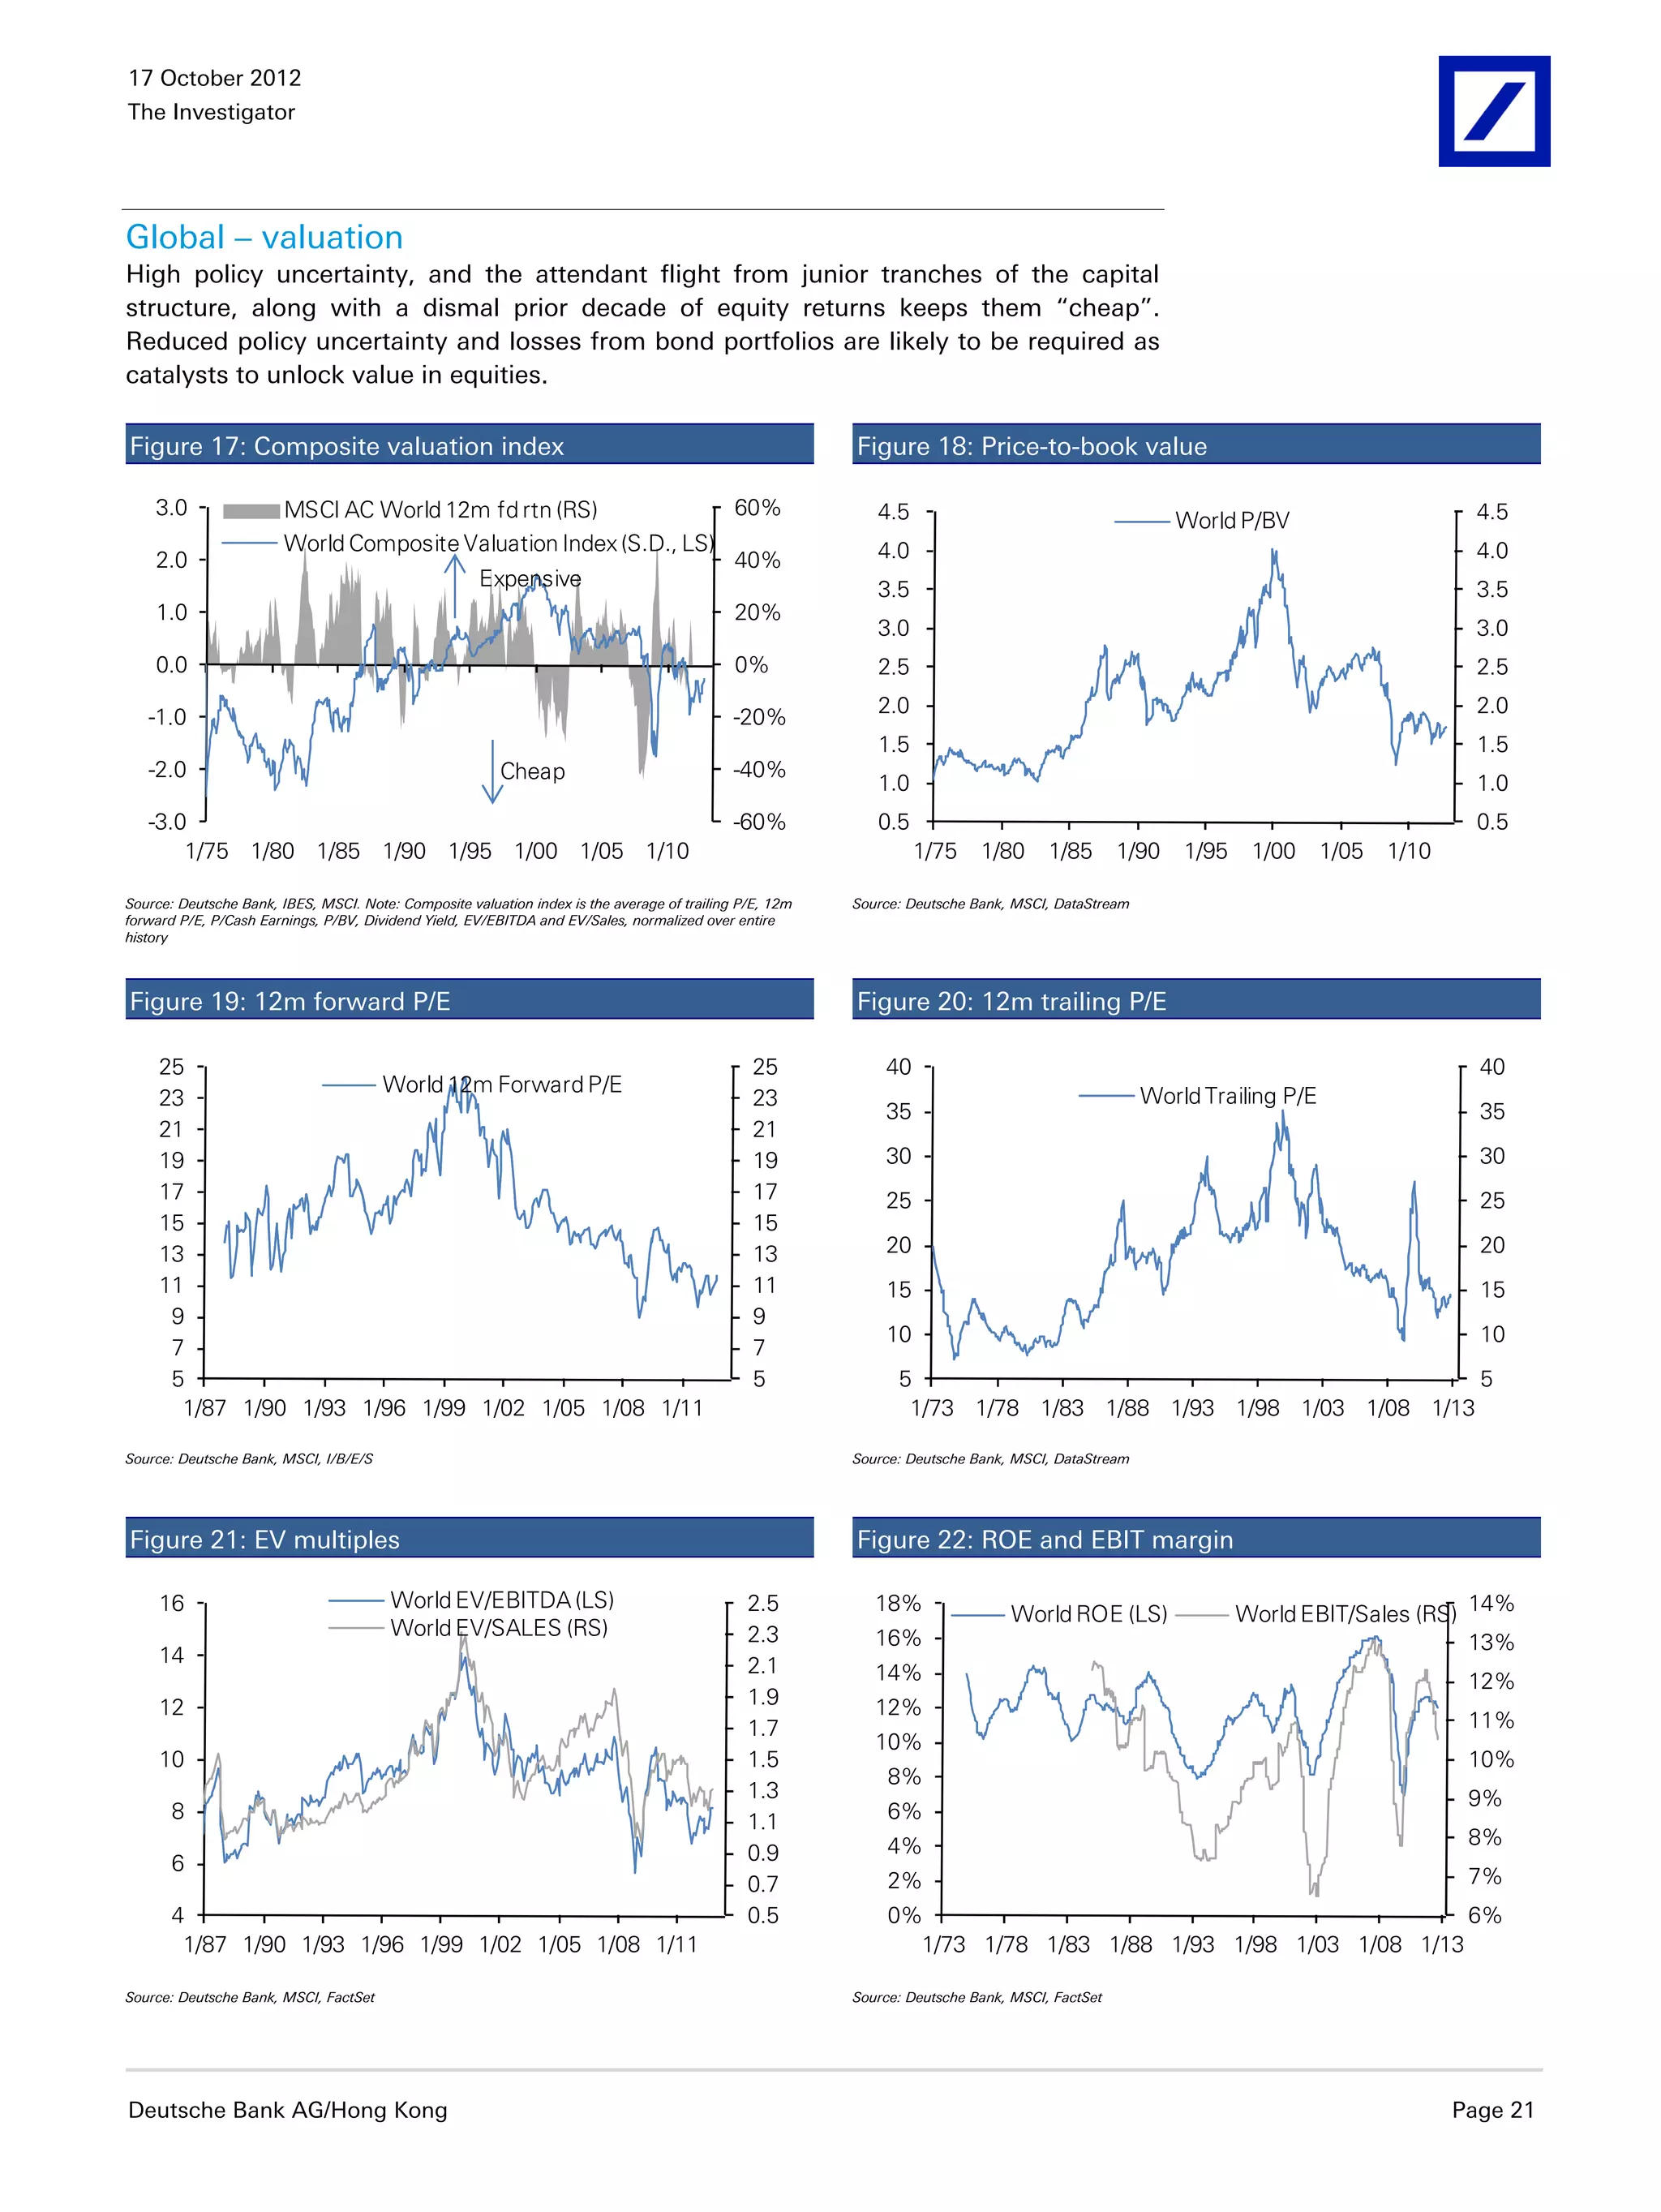
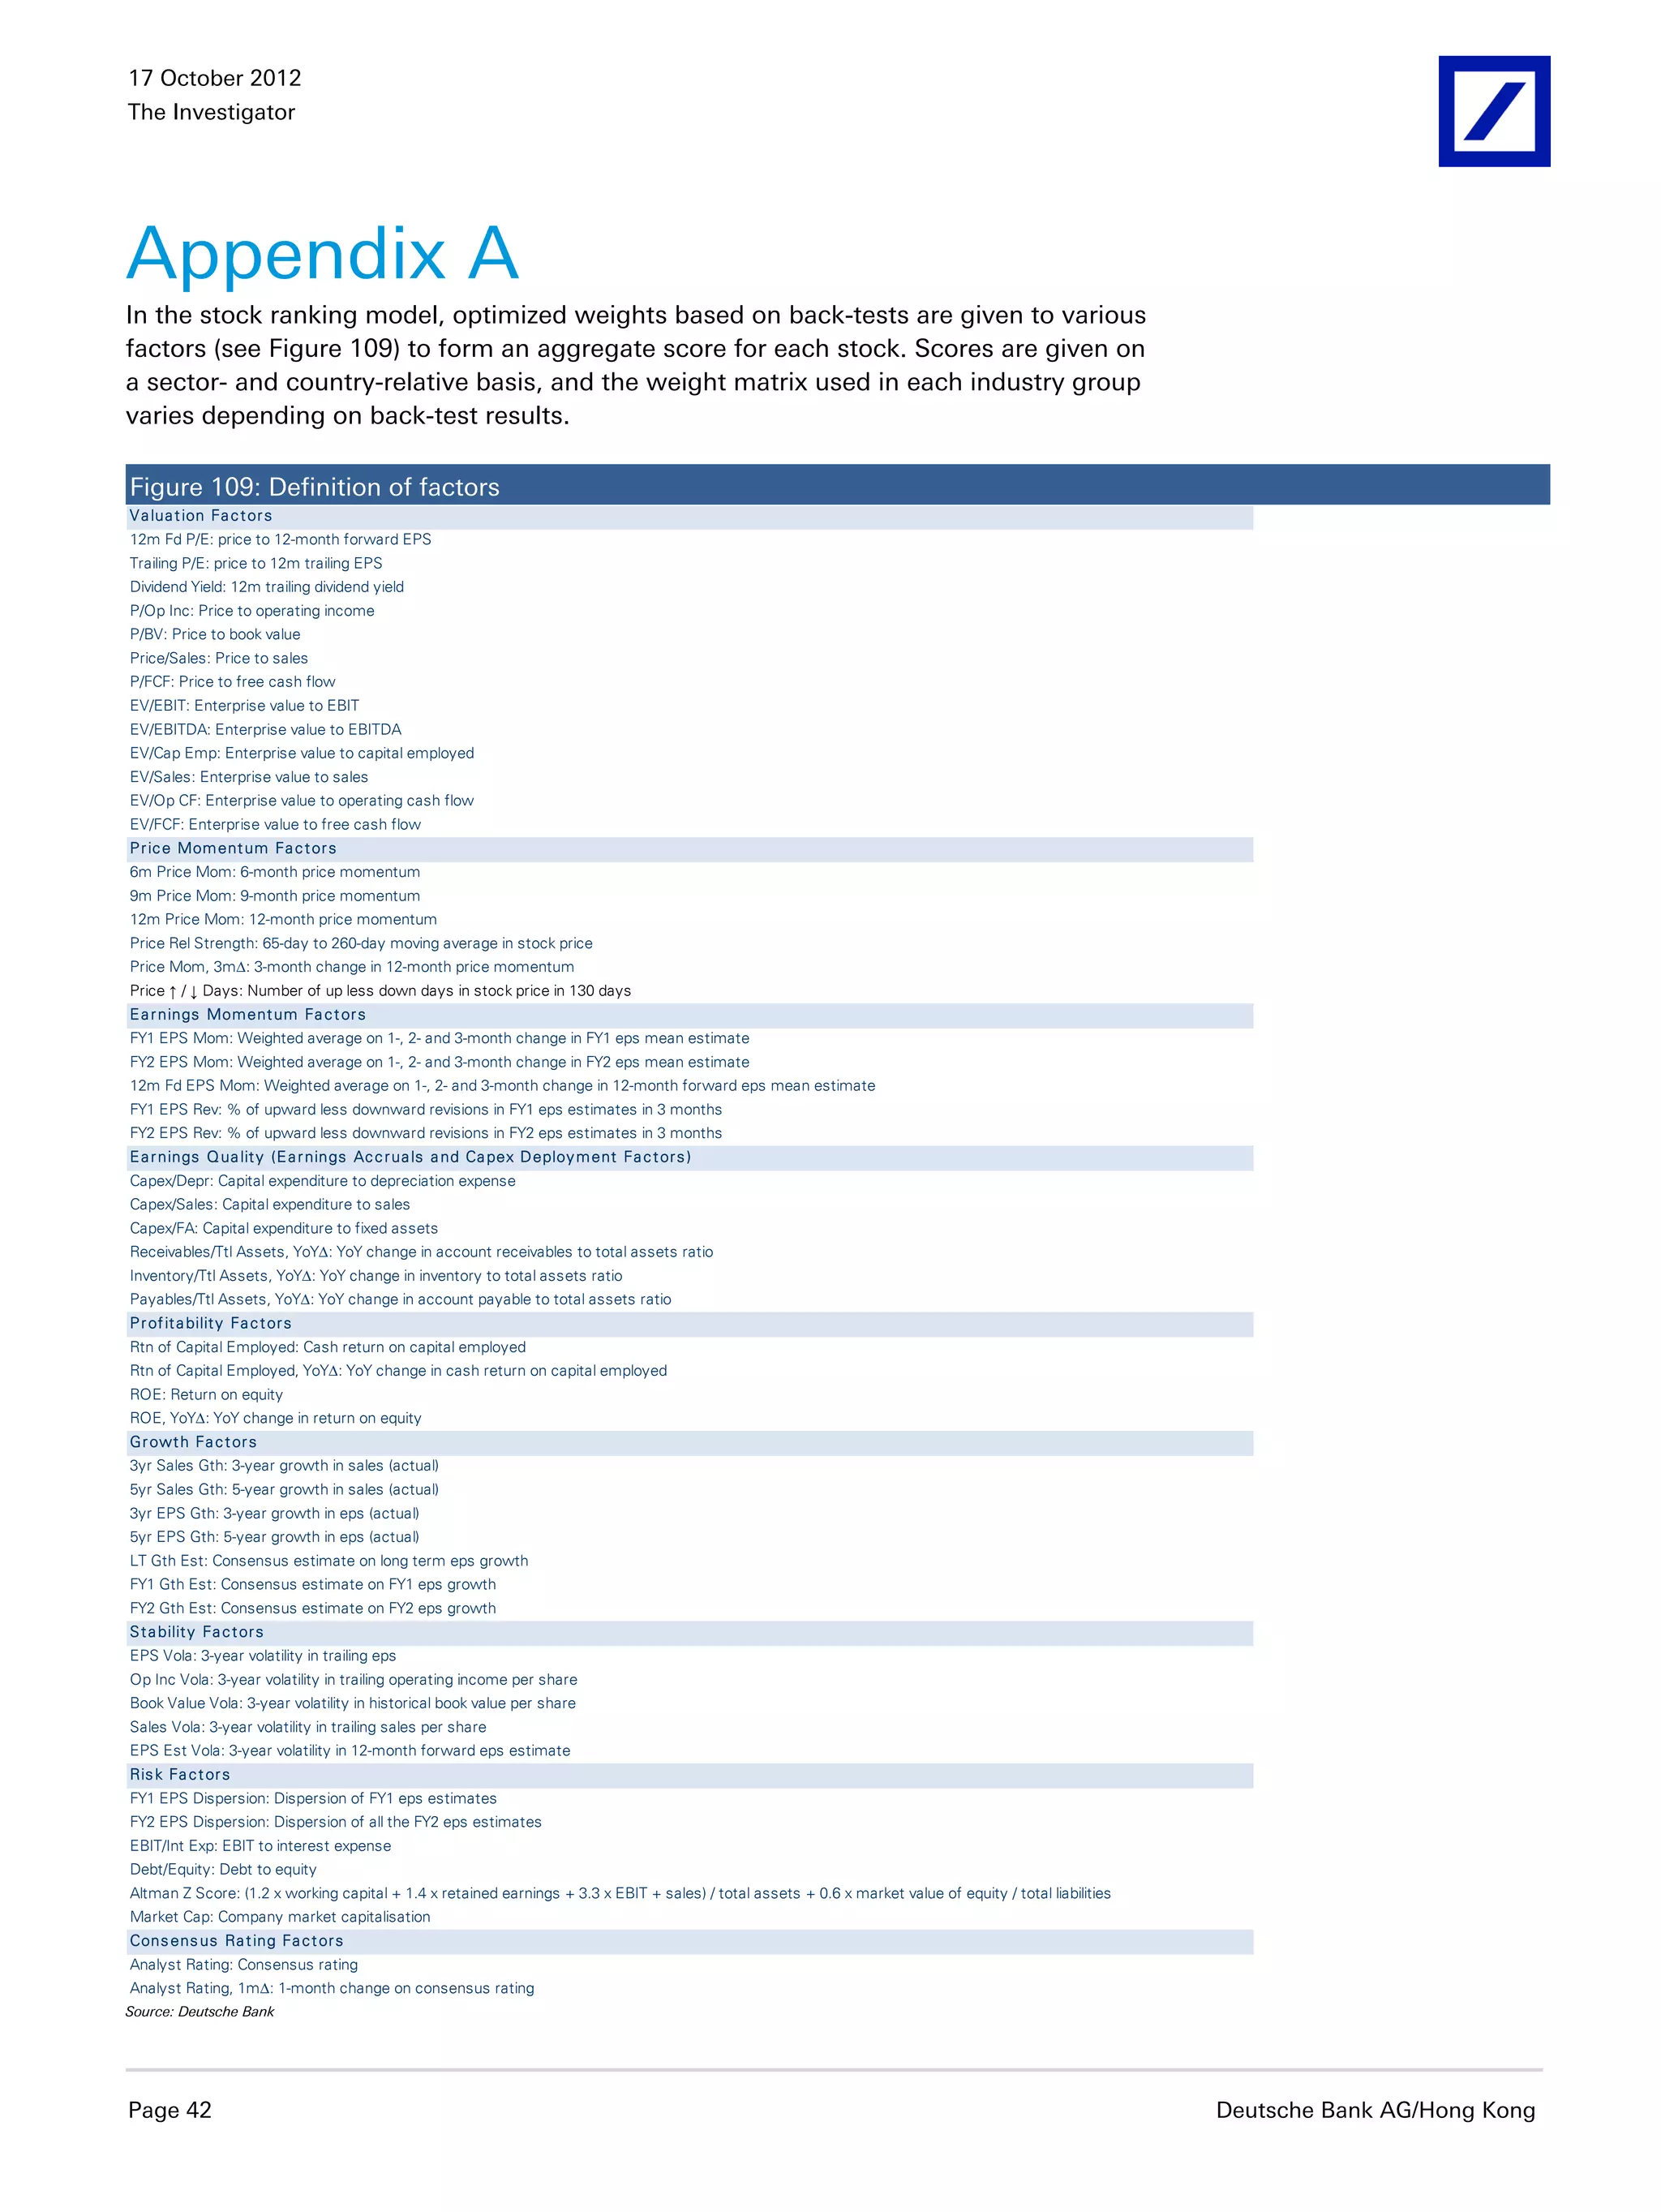
Deutsche Bank
Markets Research

Asia                                Strategy                                                   Date
                                                                                               17 October 2012
                                    The Investigator
                                                                                               Strategy Update

                                                                                               Ajay Kapur, CFA

Policy Uncertainty – The Financial                                                             Strategist
                                                                                               (+852) 2203 6196

World's Dominator                                                                              ajay.kapur@db.com


                                                                                               Ritesh Samadhiya, CFA
Elevated Economic Policy Uncertainty – about to drop?
We might be at an important inflection point in the financial markets. The elevation of        Strategist
Economic Policy Uncertainty, since 2008, to twice the level of the previous 23 years has       (+852) 2203 6251
increased the equity risk premium, diminished the opportunity set for stock-picking, and       ritesh.samadhiya@db.com
favored defensive stocks over cyclicals. Finance professionals and investors may have
wrongly concluded that this state of affairs will be prolonged and enduring. We think this     Absolute Return Drivers
status quo view is wrong, and that we could be at a turning point, and that economic


                                                                                                                                                                                     Current Account Balance/GDP
policy uncertainty has probably peaked. Let the profitable boredom begin!
US Political Polarization at 130-year high


                                                                                                                                       Sentiment (Risk-Love)
Political polarization might just recede with this coming US election. Financial


                                                                                                                                                                                                                                                 Total Score (current)
                                                                                                                                                                                                                   Real Exchange Rate
deregulation – a key driver of complexity, the consequent compensation premium in the


                                                                                                                                                                                                                                                                         Total Score (last)
financial sector, the rise in the ratio of bank fee income to total income, and income
inequality, all likely peaked together in 2008. Any potential reduction in political


                                                                                                                                                               Technicals
                                                                                                                           Valuation
polarization will likely involve compromise, less policy uncertainty, and a lower likelihood


                                                                                                               Liquidity


                                                                                                                                                                            Growth
of policies being overturned with every election.


                                                                                                                                                                                                                                        Policy
Economic Policy Uncertainty highly correlated with poor stock-picking efficacy
Economic Policy Uncertainty is a function of media mentions of the issue, laws dropping        China                                                                                                                                                     8                    -2
off the books, and economic forecast dispersion. The correlation coefficient between           Hong Kong                                                                                                                                               -2                     -2
Economic Policy Uncertainty and stock-picking efficacy was only 0.09 between 1985 and          Indonesia                                                                                                                                                 1                      0
2007. Since then it has jumped to 0.74. As a stock-picker, you want Economic Policy            India                                                                                                                                                     4                      3
Uncertainty to fall. Adjusted for portfolio volatility, the stock-picking opportunity will     Korea                                                                                                                                                     6                    -3
become much wider if uncertainty drops.                                                        Malaysia                                                                                                                                                  2                      3
Economic Policy Uncertainty is highly correlated with equity risk premium and                  Philippines                                                                                                                                               5                      0
defensives over cyclicals                                                                      Singapore                                                                                                                                               -2                       4
From 1985 to 2007, there was NO relationship between the two, a correlation coefficient        Thailand                                                                                                                                                  4                      6
of -0.07. Since 2008, however, the correlation coefficient between policy uncertainty and
                                                                                               Taiwan                                                                                                                                                    1                      0
equity risk premium has shot up to 0.67! Presumably, stocks are “cheap” compared with
                                                                                               Asia ex-Japan                                                                                                                                             4                    -2
bonds, since policy is uncertain, the impact on cash flows is uncertain and, as the most
                                                                                               Japan                                                                                                                                                     2                    -4
junior entity in the capital structure, stocks need to be cheap to compensate for this
policy uncertainty.
Economic Policy Uncertainty probably peaking out globally: huge implications
                                                                                               Our model portfolio is available as a DB
In the US, a 130-year peak in political polarization and an important election on what to
do about this polarization should help resolve things one way or another. Whatever the         thematic basket (DBHKASTR).
outcome of the election, another four years of peak political polarization is not what the
electorate is voting for. In Europe, there is still a long way to go on reducing policy
uncertainty on the part of governments, north and southern Europe, and within provinces
in countries, but the ECB’s views are quite clear, agree or disagree with them. In China,
the important political transition that occurs once in a decade will soon be over.
Governance and policy – the work of government – can then get renewed attention. In
India, after a period of lethargy, the government has recently been invigorated and policy
has come unstuck. Of course, this is all speculation and could be wrong, but not having a
view on the direction of Policy Uncertainty is NOT an option for financial professionals,
given its salience.
We are adding Top Glove Corp Bhd, Korea Zinc Co Ltd., Ace Hardware and Shree
Cement Ltd to the model portfolio. The model portfolio is up 23.1% YTD vs. 13.3% for
MSCI AXJ.
________________________________________________________________________________________________________________
Deutsche Bank AG/Hong Kong
All prices are those current at the end of the previous trading session unless otherwise indicated. Prices are sourced
from local exchanges via Reuters, Bloomberg and other vendors. Data is sourced from Deutsche Bank and subject
companies. Deutsche Bank does and seeks to do business with companies covered in its research reports. Thus,
investors should be aware that the firm may have a conflict of interest that could affect the objectivity of this report.
Investors should consider this report as only a single factor in making their investment decision. DISCLOSURES AND
ANALYST CERTIFICATIONS ARE LOCATED IN APPENDIX 1. MICA(P) 072/04/2012.
17 October 2012
The Investigator


Table Of Contents
Policy Uncertainty – The Financial World’s Dominator ..................................................... 3 
Asia Model Portfolio update ............................................................................................... 8 
Country selection .............................................................................................................. 15 
Country-sector selection .................................................................................................. 16 
Asia Model Portfolio ......................................................................................................... 20 
Global – valuation ............................................................................................................. 21 
Global metrics ................................................................................................................... 22 
Global metrics (continued) ............................................................................................... 23 
Global – market intelligence ............................................................................................. 24 
Global – market intelligence (continued) .......................................................................... 25 
Asia – valuation ................................................................................................................ 26 
Asia – investor sentiment ................................................................................................. 27 
Asia – technicals ............................................................................................................... 28 
Asia – growth and earnings.............................................................................................. 29 
Asia – liquidity .................................................................................................................. 30 
Asia – factor performance ................................................................................................ 31 
Asia – market intelligence ................................................................................................ 33 
Japan – valuations ............................................................................................................ 34 
Japan – investor sentiment .............................................................................................. 35 
Japan – technicals ............................................................................................................ 36 
Japan – growth and earnings ........................................................................................... 37 
Japan – liquidity ................................................................................................................ 38 
Japan – factor performance ............................................................................................. 39 
Japan – market intelligence.............................................................................................. 40 
Companies Mentioned ..................................................................................................... 41 

Appendix A ................................................................................... 42 


Page 2                                                                                                                                    Deutsche Bank AG/Hong Kong
17 October 2012
The Investigator


Policy Uncertainty – The Financial World’s Dominator

The only thing that matters – policy uncertainty and polarization
We contend that the main driver of the level of equity markets, the relative performance
of risk assets versus “safe” assets, and the potential opportunity for stock-pricing –
pretty much what defines a finance professional’s life – are increasingly determined by
just one primary factor. The rest of it – all those company meetings, the travel,
spreadsheets, conferences and broker research reports – are less salient compared to
this one factor. This is a bold claim. So what is this salient, primary factor? And can we
prove our contention? It is, in our view, Policy Uncertainty.

A few academics have quantified this for the US and Europe, and we will try to prove
our point regarding its link with changes in the equity risk premium, the relative
performance of risky versus “safe assets” and the stock-picking opportunity set. We
will also speculate that Policy Uncertainty in the world is about to downshift remarkably
from current ungainly elevated levels. If we are right, this will have hugely positive
implications for equities, risk assets and the opportunities for stock-picking. So far,
since the financial crisis broke out, Policy Uncertainty has been at twice the level of the
previous 23 years, keeping the equity risk premium high, challenging risky assets versus
“safe assets”, and rendering stock-picking opportunities exceptionally tough. All that
might be about to change.

But first a quick point on political polarization in the USA, where we have the data. As
Figure 1 shows, political polarization in the USA, proxied by how often Republicans vote
similarly to one another, as do Democrats, is at a record high since 1880! It is like two
sullen adults sitting at opposite ends of a see-saw, looking away from each other. With
that degree of entrenched polarization, it is tough to get policies passed, and a
malodorous air of policy inaction and uncertainty hangs heavy in the land. Note in
Figure 1 how policy polarization correlates well with income inequality (or plutonomy).
(Interested readers in the concept of political polarization should go to
http://www.slate.com/articles/life/do_the_math/2001/12/growing_apart.single.html, The
Mathematical Evidence for Congress’ Growing Polarization by Jordan Ellenberg1.) Our
humble contention is that time-series that are at 130-year extremes are most likely to
mean revert, however fanciful that might seem at the time of the extreme. In other
words, political polarization might just recede with this coming US election. Financial
deregulation – a key driver of complexity, the consequent compensation premium in the
financial sector, the rise in the ratio of bank fee income to total income, and income
inequality, all likely peaked together in 2008. Any potential reduction in political
polarization will likely involve compromise, less policy uncertainty, and less of a
likelihood of policies being overturned with every election. As Figure 2 shows, more
policy certainty would diminish one key headache for business.

Economic Policy Uncertainty
Scott Baker, Nick Bloom and Steven Davis at Stanford have constructed Economic
Policy Uncertainty indices for the US, Europe and Canada. For the US, in their words:

To measure policy-related economic uncertainty, we construct an index from three types of underlying
components. One component quantifies newspaper coverage of policy-related economic uncertainty. A second
component reflects the number of federal tax code provisions set to expire in future years. The third component
uses disagreement among economic forecasters as a proxy for uncertainty.


The first component is an index of search results from 10 large newspapers. The newspapers included in our
index are USA Today, the Miami Herald, the Chicago Tribune, the Washington Post, the Los Angeles Times,


1
    Also see the original authors’ work at http://voteview.com/Polarized_America.htm#MPRBOOK

Deutsche Bank AG/Hong Kong                                                                                        Page 3
17 October 2012
The Investigator


the Boston Globe, the San Francisco Chronicle, the Dallas Morning News, the New York Times, and the Wall
Street Journal. From these papers, we construct a normalized index of the volume of news articles discussing
economic policy uncertainty of some type. The second component of our index draws on reports by the
Congressional Budget Office (CBO) that compile lists of temporary federal tax code provisions. We create
annual discounted numbers of tax code provisions scheduled to expire for each year, giving a measure of the
level of uncertainty regarding the path that the federal tax code will take in the future. The third component of
our policy-related uncertainty index draws on the Federal Reserve Bank of Philadelphia's Survey of
Professional Forecasters. Here, we utilize the dispersion between individual forecasters' predictions about
future levels of the Consumer Price Index, Federal Expenditures, and State and Local Expenditures to
construct indices of uncertainty about policy-related macroeconomic variables. (From their website,
www.policyuncertainty.com)


Figure 1: US: record political polarization and income inequality – about to reverse?
 1.2                                                                                                                                        20
                                                                                                  Higher
 1.1                                                                                                                                        18
                                                                                                  Polarization
 1.0                                                                                                                                        16
 0.9
                                                                                                                                            14
 0.8
                                                                                                                                            12
 0.7
                                                                                                                                            10
 0.6
                                                                                                                                            8
 0.5
 0.4                                                                                                                                        6
                      House Polarization, LS
 0.3                  Senate Polarization, LS                                                                                               4
                      Income share of the top 1% (excluding capital gains), RS
 0.2                                                                                                                                        2
       1879                1899                1919                1939                1959                1979                1999
Source: Deutsche Bank. Polarization is measured as difference in party means - first dimension. http://voteview.com/Polarized_America.htm


Figure 2: US: Economic Uncertainty a huge problem


Source: NFIB

Figure 3 shows the US, European and Canadian Economic Policy uncertainty indices.
We will use the US version for our arguments here. Figure 4 shows the US Economic


Page 4                                                                                                                                           Deutsche Bank AG/Hong Kong
17 October 2012
The Investigator


Policy Uncertainty Index alongside the average US stock performance correlations with
the MSCI USA benchmark (a proxy for the potential efficacy of stock picking. If stocks
all move in the same direction with the benchmark, it reduces the efficacy of stock-
picking, once we adjust for portfolio volatility). A few things stand out. As the inventors
of the index note, US Economic Policy Uncertainty since 2007 has been at twice the
level of the prior 23 years. As Figure 4 also shows, the relationship between Economic
Policy Uncertainty and the stock-picking opportunity set has increased markedly since
2008. The correlation coefficient between Economic Policy Uncertainty and stock-
picking efficacy was only 0.09 between 1985 and 2007. Since then, it has jumped to
0.74. If you are a stock-picker, you want Economic Policy Uncertainty to subside, big
time. Adjusted for portfolio volatility, the stock picking opportunity will become much
wider, and life presumably a bit less stressful. Having a view on Economic Policy
Uncertainty is critical.


Figure 3: Economic Policy Uncertainty has been elevated since 2008, about to drop?
300                                                                                                                                                       300
                         US Economic Policy Uncertainty Index

250                      European Economic Policy Uncertainty Index                                            High policy                                250
                                                                                                               uncertainty
                         Canadian Economic Policy Uncertainty Index
200                                                                                                                                                       200


150                                                                                                                                                       150


100                                                                                                                                                       100


  50                                                                                                                                                      50


    0                                                                                                                                                     0
        1/85         1/88          1/91           1/94          1/97           1/00            1/03         1/06           1/09           1/12
Source: Deutsche Bank, Scott Baker, Nick Bloom and Steven Davis (www.policyuncertainty.com)


Figure 4: Economic Policy Uncertainty and stock correlations with the benchmark move
together. Stock-picking to become more potent as Policy Uncertainty drops
  0.9                                Average US stock performance (60 trading days)                                   EU credit crisis                    300
                                     correlations with MSCI USA, LS                                       Lehman Failure
  0.8     87 crash                   US Economic Policy Uncertainty measure, RS
                                                                                                                                                          250
  0.7                                                              Worldcom Scandal
                                            High                                                          High policy
                                            economic                                                      uncertainty
  0.6                                                          LTCM                                                                                       200
                                            policy
                    US recession            uncertainty Asian
  0.5
                                                        Crisis
                                                                                                                                                          150
  0.4

  0.3                                                                                                                                                     100
                                                                                                                           Macro-driven market,
  0.2                                                                                                                        correlation 0.74
                                                                                                                                                          50
  0.1
                        Stock-pickers market, correlation 0.09
  0.0                                                                                                                                                     0
     1/86       1/88      1/90       1/92      1/94      1/96       1/98      1/00      1/02       1/04      1/06       1/08      1/10      1/12
Source: Deutsche Bank, Stock correlations with MSCI USA based on rolling 60-day daily returns on a broad universe of stocks covering the top 95% of total
market capitalization (i.e.1,053 to 2,684 stocks from 1985 to 2012). For more on the “Economic Policy Uncertainty Index”, go to the website
http://policyuncertainty.com. According to the authors, “To measure policy-related economic uncertainty, we construct an index from three types of underlying
components. One component quantifies newspaper coverage of policy-related economic uncertainty. A second component reflects the number of federal tax
code provisions set to expire in future years. The third component uses disagreement among economic forecasters as a proxy for uncertainty.”


Figure 5 shows the relationship between the US Economic Policy Uncertainty index and
the equity risk premium (the higher it is, the “cheaper” stocks are versus bonds). From
1985 to 2007, there was NO relationship between the two, a correlation coefficient of -
0.07. Since 2008, however, the correlation coefficient between policy uncertainty and


Deutsche Bank AG/Hong Kong                                                                                                                                      Page 5
17 October 2012
The Investigator


the equity risk premium has shot up to 0.67! Presumably, stocks are “cheap” compared
with bonds, since policy is uncertain, the impact on cash flows is uncertain and, as the
most junior entity in the capital structure, stocks need to be cheap to compensate for
this policy uncertainty. Logically, if the correlation holds and there is a substantial
decline in policy uncertainty, the equity risk premium could decline in tandem – stocks
would beat bonds massively. Having a view on Economic Policy Uncertainty is critical.
How about defensive sectors versus cyclicals? Does US Economic Policy Uncertainty
have any role here? Yes. As Figure 6 shows, changes in US Economic Policy
Uncertainty relate well with changes in the relative performance of defensives versus
cyclicals. The correlation coefficient has doubled from 0.33 between 1985-2007 and
2008 now. As policy uncertainty rises, there is an unsurprising rush to defensives, and
vice versa. Again, this relationship has been a lot more salient since 2008. Having a
view on Economic Policy Uncertainty is critical.


Figure 5: Equity Risk Premium and Economic Policy Uncertainty have moved in lock-
step since 2008. Unlocking equity risk premium if Policy Uncertainty drops
250                                                                                                                                          8%
                                                                                                            High policy
230                  US Economic Policy Uncertainty Index,                                                  uncertainty
                     3mma, LS                                                                                                                6%
210
                     Equity Risk Premium (S&P500 earnings                                                                                    4%
190
                     yield less 10yr bond yield), RS
170
                                                                                                                                             2%
150
                                                                                                                                             0%
130
110                                                                                                                                          -2%
                                                                                                                       Correlation 0.67
  90
                         Correlation -0.07                                                                                                   -4%
  70
  50                                                                                                                                         -6%
       1/85    1/87      1/89      1/91     1/93      1/95      1/97     1/99      1/01      1/03     1/05      1/07    1/09   1/11   1/13
Source: Deutsche Bank


Figure 6: Defensives versus Cyclicals ( or risk-off versus risk-on) moves with changes in
Economic Policy Uncertainty
 80%                      Economic Policy Uncertainty, 6m change, LS                                                                         80%

 60%                      US defensive sectors / cyclical sectors, 6 month change, RS                                                        60%

 40%                                                                                                                                         40%

 20%                                                                                                                                         20%

   0%                                                                                                                                        0%
        1/85 1/87 1/89 1/91 1/93 1/95 1/97 1/99 1/01 1/03 1/05 1/07 1/09 1/11 1/13
-20%                                                                                                                                         -20%

-40%                                         Correlation 0.33                                                          Correlation 0.68      -40%

-60%          Defensive sectors are Consumer staples,                                                                                        -60%
              healthcare, utilities and telecom.
-80%                                                                                                                                         -80%
Source: Deutsche Bank. Defensive sector price index is from Datastream while MSCI CYC Index is used for cyclicals.


So what is our view on Policy Uncertainty globally? We can only speculate on this, but
it is important to do so. In the US, a 130-year peak in political polarization and an
important election on what to do about this polarization should help resolve things one
way or another. Whatever the outcome of the election, we think it’s safe to say that
another four years of peak political polarization is not what the electorate is hoping for.
The party that loses is unlikely to find recalcitrance and obstructionism a future vote-
gathering strategy, in our view. Of course, we could be wrong and the logjam, the


Page 6                                                                                                                                              Deutsche Bank AG/Hong Kong
17 October 2012
The Investigator


polarization, the policy uncertainty could go on for longer. In Europe, the ECB approved
its aggressive bond-buying plan with just one dissenter. While there is still a long way
to go on reducing policy uncertainty on the part of governments, north and southern
Europe, and within provinces in countries, the ECB’s views are quite clear, agree or
disagree with them. In China, the important political transition that occurs once in a
decade will soon be over. A renewed focus on governance and policy – the work of
government – can then begin. In India, after a period of lethargy, the government has
recently been invigorated and policy has come unstuck.

With the passage of time since the outbreak of the financial crisis, there is early
empirical evidence in the "austerity versus fiscal spending" debate. 2 As more time
elapses and more empirical results reveal themselves, we believe policy uncertainty will
likely diminish. Policymakers and voters will be better informed about the consequences
of opposing policy choices. Thus, the menu of successful policy options will likely shrink
– there should be less uncertainty about the "right" policy course.

Our simple read is that the substantial elevation of policy uncertainty around the world
is probably coming to an end. The confusion of policymakers in facing the rather unique
challenges of a once-in-seventy-years potential debt deflation was understandable. It is
by no means all blue skies from here, but policymakers and politicians are both learning
what is “working”, and what is not. Electorates are making choices about the direction
they want to go in, rather than the logjam of the past five years. Debtors and creditors
always fight about loss allocation in a debt crisis – time is the only healer that can bring
them together, however reluctantly. That time seems to be approaching. Again, this is
simple expectation on our part, and we could be plain wrong. But we stress that not
having a view on the direction of Policy Uncertainty is NOT an option for financial
professionals.

In sum, we might be at an important inflection point in financial markets. The elevation
of Economic Policy Uncertainty since 2008 has elevated the equity risk premium,
diminished the opportunity set for stock-picking, and favored defensive stocks over
cyclicals. The mindset of finance professionals and investors might have wrongly
concluded that this state of affairs is going to be prolonged and enduring – that bonds
are better than stocks, that stock-picking is ruinously counter-productive in this “macro-
driven” market, and that defensives are superior investments to cyclicals. This view
implies a continued elevated level of global Economic Policy Uncertainty. We think this
status quo view is wrong, and that we could be at a turning point, and that economic
policy uncertainty has probably peaked. Let the profitable boredom begin!


2
 See the latest IMF World Economic Outlook, Coping with High Debt and Sluggish Growth and Fiscal Policy in a
Depressed Economy by Lawrence H. Summers and J. Bradford DeLong.
(www.brookings.edu/~/.../2012_spring_BPEA_delongsummers.pdf)


Deutsche Bank AG/Hong Kong                                                                                     Page 7
17 October 2012
The Investigator


Asia Model Portfolio update
We are removing Hyundai Motor Co, Hyundai Mobis, Simplo Technology Co Ltd and
Starhub Ltd. Hyundai Motor and Hyundai Mobis have dropped to the fourth and third
quintile respectively in our multifactor stock ranking model. Hyundai Motor looks
weaker (relative to the region) on profitability, growth and earnings momentum.
Hyundai Mobis is now looking expensive and has lower earnings momentum. Simplo
Technology faded on price momentum, earnings momentum and consensus rating
metrics. We are cutting Singapore on poor earnings revisions and dropping Starhub
from the model portfolio.

We are adding Top Glove Corp Bhd, Korea Zinc Co Ltd, Ace Hardware and Shree
Cement Ltd. Top Glove ranks highly on valuation, earnings and price momentum. Korea
Zinc looks better on profitability, earnings, price momentum and earnings quality. Ace
hardware, though looking expensive, scores well on profitability, growth, earnings and
price momentum. Shree Cement looks good on profitability, earnings, price momentum
and consensus analyst rating. For factor description, see appendix A.

Top Glove Corp Bhd (TOPG MK)
Outlook remains positive; reiterating Buy. Disciplined capacity expansion plans,
expectations of leveling raw material prices as a result of higher rubber production in
ASEAN and slower consumption growth globally, as well as resilient demand for rubber
gloves for medical and hygiene purposes should drive multi-year growth for the sector
and allow Top Glove to generate two-year (FY13-15E) net profit CAGR of 14%, in our
view. We reiterate our Buy recommendation with a price target of RM6.05/share,
implying a total return of 21%. (Michelle Foong, 12 October 2012)

Korea Zinc Co Ltd (010130 KS)
Gold/silver price forecast upgrades affect Zijin/Zhaojin/Korea Zinc. Deutsche Bank’s
global commodity team has upgraded its gold/silver price forecasts by 2.4% for 2013
and 11.1% for 2014 in light of further central bank action to expand monetary
conditions. The most relevant stocks in Asia ex-Japan are Zijin, Zhaojin and Korea Zinc
(50% revenue exposure). We raise Zijin/Zhaojin/Korea Zinc’s 2013E earnings by
2.4%/5.1%/1.5%, respectively. Our DCF valuation method differentiates Zijin (Buy) from
Zhaojin (downgrade from Buy to Hold), with target price upgrades at 5.6% and 8.3%,
respectively. We believe the bullishness on the gold price has been factored into
Zhaojin’s share price, after a 36% rally in the past month. We roll over Korea Zinc’s
target price to 2013-based and raise it by 24%. Overall, Zijin and Korea Zinc stand out
after the upgrades, with their target prices now implying 20% and 27% upside potential.
(Chanwook Park, 4 October, 2012)

Ace Hardware (ACES IJ)
Consistently delivering strong growth and aggressive expansion. We believe that Ace
Hardware Indonesia will continue to deliver strong growth as it is one of the best
proxies for the expanding middle class, enjoying a forecast earnings CAGR of 22% over
the next three years. Management has a strong operational and financial track record,
delivering a sales CAGR of 32% on expansion of 21% over the past three years. We
believe the company is on track to have 100 stores in the next three years, which is a
43% increase. Maintaining Buy with new DCF-based target price of Rp8,000 (from
Rp5,000). (Reggy Susanto, 28 September, 2012)

Shree Cement (SRCM IN)
A high FCF yield of over 9% in FY13e, EBITDA CAGR of 27% over FY12-FY14e, driven
by improving realizations and attractive valuations of 6.6x FY13e EV/EBITA, and a ~30%
discount to large cap peers makes us confident of continued outperformance from the
stock despite a 37% rise in the stock price over the past three months. (Harshad Katkar,
16 October, 2012)


Page 8                                                                                     Deutsche Bank AG/Hong Kong
17 October 2012
The Investigator


Summary

Global
High policy uncertainty, and the attendant flight from junior tranches of the capital
structure, along with a dismal prior decade of equity returns keeps them “cheap”.
Reduced policy uncertainty and losses from bond portfolios are likely to be required as
catalysts to unlock value in equities. Despite all the despair about global growth, our
own mother of all leading indicators (MOMLI) is looking up, as are asset-price-based
opinions on global growth. Meanwhile, analysts have lost confidence and are looking
for just 5% EPS growth globally in 2012, and 12% for 2013. Global Risk-Love
(sentiment) has now entered euphoria, a slight concern. The global Tape is very strong,
and the Marshallian K is rising.

Asia
Asian valuations are moderately below historical averages. The problem is margins – in
China they seem to be in a secular decline, while in India they seem to be at a cyclical
low. The region cannot rely on asset turns and leverage – both at global levels – to
boost relative ROEs compared with the world. It is probably going to have to be EBIT
margin expansion that gets the PB up. We don’t see any substantial decline in the cost
of equity to boost PB multiples. Risk-love in Asia is at neutral. Technicals are improving
– new highs are rising, and new lows have almost vanished. Asia’s leading economic
indicators are bottoming, and policy is no longer being tightened. Analysts have taken
the knife to this year’s EPS growth forecasts from around 13% at the start of the year to
5% now. We think that EPS revisions and economic surprises are about bottoming now.
New issuance and secondaries have been paltry – a good positive contrarian indicator.
Foreign fund flows have resumed in earnest as markets have rallied. Value strategies
and high profitability have done well this year, while high projected growth stocks have
been punished.

Japan
Japanese stocks continue to look undervalued versus history. A return to credible
inflation and higher nominal GDP growth globally is required to unlock value. Recent
tensions with China are unhelpful for risk assets in Japan. Sentiment is at neutral levels.
Technicals are mixed. Economic surprises are nasty and mean-reverting. They are
probably going to get less bad. EPS revisions continue to slide. Fund flows are weak
and the market continues to underperform the world as US 10-year bond yields remain
suppressed. Value remains the long-term winner.

China (neutral)
China’s valuations look “cheap” compared with history and are at fair value on our PB
ROE less COE model. However, on prospective ROEs of around 7% in three years’ time
and COE of around 10%, the current PB of 1.4 is substantially overvalued. Monetary
reflation could lift the current multiple, but the long-term deterioration in EBIT margins
is the key challenge to a re-rating. Sentiment is at neutral. Worryingly, turnover/market
cap is plumbing new depths. Once the political transition is done, and policy making,
reflation and market-supportive steps are likely taken, sentiment and pathetic turnover
might perk up. Technicals are weak. Policy is tightening via the currency, and weak
monetary growth. Real interest rates for corporates are rising with the corporate price
deflator contracting yoy. EPS revisions keep dropping as do EPS growth forecasts for
2012 and 2013. We are watching carefully for EPS revisions to hook up. The good news
is that the credit multiplier is rising yoy, and the market is responsive to this indicator.
The bad news is that the gap between M1 and M2 growth is still weak and correlates
with the PB multiple. We need to see a more credible reflation to see the market make


Deutsche Bank AG/Hong Kong                                                                     Page 9
17 October 2012
The Investigator


strong upward moves. Earnings revisions and momentum, together with analyst
opinions are being rewarded this year, while value investing has been patchy.

Hong Kong (neutral)
Hong Kong equities are at fair value compared with history, and about in the middle of
the pack compared with the other Asian markets. Sentiment has rebounded from the
panic levels earlier this year. Turnover to market capitalization is still anemic, but we are
encouraged by the rise in the gap between M1 and M2 growth. Technicals have
improved since the summer. Policy seems to be tightening (even as real interest rates
are quite negative), and EPS revisions are still quite weak. The EPS growth forecast for
2012 has collapsed – the sign changed from an expected +12% earlier this year to -12%
growth expected now! For next year, EPS growth is expected at 10%. Inflation is
making the real effective exchange rate less competitive, and the yield curve is flat. A
good dose of monetary reflation in China is required to turn liquidity up. Negative real
interest rates are here to stay in HK for longer than anyone recognizes. Value and low
risk styles have been exceptional performers this year.

India (overweight)
Despite the recent run-up, the market is still undervalued on EV/Sales, EV/EBITDA and
PB compared with history. On other metrics, like trailing PE and dividend yield, it is at
long-term averages. On our PB versus ROE less COE model it is at fair value, and needs
for ROEs to rise and/or COEs to fall – likely if the RBI cuts rates as the Rupee
strengthens. Risk-love has perked up from panic in May to neutral now. Meeting with
scores of clients around the world, however, we think there is still considerable
skepticism about the market. With the recent rally, technicals have improved. The
downgrade to GDP growth by the IMF is unfathomable to us simpletons. The leading
indicator from the OECD has been rising for months, and the EPS revisions trajectory
has also been improving for months. Our policy indicator has curled up with the
weakness in the Rupee. Looking ahead, we expect the monetary base to start growing
from its paltry 4% yoy rate, as net foreign asset growth resumes on the back of reforms
and confidence. EPS growth projections for next year, at 12-14%, are reasonable. The
monetary base growth at 4.4% is anemic. The lack of net foreign asset growth is being
compensated by a substantial increase in net RBI lending to government. This is a
vicious cycle that needs to be broken, and probably will be, if reform momentum is
maintained. The yield curve is no longer negative, but is still flat as a chapatti. Value and
EPS momentum have been rewarded well this year. Stick with them.

Indonesia (neutral)
Valuations are at fair levels compared with history. We are a bit concerned about the
decline in Indonesia’s EBIT margins. Maintaining premium valuations to the region
requires maintaining premium ROEs to the region. Having almost doubled capex/GDP in
the past few years, and as it is exposed to any slowdown in nominal GDP growth in
China, keep an eye on declining margins in Indonesia. Indonesia has gone from the
poster child of solid macro policy last year to one that is perceived as having less than
optimal policies – interest rates cut “too soon”, etc. We didn’t understand either
position. Indeed, it seems that other EM central banks are now following BI in cutting
interest rates to combat slower growth. Maybe BI is a lot smarter than the gallery of
critics assumes. We think policy easing makes sense (unlike consensus) – real economy
data is coming in really weak, EPS revisions are negative (but recovering), and EPS
growth expectations have collapsed from 17% a few months ago to just 8% now for
calendar 2012. Inflation, a lagging indicator, is stable at the 4%-ish level. The currency is
more competitive in real effective terms, free liquidity is booming and the yield curve is
flat-ish. Value and EPS mo are king here. The rest are not really adding alpha this year.


Page 10                                                                                         Deutsche Bank AG/Hong Kong
17 October 2012
The Investigator


Korea (underweight)
The market is at fair value compared with its history, but cheap compared with other
markets on a snapshot basis. This is a low ROE, low EBIT margin market, and is likely to
remain a low PB market unless ROEs rise sharply. Interestingly, unlike China, Taiwan
and Singapore, where margins have been in secular decline, and ROEs have been
goosed by rising asset turns and leverage (this has also been happening in Malaysia and
Indonesia recently), in Korea this is not happening. EBIT margins and ROEs move
together – albeit at low levels. We think this deserves a higher multiple than currently
obtained. We think investors in the other markets might be suffering from “ROE
illusion”, implying very strong nominal GDP growth and more leverage – both unlikely.
Sentiment is just shy of neutral. Technicals are a lot stronger than overall market
performance suggests. Close to a record percentage of stocks are making 52-week
highs. The leading economic indicator has been rising persistently for many months
now, but EPS revisions are still in the doldrums. Implication: margins are under
continued pressure. The terms of trade are improving and we expect this to feed
through to improving margins and EPS revisions soon. The yield curve is flat, and
flattening. Value has made a massive comeback in the past six months. Price and EPS
mo have been disasters this year. Stock-picking in Korea based on style is very tricky
because the factors go in and out of style with a head-spinning intensity.

Malaysia (neutral)
Malaysian equities are undervalued versus history but quite expensive versus the other
markets on a relative basis. As in Indonesia, we are concerned about the sharp drop in
EBIT margins, even as ROEs remain stable. Risk-Love is quite high, just shy of euphoria.
Technicals are neutral. The EPS revisions index has collapsed and EPS growth numbers
are being taken down for 2012. Price and EPS mo, along with ROE have been rewarded
this year. But value has been tepid.

Philippines (neutral)
The market is expensive compared with its history and versus other markets in the
region. We like that the EBITs and ROEs move together, so there is no leverage or asset
turnover-driven “ROE illusion”. Also, years of under-investment imply many years of
strong EBIT margins (unlike say in China, or maybe even Indonesia). Sentiment has
come off from the euphoria of the summer to neutral now. The leading economic
indicator is rising, and we expect EPS revisions to do the same. This is a requirement in
order to maintain its premium valuations. Value, a perennial king in Philippine alpha
generation, continues to do well, as do EPS revision strategies.

Singapore (neutral)
The market is cheap compared with history, but fairly valued compared with other
regional markets. EBIT margins are in secular decline, and maintaining ROEs will rely on
continued improvements in asset turnover and leverage. Sentiment is in mild euphoria.
Technicals are super-strong, with close to a record percentage of stocks making 52-
week highs. EPS growth projections for both 2012 and 2013 remain lackluster. Earnings
revisions also look weak. The good news is that the terms of trade are now picking up
nicely, so margins are likely to get a boost. Only stability and low risk factors are
generating alpha. Value strategies are mixed, but momentum strategies have destroyed
alpha this year.

Taiwan (underweight)
The market is a serial underperformer versus the region. EBIT margins are in secular
decline, and the high asset turnover is running into gravity now. Risk-love is in the tank.
EPS revisions are worsening, but there is hope. The terms of trade have gone vertical
and project rising EPS momentum. Given poor sentiment, and an impending
improvement in EPS growth projections, we need to keep an eye on the underweighted

Deutsche Bank AG/Hong Kong                                                                    Page 11
17 October 2012
The Investigator


market. This tech-heavy market is respecting price momentum and stocks supported by
analysts.

Thailand (overweight)
The market is fairly valued versus history and the region. The exception is PB – where
the market is at record premiums to the region. Could that be a reward for the solid
ROEs (driven not by EBIT margins but asset turns)? Sentiment is neutral. Technicals are
super-strong. About a quarter are making 52-week highs. Growth-leading indicators are
still strong, even as incoming data have been weak. Analysts have dropped projected
2012 EPS growth forecasts from 23% earlier his year to about 15% now. Also, we are
comforted with the rise in the terms of trade that should be supportive of margins and
EPS growth going forward. Value has been a disaster this year, while price and EPS
momentum strategies have been huge winners.


Page 12                                                                                   Deutsche Bank AG/Hong Kong
17 October 2012
The Investigator


Figure 7: Model portfolio performance since inception (13 September 2010)
                  22 Model portfolio absolute returns (After T/C): 19.0% 1-week relative returns 0.1%                                                                                                     22
                  20 MSCI Asia ex Japan absolute returns: 4.8%           1-month relative returns 2.5%                                                                                                    20
                  18 Model portfolio relative returns (After T/C): 14.2% YTD relative returns 9.8%                                                                                                        18
                  16                                                      12-month relative returns 12.1%                                                                                                 16
                  14      After Transaction Cost                                                                                                                                                          14
                  12                                                                                                                                                                                      12
                  10                                                                                                                                                                                      10
                   8                                                                                                                                                                                      8
                   6                                                                                                                                                                                      6
                   4                                                                                                                                                                                      4
                   2                                                                                                                                                                                      2
                   0                                                                                                                                                                                      0
                  -2                                                                                                                                                                                      -2
                    9/10 11/10 1/11 3/11 5/11 7/11 9/11 11/11 1/12 3/12 5/12 7/12 9/12
Source: Deutsche Bank, MSCI, FactSet
Note: Performance is measured in local currency. Stock changes are effective as of close one day after they are officially published (i.e. Changes published on 4th May 2011 will be effective as of close 5th May 2011).
*New additions. Assume 50bps on both buying and selling as proxy for transaction cost. Note: Past performance does not guarantee future results


Figure 8: Model portfolio country and sector overweights/underweights
                                   -12% -9% -6% -3% 0%                      3%     6%      9% 12%                    Sector (MSCI Wgt)               -12% -9% -6% -3% 0%                      3%      6%      9% 12%
  Country (MSCI Wgt)
                                                                                                                                 Retailing (1.5%)
           THAILAND (3.0%)
                                                                                                                                Materials (7.0%)
                                                                                                                                   Energy (7.2%)
                  INDIA (9.5%)                                                                                                   Telecom (6.7%)
                                                                                                                                Cons Svc (1.7%)
                                                                                                                          Div Financials (2.4%)
          INDONESIA (3.7%)
                                                                                                                                 Cap Gds (7.6%)
                                                                                                                     Health Care Equip (0.3%)
        PHILIPPINES (1.2%)                                                                                                          Media (0.3%)
                                                                                                                              Real Estate (7.0%)

               CHINA (23.9%)                                                                                                  Comm Svc (0.0%)
                                                                                                                        Pharma/Biotech (0.7%)
                                       Underweight               Neutral       Overweight                                                                                                      Overweight
                                                                                                                                Software (3.2%)               Underweight
         SINGAPORE (7.3%)
                                                                                                                          Cons Dur/App (0.8%)
                                                                                                                   Food/Staples Retail (0.8%)
           MALAYSIA (4.9%)                                                                                             Food Beverages (3.6%)
                                                                                                                        Hhold Products (1.2%)
                                                                                                                                   Utilities (3.9%)
      HONG KONG (11.9%)
                                                                                                                                Insurance (4.3%)
                                                                                                                                Transport (1.9%)
             TAIWAN (14.4%)                                                       Current O/U wgt                       Tech Hardware (4.5%)                                                    Current O/U wgt
                                                                                  (17 October 2012)                                                                                             (17 October 2012)
                                                                                                                                     Autos (5.0%)
                                                                                  Previous O/U wgt                                                                                              Previous O/U wgt
                                                                                                                                   Semis (10.1%)
    SOUTH KOREA (20.1%)                                                           (07 August 2012)                                                                                              (07 August 2012)
                                                                                                                                   Banks (18.1%)

                                   -12% -9% -6% -3% 0%                      3%     6%      9% 12%                                                    -12% -9% -6% -3% 0%                      3%      6%      9% 12%

Source: Deutsche Bank, MSCI.
Note: Numbers in parenthesis are sector and country weights in MSCI AC Asia ex Japan index. The model portfolio is equal weighted; each stock has weighting of 2.5%.


Deutsche Bank AG/Hong Kong                                                                                                                                                                                       Page 13
17 October 2012
The Investigator


Figure 9: Asia Model Portfolio


                                                                                                                                                                                           Profitability
                                                                                                                                                                      FY 13


                                                                                                                                                                                                                                                    Cons Rec
                                                                                                                                                                               Valuation


                                                                                                                                                                                                           Price Mo
                                                                                                                                                                                                           Earnings


                                                                                                                                                                                                                                         Earnings
                                                                                                                                                                                                                      Stability


                                                                                                                                                                                                                                         Growth

                                                                                                                                                                                                                                                    Quality
                                                                          DB      Date          Close    YTD Rtn      Hldg Per                 Mcap 20D ADT         PE (DB


                                                                                                                                                                                                                                  Risk
                                                                                                                                                                                                                      Mo
                                                     BB Ticker     Mkt Rec       Added       16Oct12          (%)      Rtn (%)      Beta      (U$bn)      (U$ m)        est)
Energy - MSCI wgt: 7.2%, portfolio wgt: 12.5%
CNOOC Ltd.                                           883 HK        CN      H    11Dec10         15.94         20.5         -6.7        1.40     91.8       111.5         8.9 o                 + ++                   o     o ++ o                  o    o
Oil & Natural Gas Corp. Ltd.                         ONGC IN       IN      B    14Sep10       278.95          12.4        -14.7        0.65     45.2        20.3         8.7 ++ ++ +                                  o     o ++ o                  o    o
Oil India Ltd.                                       OINL IN       IN      B    30Sep11       485.85           5.9         -6.2        0.29       5.5         1.7        9.1 ++ +                           +         o     + ++ o                  o    o
PTT PCL                                              PTT TB        TH     NR    14Sep10       311.00           1.6                     1.27     29.0        38.7
SK Innovation Co. Ltd.                               096770 KS KR          B     7Aug12       154000           8.5         -6.9        1.47     13.5        55.8         6.6 ++ ++ +                                  o     - - ++ - -              o    o
Materials - MSCI wgt: 7.0%, portfolio wgt: 12.5%
Grasim Industries Ltd.                               GRASIM IN IN          B    27Jun12      3464.85          39.0         36.1        0.75       6.0         6.0      11.0 +                  + ++ ++ ++ o                               o         +    o
Shree Cement Ltd.                                    SRCM IN       IN      B    17Oct12      4048.80          87.7          NA         0.70       2.7         6.3      17.7 -               ++ ++ ++                        o       -     --        o   ++
Indocement Tunggal Prakarsa                          INTP IJ       ID      B    14Sep10        21450          27.5         19.6        1.34       8.2         5.5      15.9 -               ++ ++ ++ ++ ++ o                                        o    o
Korea Zinc Co. Ltd.                                  010130 KS KR          B    17Oct12       461000          51.6          NA         1.13       7.9       31.9         8.2 o ++ ++ ++                                     -      +      o         +    o
LG Chem Ltd.                                         051910 KS KR          B    14Sep10       316500          -0.3         -5.3        1.53     19.3        73.6       11.9 o ++ +                                    o     o ++ o                  o    --
Capital Goods - MSCI wgt: 7.6%, portfolio wgt: 10.0%
China Communications Construction Co. Ltd. 1800 HK                 CN      B    5May11           6.94         18.0          5.5        1.41     12.1        19.3         7.0 +                 +            o     ++        o      o      o         o   ++
Sino-Thai Engineering & Construction PCL             STEC TB       TH      B     7Aug12         20.70         72.8         36.2        0.82       0.8         3.9      19.3 o                  + ++ ++                      o ++ o                  o   ++
SembCorp Industries Ltd.                             SCI SP        SG      B    14Sep10          5.47         39.3         30.0        1.36       8.0         9.3      11.4 o ++ o                                ++        o      +      o         o    +
SembCorp Marine Ltd.                                 SMM SP        SG      B    11Dec10          4.92         35.3          8.0        1.66       8.4       14.5       13.2 o ++ o                                    +     o ++ - -                o    +
Commercial Services & Supplies - MSCI wgt: 0.0%, portfolio wgt: 0.0%
Transportation - MSCI wgt: 1.9%, portfolio wgt: 0.0%
Automobiles & Components - MSCI wgt: 5.0%, portfolio wgt: 0.0%
Consumer Durables & Apparel - MSCI wgt: 0.8%, portfolio wgt: 0.0%
Consumer Services - MSCI wgt: 1.7%, portfolio wgt: 5.0%
SJM Holdings Ltd.                                    880 HK        HK      B     9Mar12         16.30         34.5         10.1        1.34     11.7          9.7      12.7 + ++ ++ ++                                      o ++ ++                 o
Minor International PCL                              MINT TB       TH      B    27Jun12         17.80         76.2         26.2        1.06       2.1         6.5      20.4 o ++ ++ ++                                      o      - - ++           o
Media - MSCI wgt: 0.3%, portfolio wgt: 2.5%
BEC World PCL                                        BEC TB        TH      H    11Nov11         57.25         31.7         59.1        0.73       3.7         3.4      20.8 -               ++ ++                     o     o ++ o                  o    --
Retailing - MSCI wgt: 1.5%, portfolio wgt: 7.5%
Belle International Holdings Ltd.                    1880 HK       CN      B    5May11          13.62          2.0         -6.9        0.93     14.8        25.5       15.7 -               ++ ++ ++                        o ++ ++                      o
Giordano International Ltd.                          709 HK        HK      H    14Sep10          6.40         20.4         61.0        0.88       1.3         2.5      12.3 + ++ +                                    +     o ++ ++                     ++
Ace Hardware Indonesia                               ACES IJ       ID      B    17Oct12      6650.00          62.8          NA         0.41       1.2         0.6      23.7 - -                + ++ ++                      o      + ++                  o
Food & Staples Retailing - MSCI wgt: 0.8%, portfolio wgt: 0.0%
Food Beverage & Tobacco - MSCI wgt: 3.6%, portfolio wgt: 2.5%
Uni-President Enterprises Corp.                      1216 TT       TW      B     7Aug12         52.00         28.0          4.7        0.63       8.7       14.3       19.9 -                  + ++ ++                              -     +         o    o
Household & Personal Products - MSCI wgt: 1.2%, portfolio wgt: 0.0%
Health Care Equipment & Services - MSCI wgt: 0.3%, portfolio wgt: 2.5%
Top Glove Corp. Bhd                                  TOPG MK MY            B    17Oct12          5.31          8.8          NA         0.99       1.1         2.2      14.1 ++ o                            +     ++        o ++ - -                o    o
Pharmaceuticals & Biotechnology - MSCI wgt: 0.7%, portfolio wgt: 0.0%
Banks - MSCI wgt: 18.1%, portfolio wgt: 7.5%
ICICI Bank Ltd.                                      ICICIBC IN IN         B     7Aug12      1042.05          54.6          7.0        1.44     22.7        78.4       12.7 - -                 o           o         o     o      --     o         o   ++
BOC Hong Kong (Holdings) Ltd.                        2388 HK       HK      B    5May11          24.10         37.0          9.3        1.02     32.9        32.2       11.7 ++ o                            o         +     o      o      o         o    +
Industrial & Commercial Bank of China Ltd.           1398 HK       CN      B    5May11           4.88         11.2        -16.7        1.41    214.7       165.4         6.2 ++ ++ o                              --        o      o      o         o   ++
Diversified Financials - MSCI wgt: 2.4%, portfolio wgt: 5.0%
IDFC Ltd.                                            IDFC IN       IN      B    15May12       149.90          65.9         30.7        1.58       4.3       24.5       10.2 -               ++ o                      o    ++             o              o
Haitong Securities Co. Ltd-H share                   6837 HK       CN      B    27Jun12         10.70          NA          -0.2         NA      14.5          7.0      15.0 +                  +            +         +     o             o             ++
Insurance - MSCI wgt: 4.3%, portfolio wgt: 2.5%
Dongbu Insurance Co. Ltd.                            005830 KS KR         NR     9Mar12        49550          -5.0          5.7        0.53       3.2         5.5        NA + ++                                      o     o             -              o
Real Estate - MSCI wgt: 7.0%, portfolio wgt: 7.5%
Sun Hung Kai Properties Ltd.                         16 HK         HK      B    11Dec10       109.00          12.9        -12.7        1.08     36.8        82.2       13.1 +                   o ++                  o     o      o      o         o    --
Keppel Land Ltd.                                     KPLD SP       SG      B    15May12          3.47         65.3         18.0        1.69       4.4         5.3      13.3 + ++ ++                                   -     -       -    ++     --       o
Megaworld Corp.                                      MEG PM        PH      B     7Aug12          2.40         43.1          7.1        1.28       1.5         4.4        9.1 ++ o ++                                  o     +      o      o         o    o
Software & Services - MSCI wgt: 3.2%, portfolio wgt: 2.5%
SouFun Holdings Ltd. ADS                             SFUN US       CN      B    30Aug11         17.71         28.0         10.5        1.64       1.4         3.8        8.0 ++ ++ ++ ++                                    -- --         +         o    o
Technology Hardware & Equipment - MSCI wgt: 4.5%, portfolio wgt: 0.0%
Semiconductors & Semiconductor Equipment - MSCI wgt: 10.1%, portfolio wgt: 5.0%
Samsung Electronics Co. Ltd.                         005930 KS KR          B     7Aug12     1330000           25.8          2.8        1.14    178.8       337.8         8.6 + ++ o                                   o     +      +      o         o   ++
Novatek Microelectronics Corp.                       3034 TT       TW      B    28Jan11       104.50          43.7         18.9        1.23       2.2       18.6       12.6 o ++ o                                    o    ++ +           o         o   ++
Telecommunication Services - MSCI wgt: 6.7%, portfolio wgt: 10.0%
China Mobile Ltd.                                    941 HK        CN      H    14Sep10         83.70         14.7         15.9        0.46    217.0       196.8       10.8 ++ ++ +                               --        + ++ o                  o    o
China Communications Services Corp. Ltd.             552 HK        CN      B    30Sep11          4.39         32.6         28.9        0.63       3.9         2.7        9.2 ++ o ++ ++ ++ ++ o                                                 --      ++
Far EasTone Telecommunications Co. Ltd.              4904 TT       TW      B    30Sep11         72.40         32.5         65.7        0.12       8.1       13.9       17.4 -                  + ++ ++                      - - ++ o                o   ++
Telekom Malaysia Bhd                                 T MK          MY      H    15May12          6.23         35.6         23.6        0.76       7.3       16.6       26.3 o                   o ++ ++ ++ -                              --        o    o
Utilities - MSCI wgt: 3.9%, portfolio wgt: 2.5%
Guangdong Investment Ltd.                            270 HK        CN      B    30Sep11          6.20         35.5         32.4        0.38       5.0         4.5      12.6 o                   o           o         o     o      o                o
Db X-Trackers Csi300 Trn Index Et                    3049 HK       CN           15May12          5.62         -7.2        -11.1        1.00       0.3         3.7
Asia Model Portfolio (eq-wgt)**                                                                               23.1         19.0        1.03     26.6        36.7       13.1
MSCI Asia ex-Japan, LC                                                                                        13.3          4.8
Source: Deutsche Bank, FactSet, Bloomberg Finance LP. Note: Stocks are sorted by names in alphabetical order within each sector. Factor scores are given on a country and sector relative basis. Very Favorable (++),
Favorable (+), Neutral (0), Unfavorable (-), Very Unfavorable (--), Not Applicable (Blank). For a detailed explanation please see appendix A. Performance is measured in local currency. Stock changes are effective as of close
one day after they are officially published (i.e. Changes published on 4th May 2011 will be effective as of close 5th May 2011). *New additions. **Assume 50bps on both buying and selling as proxy for transaction cost.


Page 14                                                                                                                                                                        Deutsche Bank AG/Hong Kong
17 October 2012
The Investigator


Country selection

Figure 10: Equity markets and their key drivers


                                                                                                                                     Current Account Balance/GDP
                                                                                       Sentiment (Risk-Love)


                                                                                                                                                                   Real Exchange Rate


                                                                                                                                                                                                 Total Score
                                                                                                               Technicals
                                                                         Valuation
                                                             Liquidity


                                                                                                                            Growth


                                                                                                                                                                                        Policy
                         China (Latest)                                                                                                                                                              8
                         China (Last)                                                                                                                                                                -2
                         Hong Kong (Latest)                                                                                                                                                          -2
                         Hong Kong (Last)                                                                                                                                                            -2
                         Indonesia (Latest)                                                                                                                                                          1
                         Indonesia (Last)                                                                                                                                                            0
                         India (Latest)                                                                                                                                                              4
                         India (Last)                                                                                                                                                                3
                         Korea (Latest)                                                                                                                                                              6
                         Korea (Last)                                                                                                                                                                -3
                         Malaysia (Latest)                                                                                                                                                           2
                         Malaysia (Last)                                                                                                                                                             3
                         Philippines (Latest)                                                                                                                                                        5
                         Philippines (Last)                                                                                                                                                          0
                         Singapore (Latest)                                                                                                                                                          -2
                         Singapore (Last)                                                                                                                                                            4
                         Thailand (Latest)                                                                                                                                                           4
                         Thailand (Last)                                                                                                                                                             6
                         Taiwan (Latest)                                                                                                                                                             1
                         Taiwan (Last)                                                                                                                                                               0
                         Asia ex-Japan (Latest                                                                                                                                                       4
                         Asia ex-Japan (Last)                                                                                                                                                        -2
                         Japan (Latest)                                                                                                                                                              2
                         Japan (Last)                                                                                                                                                                -4
Source: Deutsche Bank.
Blank cell represents factor not used in the model for that country.
     Most Favorable,       Favorable, O Neutral,     Less Favorable and              Least Favorable.


Liquidity is based on yoy change in M2/Market Cap ratio, valuation is based on composite valuation index (based on trailing P/E, 12m fwd P/E, P/cash earnings,
P/book, dividend yield, EV/EBIDTA and EV/Sales), sentiment is based on Risk-Love indicator, technicals are based on several price based indicators like percentage
of stocks above 200-d moving average, number of 52-Weeks new lows and new highs, indices above/below their 200-d moving average etc., growth is based on
leading economic indicators and earnings revision index, current account balance/GDP is based on deviation from 3-year moving average trend, real exchange rate
is based on deviation from 2-year moving average trend and policy is based on policy indicator.


Deutsche Bank AG/Hong Kong                                                                                                                                                                                     Page 15
17 October 2012
The Investigator


Country-sector selection

Figure 11: We prefer sectors with value, high earnings and price momentum, and better profitability

                                                                              0.90
                                                                   JP Banks
                                        HK Real Estate
                                              JP Telecom                      0.80
                                                                                 KO Autos
                                                   ID Hhold Products          0.70
                                                                                             TH Banks
                            ID Banks                                                                                                                                        Most preferred sectors
                                                                                                      CH Banks
                                                     TH Food Bev              0.60                   TH Telecom
                                                                                                JP Energy
                                                               IN Software
                                                                           0.50
         High earnings revisions &                          IN Hhold Products
                                                                                             JP HCare Equip/Svc
         price momentum, better                     MY Utilities      MY Telecom                                        CH Real Estate
                                                                           0.40              KO Insurance
         profitability                                                                                 KO Tech Hard/Equip

                                               IN Div Fin                                                                                                         SG Banks
                                                                                                      CH Utilities
                                                                              0.30                JP Autos                       TA Banks           PH Real Estate
                                                                                          TH Energy       SG Real Estate                     SG Retailing
                                                                                                    JP Transport              ID Utilities                 JP Div Fin
                                     ID Autos                   HK Telecom JP Food Bev                                                                                    KO Utilities                JP Fd/Staples Retail
                                                                         0.20                              ID Pharma/ Biotech         JP Comm Svc
                                               IN Energy                                                     HK Utilities
                                                                     PH Div Fin        PH Cap Gds
                                   MY Energy         JP Pharma/ Biotech                            HK Banks Software
                                                                                                            JP
                      HK Cons Svc                                                                                                                                     IN Banks
                                                        ID Food Bev 0.10                                          TH Media
                                                                    IN Pharma/ Biotech JP Materials                                                       MY Banks
                               MY Food Bev ID Telecom                                   HK Cap Gds
                                                            CH Telecom Materials
                                                                        ID
                                                                                      CH Software TA Real Estate
                                                 CH Transport SG Media Materials IN Autos                                                JP Real Estate
                                      TH Materials
                                                                       KO
                                                            TA Div Fin 0.00                     TA Telecom JP Cap Gds
                                                         CH Cap GdsJP Insurance           TA Cons Durables            SG Div Fin
                                               KO Retailing          KO Cap Gds Transport JP Tech Hard/Equip
                                                                              HK
                                                                                                                                                           KO Cons Svc
                                                                         KO Telecom      KO Energy JP Hhold Products                     KO Food Bev                                     JP Retailing          JP Media
                                  KO Hhold Products                                                              IN Materials
                                                         SG Food Bev -0.10                       MY Autos
                                                                                   CH Tech Hard/Equip
                                              CH HCare Equip/Svc                                     HK Semis
                                                                        KO Transport CH Energy
                                                        TA Materials -0.20                                                TA Semis                                                         PH Fd/Staples Retail
                                                                         HK Tech Hard/Equip JP Semis                                        SG Cap Gds
                                        TA Retailing                                           TA Cap Gds                  TA Insurance
                                                                                         HK Retailing     CH Autos
                                                  KO Fd/Staples Retail -0.30 IN Food Bev                              MY Materials
                                                                            HK Cons Durables
                                                                         SG Cons Svc SG Fd/Staples Retail
                                                                                                         CH Materials                        KO Cons Durables                       Cheaper
                                                                  JP Cons Svc                                    TA Tech Hard/Equip
                                                                        MY Cons Svc             ID Energy    MY Transport        MY Cap Gds        PH Telecom
                                                    CH Retailing        -0.40
                                                              CH Insurance                                            MY Div Fin SG Telecom
                                                TA Fd/Staples Retail                    CH Food Bev         IN Cap Gds      IN Utilities
                                                              IN Telecom IN Real Estate TA Transport
  Least preferred sectors                                                  IN Media HK Div Fin         KO Pharma/ Biotech KO Div Fin Cap Gds
                                                                                                                                          ID
                                                                        -0.50
                                                              TA Autos                                 KO Semis SG Transport

                                                CH Fd/Staples Retail                      KO Software
                                                                              -0.60                                        JP Utilities


                                                                              -0.70
 -0.40              -0.30              -0.20                -0.10                  0.00                 0.10           0.20               0.30             0.40               0.50               0.60                0.70
Source: Deutsche Bank, FactSet


Page 16                                                                                                                                                               Deutsche Bank AG/Hong Kong
17 October 2012
The Investigator


Figure 12: Our most-preferred 20 country-sectors; most-preferred have cheaper valuations, better EPS momentum,
higher ROE and better technicals (all metrics refer to MEDIAN data)


                                                                                                                                              Earnings
                                                                                                         Valuation                         Revisions                        Profitability Technicals


                                                                                                                                                                                                                          Earnings Revisions
                                                                                                                                    FY1 EPS Revisions


                                                                                                                                                        FY2 EPS Revisions
                                                                                       (U$ bn)


                                                                                                            12m fwd P/E


                                                                                                                                                                                                                                               Profitability


                                                                                                                                                                                                                                                               Technicals
                                                                                                                                                                                                              Valuation
                                                                                                                                                                                ROE (%)
                                                                                       Mkt Cap


                                                                                                                          EV/EBIT
                                                                                                   P/B


                                                                                                                                                                                                 RSI
      Country                                  Sector
1     Philippines Utilities                                                               3,637      2.9    11.6          11.7        1.0                1.0                          22.5         1.10          O          ++                  ++              ++
2     Thailand       Telecommunication Services                                           5,930      4.9    16.6          18.6        0.9                0.5                          21.4         1.22          --         ++                  ++              ++
3     Thailand       Banks                                                             32,450        1.7    10.6                      0.6                0.5                          12.4         1.11          O          ++                     O            ++
4     Indonesia      Banks                                                             31,482        2.0        9.7                   0.7                0.5                          18.8         1.01          +          ++                      +             O
5     Thailand       Food & Staples Retailing                                             5,559    12.2     25.5          22.4        0.6                0.8                          38.7         1.13          --         ++                  ++              ++
6     India          Software & Services                                               37,853        3.2    12.7          11.0        0.6                0.6                          21.7         1.10            -        ++                  ++              ++
7     China          Utilities                                                         17,175        1.2        9.5       18.1        0.5                0.6                              5.6      1.10          +          ++                     --           ++
8     China          Real estate                                                       34,144        0.9        5.7         5.9       0.0               -0.2                          14.4         1.06        ++               +                   +              +
9     Hong Kong Real estate                                                          112,266         0.6    12.6            7.2       0.3                0.2                              8.8      1.06        ++           ++                        -            +
10 Malaysia          Utilities                                                         13,877        1.3    12.7          12.5        0.4                0.4                              9.9      1.10          O          ++                     O            ++
11 India             Banks                                                             60,156        0.8        5.2                 -0.4                -0.4                          18.3         0.97        ++              O                    +               -
12 Korea             Insurance                                                         17,335        1.4        6.5                 -0.2                -0.1                          15.1         0.99        ++               +                   +               -
13 Korea             Banks                                                             43,648        0.6        5.8                 -0.7                -0.7                          12.8         0.96        ++                  -               O                -
14 Singapore Retailing                                                                    4,270      3.2    11.6            8.8       0.1               0.1                           24.8         1.09          O          ++                  ++              ++
15 Korea             Automobiles & Components                                          76,862        1.2        6.4         6.6     -0.2                -0.2                          16.5         0.98        ++              O                    +               -
16 Singapore Banks                                                                     60,279        1.4    11.4                      0.2               -0.2                          11.3         1.07          +              +                  O               +
17 India             Household & Personal Products                                     11,909      11.6     27.0          29.1        0.4                0.3                          35.0         1.14          --         ++                  ++              ++
18 India             Diversified Financials                                            11,120        1.7    10.9                    -0.1                 0.0                          18.6         1.07          +              +                   +              +
19 Malaysia          Telecommunication Services                                        18,375        2.9    22.2          18.1        0.2                0.0                          20.8         1.14          --             +               ++              ++
20 Korea             Technology Hardware & Equipment                                   15,766        1.4    10.0          13.0        0.1               -0.1                          10.8         1.04          O              +                  O               +

                     Median                                                             17,855        1.6    11.2          12.5 0.29                          0.16                        17.4         1.08
                     Average                                                            30,705        2.9    12.2          14.1 0.25                          0.19                        17.9         1.07


Source: Deutsche Bank, DataStream. FactSet. EPS revisions is calculated for each stock as the number of analysts revising up the FY1 EPS estimate less number of analysts revising
down the FY1 EPS estimate divided by total number of changes in the past three months. We then take the median of these EPS revisions scores for all individual stocks in the country-
sector. RSI is the ratio of 65-day to 260-day moving average in stock price. All the metrics shown above except market cap are median data for the sector.


Changes: Removed Thailand energy, Hong Kong telecommunications and utilities and Singapore capital goods and have added India Household & Personal Products, Malaysia telecommunications, Indonesia banks and
Korea tech hardware.


Deutsche Bank AG/Hong Kong                                                                                                                                                                                                                                 Page 17
17 October 2012
The Investigator


Figure 13: Our least-preferred 20 country-sectors; least-preferred have expensive valuations, poor EPS momentum,
higher ROE and bad technicals (all metrics refer to MEDIAN data)

                                                                                                                                                       Earnings
                                                                                                                 Valuation                          Revisions                        Profitability Technicals


                                                                                                                                                                                                                                   Earnings Revisions
                                                                                                                                             FY1 EPS Revisions


                                                                                                                                                                 FY2 EPS Revisions
                                                                                              (U$ bn)


                                                                                                                     12m fwd P/E


                                                                                                                                                                                                                                                        Profitability


                                                                                                                                                                                                                                                                        Technicals
                                                                                                                                                                                                                       Valuation
                                                                                                                                                                                         ROE (%)
                                                                                              Mkt Cap


                                                                                                                                   EV/EBIT
                                                                                                           P/B


                                                                                                                                                                                                          RSI
       Country                                     Sector
1      China           Household & Personal Products                                             6,925       2.4     39.2          (4.8) -1.0                    -1.0                         (22.3)        0.88          --            --                  --             --
2      China           Food & Staples Retailing                                                  7,180       2.3     12.1          13.3      -1.0                -1.0                          18.1         0.86            -           --                   +             --
3      Singapore Hotels Restaurants & Leisure                                                    6,535       0.9     19.6          21.9      -0.9                -1.0                              6.6      1.01            -           --                     -           O
4      Korea           Software & Services                                                    15,154         2.7     12.9          17.6      -0.9                -0.4                          11.4         0.89          --                -               O              --
5      Taiwan          Materials                                                              50,916         1.4     14.2          16.2      -1.0                -1.0                              7.1      1.00          O             --                     -             -
6      China           Retailing                                                              15,723         1.4     12.6            8.2     -0.9                -0.9                          13.4         0.83          O             --                  O              --
7      China           Food Beverage & Tobacco                                                22,286         1.5     14.2          17.6      -0.7                -0.9                              9.3      0.97            -               -                  -             -
8      Taiwan          Capital Goods                                                             9,400       1.5     12.6          11.1      -1.0                -1.0                          10.3         0.97          O             --                  O                -
9      India           Telecommunication Services                                                4,516       2.0     18.0          21.4      -0.6                -0.6                              4.1      0.87            -               -               --             --
10 Taiwan              Automobiles & Components                                                  7,681       1.4     14.2          21.1      -0.7                -1.0                              7.1      1.04            -           --                     -            +
11 China               Materials                                                              29,268         0.9         7.7       11.7      -1.0                -1.0                              8.9      0.87        ++              --                     -           --
12 Korea               Semiconductors & Semiconductor Equipment                             153,775          1.6     10.5          11.8      -0.9                -0.6                              8.3      0.91          O                 -                  -           --
13 Korea               Diversified Financials                                                 10,246         0.7     10.7                    -0.7                -1.0                              4.5      0.95          O             --                  --               -
14 Indonesia           Materials                                                                 8,406       3.2     13.1          14.4      -0.7                -0.5                          10.4         1.00            -               -               O              O
15 Korea               Household & Personal Products                                          10,032         3.9     23.4          19.0      -0.8                -0.3                              8.4      1.05          --                -                  -            +
16 India               Capital Goods                                                          13,851         2.5     13.4          11.9      -0.6                -0.6                          13.4         0.99          O                 -               O                -
17 Taiwan              Technology Hardware & Equipment                                        97,160         1.4     10.7          11.4      -0.5                -0.7                          10.7         0.97          +                 -               O                -
18 India               Real Estate                                                               2,388       0.9     13.0          16.0      -0.5                 0.0                              3.5      0.95          O             O                   --               -
19 Malaysia            Transportation                                                            3,823       1.7     17.1          14.9      -0.3                -0.2                          11.8         0.97            -           O                   O                -
20 Singapore Transportation                                                                   12,117         1.7     15.7          16.4      -0.3                -0.3                          10.7         1.03            -           O                   O              O

                       Median                                                                  10,139         1.6     13.3          14.9 -0.73                     -0.79                           9.1          0.97
                       Average                                                                 24,369         1.8     15.2          14.3 -0.75                     -0.70                           7.8          0.95
Source: Deutsche Bank, DataStream. FactSet. EPS revisions is calculated for each stock as the number of analysts revising up the FY1 EPS less number of analysts revising down the FY1 divided by total number of
changes in the past three months. We then take the median of these EPS revisions scores for all individual stocks in the country-sector. RSI is the ratio of 65-day to 260-day moving average in stock price. All the metrics
shown above except market cap are median data for the sector.


Changes: Removed India utilities and food beverage & tobacco, Indonesia telecommunications and Taiwan semis and added Taiwan capital goods, Korea diversified financials, China materials and Indonesia materials


Page 18                                                                                                                                                                                                  Deutsche Bank AG/Hong Kong
17 October 2012
The Investigator


Figure 14: Asian country sector heat-map for all covered sectors


                                                                                 Hong Kong


                                                                                                                                       Philippines

                                                                                                                                                     Singapore
                                                                                                       Indonesia


                                                                                                                            Malaysia


                                                                                                                                                                 Thailand

                                                                                                                                                                              Taiwan


                                                                                                                                                                                       Japan
                                                                                                                   Korea
                                                                         China


                                                                                               India
Energy                                                                   102      -10           40     124          51       95         -10           -10        104           -10      72
Materials                                                                134      -10           62     128          83       92         -10           -10        109          143       85
Capital Goods                                                            115     116           117     111          78       66          87           71          -10         137       63
Commercial Services & Supplies                                            -10     -10           -10     -10        -10       -10        -10           -10         -10          -10      29
Transportation                                                           125     100            -10     -10         91       90         -10           79          -10         140       48
Automobiles & Components                                                 122      -10           82      58          32       38         -10           -10         -10         135       43
Consumer Durables & Apparel                                               -10     77            -10     -10        107       -10        -10           -10         -10          41       45
Hotels Restaurants & Leisure                                              -10     97            -10     -10         37       61         -10          145          -10          -10     126
Media                                                                     -10     -10           98      -10        -10       -10        -10           88          75           -10      20
Retailing                                                                141     123            -10     -10        114       -10        -10           31          -10         139       17
Food & Staples Retailing                                                 146      -10           -10     -10        120       -10         47          113          10          119       21
Food Beverage & Tobacco                                                  138      -10           73      53          67       81         -10          130         129           -10      54
Household & Personal Products                                            147      -10           39        9        127       -10        -10           -10         -10          -10      86
Health Care Equipment & Services                                           93     -10           -10     -10        -10       -10        -10           -10         -10          -10      23
Pharmaceuticals & Biotechnology                                           -10     -10           55      14         106       -10        -10           -10         -10          -10      26
Banks                                                                      19     36            22        8         25       30            7          33            6          46        2
Diversified Financials                                                    -10    105            42      -10        132       49          16           84          -10          89       28
Insurance                                                                110      -10           -10     -10         24       -10        -10           -10         -10          59       68
Real Estate                                                                13     15            96      -10        -10       -10         34           27          -10         131       60
Software & Services                                                        57     -10           11      -10        144       -10        -10           -10         -10          -10      35
Technology Hardware & Equipment                                          108      70            -10     -10         52       -10        -10           -10         -10         103      101
Semiconductors & Semiconductor Equipment                                  -10    118            -10     -10        133       -10        -10           -10         -10          74      142
Telecommunication Services                                                 64     76           136      56         112       50          80           99            3          65        5
Utilities                                                                  12     94            69        4         44       18            1          -10         -10          -10     121

O ver a ll (bot t om -up r a nking) - Cur r ent                            7        9            3        2        10          4           5            8           1          11        6

Overall (bottom-up ranking) - Previous                                     8        3            6        7          9       10            1            5           2          11        4
Overall (bottom-up ranking) - Avg of above                                 8        6            5        5         10         7           3            7           2          11        5

V a lua t ion - Cur r ent                                                  1        5            2      10           3         8        11              7           9           6        4
Valuation - Previous                                                       1        5            4        9          3       10          11             8           6           7        2
E a r nings Revis ions - Cur r ent                                        11        6            5        2        10          3           1            7           4           9        8
Earnings Revisions - Previous                                              11       6            8        4          9         7           1            3           2          10        5
P r of it a bilit y - Cur r ent                                            4        8            2        1          9         5           3            7           6          10       11
Profitability - Previous                                                   4        8            2        1          9         6           5            7           3          10       11
Tec hnic a ls - Cur r ent                                                 10        6            5        8        11          4           1            2           3           7        9
Technicals - Previous                                                      10       6            5        9         11         3           1            4           2           7        8
Source: Deutsche Bank. Numbers are ranks, smaller is better. Green color = Most attractive country sectors, Red color=Least attractive country sectors. Yellow
color = Neutral country sectors. White space = sector market cap too low or data unavailable.


Figure 15: Bottom-up sector model backtest
16,384                                                     16,384 512                                                                                    512 2,048                     Most attractive sectors               2,048
                    Most attractive sectors                                                    Least attractive sectors
                                                                                               (bottom quintile)                                                                       vs least attractive sectors
                    (top quintile)                                                                                                                                1,024                                                      1,024
 4,096                                                     4,096                                                                                                                       relative performance
                                                                     256                                                                                 256
                                                                                                                                                                       512                                                   512
 1,024                                                     1,024
                                                                                                                                                                       256                                                   256
                                                                     128                                                                                 128
    256                                                    256                                                                                                         128                                                   128
                                     Backtest                                                                        Backtest                                                                            Backtest
     64                                                    64          64                                                                                64                 64                                               64
       01/92      01/97      01/02     01/07     01/12                   01/92               01/97     01/02             01/07         01/12                                  01/92     01/97    01/02     01/07     01/12


Source: Deutsche Bank, Real time is from 30 September 2010. Note: Past performance does not guarantee future results. Last updated in May 2012


Deutsche Bank AG/Hong Kong                                                                                                                                                                                                           Page 19
17 October 2012
The Investigator


Asia Model Portfolio

Figure 16: Deletions from model portfolio since inception (13 September 2010)
                                              Date      Date     DB     Close                                                           Date      Date              Close
Company                       BB Ticker      Added     Removed Rec    16Oct12   Company                                    BB Ticker    Added    Removed DB Rec   16Oct12
Deletions as of 2 Nov 2010                                                      Deletions as of 30 Sep 2011
Agri. Bank of China           1288 HK       13Sep10    2Nov10    H       3.18   DSME                                       042660 KS   22Jul11   30Sep11   H        23600
Anta Sports                   2020 HK       13Sep10    2Nov10    H       6.90   OCI Company                                010060 KS   14Sep10   30Sep11   NR      161500
Fraser & Neave                FNN SP        13Sep10    2Nov10    B       8.90   BRI                                        BBRI IJ     30Aug11   30Sep11   B      7550.00
Deletions as of 10Dec2010                                                       Samsung Eng.                               028050 KS   14Sep10   30Sep11   H       170000
China Shineway                2877 HK       13Sep10 10Dec10      H      10.86   Siam Cement                                SCC TB      22Jul11   30Sep11   B       355.00
Chunghwa Tel                  2412 TT       13Sep10 10Dec10      H      92.30   KWG Property                               1813 HK     11Dec10   30Sep11   B         4.50
Far EasTone Telecom           4904 TT       13Sep10 10Dec10      B      72.40   SOHO China                                 410 HK      3Nov10    30Sep11   B         5.16
First Philippine Hldgs        FPH PM        13Sep10 10Dec10      B      80.70   Deletions as of 11 Nov 2011
LIG Insurance                 002550 KS 13Sep10 10Dec10          NR     26500   Hyundai Dept Store                         069960 KS   14Sep10   11Nov11   B       144000
Perusahaan Gas Negara PGAS IJ               13Sep10 10Dec10      B    4325.00   SJM                                        880 HK      14Sep10   11Nov11   B        16.30
PLUS Expressways              PLUS MK       13Sep10 10Dec10      NR       NA    Taiwan Cement                              1101 TT     30Aug11   11Nov11   H        36.65
SATS                          SATS SP       13Sep10 10Dec10      B       2.75   Deletions as of 19 Jan 2012
Top Glove                     TOPG MK       13Sep10 10Dec10      B       5.31   Powertech Technology                       6239 TT     5May11    19Jan12   S        51.80
Wynn Macau                    1128 HK       13Sep10 10Dec10      B      20.55   Deletions as of 9 March 2012
Deletions as of 24 Jan 2011                                                     Amorepacific Corp.                         090430 KS   30Sep11   9Mar12    H      1231000
Dongfeng Motor                489 HK         2Nov10    24Jan11   B       9.90   Hong Leong Bank Bhd.                       HLBK MK     11Nov11   9Mar12    H        13.98
Hang Lung Properties          101 HK        13Sep10 24Jan11      B      26.50   Industrial Bank of Korea                   024110 KS   22Jul11   9Mar12    H        11800
Deletions as of 4 May 2011                                                      KT&G Corp.                                 033780 KS   14Oct10   9Mar12    H        92000
Delta Electronics             2308 TT       13Sep10 4May11       B     105.00   Deletions as of 15 May 2012
Franshion                     817 HK        10Dec10 4May11       B       2.39   Aboitiz Power Corp.                        AP PM       14Sep10   15May12   H        33.45
Genting Bhd                   GENT MK       10Dec10 4May11       H       8.81   Krung Thai Bank Public Co., Ltd.           KTB TB      12Dec10   15May12   B        18.60
Kasikornbank                  KBANK TB 10Dec10 4May11            B     176.00   PT Charoen Pokphand Indonesia Tbk          CPIN IJ     11Nov11   15May12   B      3050.00
Nexen Tire                    002350 KS 13Sep10 4May11           H      18100   PT Perusahaan Gas Negara (Persero) Tbk     PGAS IJ     8Mar12    15May12   B      4325.00
Orise Technology              3545 TT       27Jan11 4May11       B      34.90   Yangzijiang Shipbuilding (Holdings) Ltd.   YZJ SP      14Sep10   15May12   H         0.94
Shanghai Electric             2727 HK       13Sep10 4May11       B       3.09   Deletions as of 26 June 2012
Deletions as of 6 Jun 2011                                                      Formosa Chemicals & Fibre                  1326 TT     14Sep10   26Jun12   H        74.20
DiGi.Com                      DIGI MK       13Sep10    6Jun11    H       5.44   China Construction Bank-H                  939 HK      14Sep10   26Jun12   H         5.68
Bank of Baroda                BOB IN        10Dec10    6Jun11    B     766.80   Wharf Holdings ltd                         4 HK        14Sep10   26Jun12   H        51.90
Deletions as of 21 Jul 2011                                                     Deletions as of 7 August 2012
China CITIC                   998 HK        4May11     21Jul11   H       4.05   Wipro Ltd                                  WPRO IN     20Jan12   6Aug12    B       352.10
Asian Paints                  APNT IN       13Sep10 21Jul11      H    3882.15   United Tractors Tbk Pt                     UNTR IJ     9Mar12    6Aug12    B        19600
Hyundai Heavy                 009540 KS 10Dec10 21Jul11          B     235000   Public Bank                                PBKF MK     15May12   6Aug12    H        14.56
Korean Reinsurance            003690 KS      2Nov10    21Jul11   NR     11600   Mstar Semiconductor Inc                    3697 TT     30Sep12   6Aug12    B       244.50
Deletions as of 29 Aug 2011                                                     Bank of China Ltd-H                        3988 HK     14Sep10   6Aug12    B         3.07
Sinopec-H                     386 HK        11Dec10 29Aug11      B       7.82   Hyundai Marine & Fire Ins Co               001450 KS   22Jul11   6Aug12    NR       37000
Cathay Pacific                293 HK        14Sep10 29Aug11      S      13.46   Deletions as of 17 October 2012
Maanshan-H                        323 HK 7Jun11        29Aug11   S       1.94   HYUNDAI MOTOR CO                           005380 KS   14Sep10   17Oct12   B       227500
Siliconware Precision         2325 TT        7Jun11    29Aug11   H      32.40   HYUNDAI MOBIS                              012330 KS   31Aug11   17Oct12   B       300000
                                                                                SIMPLO TECHNOLOGY CO LTD                   6121 TT     5May11    17Oct12   B       177.00
                                                                                STARHUB LTD                                STH SP      30Sep11   17Oct12   H         3.66
Source: Deutsche Bank, FactSet, Bloomberg Finance LP


Page 20                                                                                                                                  Deutsche Bank AG/Hong Kong
17 October 2012
The Investigator


Global – valuation
High policy uncertainty, and the attendant flight from junior tranches of the capital
structure, along with a dismal prior decade of equity returns keeps them “cheap”.
Reduced policy uncertainty and losses from bond portfolios are likely to be required as
catalysts to unlock value in equities.

Figure 17: Composite valuation index                                                                     Figure 18: Price-to-book value

    3.0                 MSCI AC World 12m fd rtn (RS)              60%                                      4.5                                                                         4.5
                                                                                                                                                       World P/BV
                        World Composite Valuation Index (S.D., LS)                                          4.0                                                                         4.0
    2.0                                                            40%
                                         Expensive                                                          3.5                                                                         3.5
    1.0                                                            20%
                                                                                                            3.0                                                                         3.0
    0.0                                                                                      0%             2.5                                                                         2.5
                                                                                                            2.0                                                                         2.0
   -1.0                                                                                     -20%
                                                                                                            1.5                                                                         1.5
   -2.0                                                  Cheap                              -40%
                                                                                                            1.0                                                                         1.0
   -3.0                                                                                     -60%            0.5                                                                         0.5
       1/75 1/80 1/85 1/90 1/95 1/00 1/05 1/10                                                                    1/75     1/80      1/85       1/90   1/95    1/00     1/05   1/10

Source: Deutsche Bank, IBES, MSCI. Note: Composite valuation index is the average of trailing P/E, 12m   Source: Deutsche Bank, MSCI, DataStream
forward P/E, P/Cash Earnings, P/BV, Dividend Yield, EV/EBITDA and EV/Sales, normalized over entire
history


Figure 19: 12m forward P/E                                                                               Figure 20: 12m trailing P/E

     25                                                                                        25            40                                                                         40
                        World 12m Forward P/E                                                                                                      World Trailing P/E
     23                                                                                        23
                                                                                                             35                                                                         35
     21                                                                                        21
     19                                                                                        19            30                                                                         30
     17                                                                                        17            25                                                                         25
     15                                                                                        15
     13                                                                                        13            20                                                                         20
     11                                                                                        11            15                                                                         15
      9                                                                                        9
                                                                                                             10                                                                         10
      7                                                                                        7
      5                                                                                        5               5                                             5
       1/87 1/90 1/93 1/96 1/99 1/02 1/05 1/08 1/11                                                             1/73 1/78 1/83 1/88 1/93 1/98 1/03 1/08 1/13

Source: Deutsche Bank, MSCI, I/B/E/S                                                                     Source: Deutsche Bank, MSCI, DataStream


Figure 21: EV multiples                                                                                  Figure 22: ROE and EBIT margin

     16                                 World EV/EBITDA (LS)                                   2.5          18%                World ROE (LS)                 World EBIT/Sales (RS) 14%
                                        World EV/SALES (RS)                                    2.3          16%                                                                     13%
     14                                                                                        2.1          14%                                                                        12%
     12                                                                                        1.9          12%
                                                                                               1.7                                                                                     11%
                                                                                                            10%
     10                                                                                        1.5                                                                                     10%
                                                                                                              8%
                                                                                               1.3                                                                                     9%
       8                                                                                       1.1            6%
                                                                                                              4%                                                                       8%
       6                                                                                       0.9
                                                                                               0.7            2%                                                                       7%
       4                                                                                       0.5            0%                                             6%
        1/87 1/90 1/93 1/96 1/99 1/02 1/05 1/08 1/11                                                            1/73 1/78 1/83 1/88 1/93 1/98 1/03 1/08 1/13

Source: Deutsche Bank, MSCI, FactSet                                                                     Source: Deutsche Bank, MSCI, FactSet


Deutsche Bank AG/Hong Kong                                                                                                                                                            Page 21
17 October 2012
The Investigator


Global metrics

Despite all the despair about global growth, our own mother of all leading indicators
(MOMLI) is looking up, as are asset-price-based opinions on global growth. Meanwhile,
analysts have lost confidence and are looking for just 5% EPS growth globally in 2012,
and 12% for 2013. Global Risk-Love (sentiment) has now entered euphoria, a slight
concern. The global Tape is very strong, and the Marshallian K is rising.

Figure 23: Market – implied global growth leading                                     Figure 24: Global long leading indicator (MOMLI)
indicators
                                                                                         120                 Global long leading indicator (pushed   12%
                                                                                                 %
           S.D.                                             S.D.                                             fwd by 5m, LS)
 3                                                                               3         80                OECD G7 composite leading indicator     8%
                   Style-Based Leading Economic Indicator, LS
                                                                                                             (YoY%, RS)
 2                 Asset-Price-Based Global Growth Indicator, RS                 2         40                                                        4%

 1                                                                               1           0                                                       0%

 0                                                                               0        -40                                                        -4%
-1                                                                               -1       -80                                                        -8%
-2                                                                               -2
                                                                                         -120 OECD Composite Leading Indicator as of June2012 -12%
                                                                                             1/89    1/95       1/01        1/07         1/13
-3                                                                               -3
  1/89       1/92        1/95      1/98       1/01   1/04   1/07   1/10   1/13

Source: Deutsche Bank                                                                 Source: Deutsche Bank, OECD


Figure 25: Earnings growth forecast (%)                                               Figure 26: Global equity Risk-Love indicator

     25                                                     12/2011F        25          1.2             MSCI AC World 6m fd rtn (RS)                 40%
     23                                                     12/2012F        23                          Global Risk-Love, SD (LS)
     21                                                                     21          0.8
                                                            12/2013F                                 Euphoria                                        20%
     19                                                                     19
                                                                                        0.4
     17                                                                     17
     15                                                                     15          0.0                                                          0%
     13                                                                     13
     11                                                                     11         -0.4
      9                                                                     9                                                                        -20%
      7           MSCI AC World                                             7          -0.8
                                                                                                             Panic
      5                                                                     5          -1.2                                                          -40%
          1/09    7/09     1/10        7/10   1/11   7/11   1/12   7/12
                                                                                           1/00 1/02 1/04 1/06 1/08 1/10 1/12
Source: Deutsche Bank, I/B/E/S, MSCI                                                  Source: Deutsche Bank, MSCI


Page 22                                                                                                                         Deutsche Bank AG/Hong Kong
17 October 2012
The Investigator


Global metrics (continued)

Figure 27: Percentage of countries above their 10-WMA                                                       Figure 28: Global free liquidity

120%                     % of countries trading above 10-                                       120%         15                                                                                   %            15
                                                                                                                          %                          Global Free Liquidity
100%                     week moving average                                                    100%
                                                                                                             10                                                                                                10
  80%                                                                                           80%
                                                                                                               5                                                                                               5
  60%                                                                                           60%
  40%                                                                                           40%            0                                                                                               0

  20%                                                                                           20%
                                                                                                              -5         G7 M2 Growth (MZM for US, M4 for UK) less G7                                          -5
     0%                                                                                     0%                           Consumer Price Inflation less G7 Leading
                                                                                                                         Economic Indicator Growth
       1/09                   1/10               1/11                1/12               1/13                -10                                                  -10
                                                                                                               1/85 1/88 1/91 1/94 1/97 1/00 1/03 1/06 1/09 1/12
Source: Deutsche Bank. Includes 49 Markets.                                                                 Source: Deutsche Bank


Figure 29: Commodity Risk-Love indicator                                                                    Figure 30: Energy Risk-Love indicator

                                                                                                              2.0                             Energy Risk-Love (S.D.)                                        2.0
   3                                             Commodities Risk-Love                                 3                                                                                                     1.5
            Euphoria                             (S.D.)
   2                                                                                                   2      1.0                                                                 Euphoria                   1.0
   1                                                                                                   1                                                                                                     0.5
                                                                                                              0.0                                                                                            0.0
   0                                                                                                   0
                                                                                                                                                                                                             -0.5
 -1                                                                                                    -1    -1.0                                                                                            -1.0
 -2                                   Panic                                                            -2                                       Panic                                                        -1.5
 -3                                                                                                    -3    -2.0                                                                                            -2.0
   1/00            1/02         1/04          1/06          1/08         1/10          1/12                      1/00           1/02        1/04         1/06        1/08         1/10        1/12
Source: Deutsche Bank                                                                                       Source: Deutsche Bank


Figure 31: 6m total equity offerings* as percentage of                                                      Figure 32: Composite policy indicator
total market cap
   1.6%                                                                                        1.6%             2.5      S.D.                                                                    S.D.      2.5
                6m total IPOs & addl offerings as of Sep 2012:
   1.4%         US=U$128.8bn, EU=U$23.5bn, JP=U$15.5bn                                         1.4%             2.0                                                                                        2.0
                                                                                                                                                Easy Monetary/Fiscal Policy
   1.2%                                                                                        1.2%             1.5                                                                                        1.5
   1.0%                                                                                        1.0%             1.0                                                                                        1.0
   0.8%                                                                                        0.8%             0.5                                                                                        0.5
   0.6%                                                                                        0.6%             0.0                                                                                        0.0
   0.4%                                                                                        0.4%            -0.5                                                                                        -0.5
   0.2%                                                                                        0.2%            -1.0                                       Tight Monetary/Fiscal Policy
                                                                                                                                                                -1.0
                                US                  Japan                   Europe
   0.0%                                                                                        0.0%            -1.5           Europe        US         Japan    -1.5
       1/99           1/01       1/03       1/05       1/07        1/09       1/11                                 1/81 1/85 1/89 1/93 1/97 1/01 1/05 1/09 1/13

Source: Deutsche Bank, Bloomberg Finance LP, DataStream                                                     Source: Deutsche Bank, DataStream, CEIC, IMF. Note: Composite policy indicator is an equal weighted
Note: *Equity offerings include IPO and additional equity offerings of primary and secondary shares.        index of real effective exchange rate yoy growth, real broad money (M2) yoy growth, yield curve (long
Data as of close 25 Aug, 2011.                                                                              minus short term interest rate) and government fiscal deficit/surplus as % of GDP.


Deutsche Bank AG/Hong Kong                                                                                                                                                                              Page 23
17 October 2012
The Investigator


Global – market intelligence

Figure 33: Market intelligence by country
11Oct12                                         Mcap        LC Perf                  P/E (x)                     P/B (x)                Div Yld (%)                 EPSg (%)                    ROE (%)
Region/Country (#Co)                             U$m        1m     YTD      CY11      CY12 CY13 CY11 CY12 CY13 CY11 CY12 CY13 CY11 CY12 CY13 CY11 CY12 CY13
North America (704)                      14,701,320        -0.1 12.9         15.0      14.1     12.6       2.2      2.0      1.8      1.9      2.2      2.4    16.4       5.7    11.4     14.7     14.3      14.6
Canada (101)                              1,255,992         0.1     2.4      14.2      14.1     12.4       1.8      1.6      1.5      2.6      2.9      3.1    18.8      -1.0    12.2     13.0     11.5      12.5
US (603)                                 13,445,328        -0.1 13.9         15.0      14.1     12.6       2.3      2.0      1.9      1.9      2.1      2.3    16.2       6.3    11.3     14.9     14.7      14.9
Europe (447)                              6,791,499        -0.3     8.2      11.5      11.8     10.6       1.5      1.5      1.4      3.7      3.8      4.1      0.8     -3.5    12.7     13.0     12.2      12.6
Austria (9)                                   28,469        2.1     8.8      12.8      10.5       9.0      0.9      0.9      0.8      3.0      3.5      4.0 -24.7       22.0     16.5       7.0      8.3      9.2
Belgium (12)                                 120,098        0.5 30.7         19.1      14.7     14.1       1.8      1.7      1.6      2.4      2.7      3.0     -6.6    30.5     10.8       9.7    11.6      12.0
Denmark (11)                                 123,858        0.2 28.0         24.4      19.3     15.6       2.7      2.6      2.4      1.3      1.6      2.1     -7.0    26.6     23.4     11.1     13.4      15.3
Finland (14)                                  78,085       -0.5     -0.3     11.8      12.6     11.7       1.3      1.4      1.4      5.0      4.8      5.1 -19.3 -41.3          46.3     11.3     12.1      12.3
France (73)                                  963,374       -2.9     9.1      11.0      11.1     10.1       1.2      1.2      1.1      3.7      4.0      4.3     -0.6     -4.4    11.4     11.0     10.5      10.6
Germany (52)                                 893,699        0.0 19.5         12.2      11.2     10.3       1.5      1.4      1.3      3.5      3.6      3.8     -8.4      8.9      9.9    12.2     12.1      12.4
Greece (2)                                      5,309      -2.9 -16.1        17.2      18.9     11.3       1.9      1.7      1.6      0.0      1.5      2.3 -15.1 -14.4 -24.2             25.3     19.8      14.3
Ireland (4)                                   27,673       -1.6     -0.9     16.8      17.1     15.3       1.3      1.3      1.3      3.1      3.1      3.1    11.7      -1.8       na      8.0      7.4      8.2
Italy (27)                                   235,169       -3.6     3.7        9.4       9.9      8.7      1.0      0.9      0.9      4.2      4.2      4.7 -14.9         8.4    13.1       9.2      7.7      8.2
Netherlands (22)                             259,827       -1.0 10.4         12.4      11.8     10.4       1.4      1.4      1.3      2.6      3.1      3.6     -7.2      7.5    12.5     11.7     12.0      12.7
Norway (10)                                  101,921        0.3     9.4      11.4      10.7       9.9      1.6      1.5      1.4      4.3      4.7      4.4    21.4       6.8      7.5    14.3     13.9      13.8
Portugal (5)                                  17,942       -0.3     -6.0     12.1      12.4     11.6       1.7      1.5      1.4      4.1      4.3      4.6 -22.3        -2.7      7.2      9.5      9.3      9.6
Spain (24)                                   298,942       -3.3     -9.8       8.5     12.4       9.4      1.0      1.1      1.0      6.7      5.0      5.9 -10.2 -40.7          50.7     11.4       8.5     10.6
Sweden (35)                                  323,474       -0.8     7.5      13.6      13.5     12.0       1.9      1.8      1.6      3.8      4.0      4.3     -5.2      0.7    11.8     14.0     14.0      13.7
Switzerland (40)                             909,221        2.1 11.7         14.9      13.9     12.3       2.2      2.1      1.9      3.3      3.5      3.8     -9.5      7.2    12.7     12.9     14.8      15.7
UK (107)                                  2,404,439         0.5     4.6      10.4      11.3     10.3       1.7      1.6      1.5      3.8      4.0      4.3    15.3      -7.7      9.9    16.1     13.9      14.1
Japan (316)                               1,944,263        -2.6     -1.8     13.2      12.2     10.4       0.9      0.9      0.8      2.6      2.8      3.0 -15.9       33.7     29.6       6.8      7.4      8.2
Asia Pac ex Japan (690)                   3,608,175         3.0 10.2         13.1      12.5     11.3       1.7      1.6      1.4      3.1      3.2      3.5      0.2      6.8    11.5     12.6     12.8      13.0
Asia ex Japan (616)                       2,671,032         2.8     9.9      13.1      12.2     10.9       1.7      1.5      1.4      2.6      2.7      2.9     -1.4      9.7    13.0     12.4     12.8      12.9
Australia (69)                               924,116        3.7 10.8         13.2      13.3     12.4       1.7      1.7      1.6      4.6      4.8      5.1      5.0     -1.1      6.9    13.3     12.8      13.2
China (141)                                  639,567        6.7     7.4      10.1        9.9      9.1      1.6      1.5      1.3      3.3      3.3      3.5    10.2       2.5      9.1    16.5     15.2      14.7
Hong Kong (42)                               319,157        3.9 16.9         13.9      15.7     14.3       1.4      1.4      1.2      3.0      2.9      3.1    19.9 -11.4        10.2     10.1       8.3      8.4
India (73)                                   253,910        5.8 22.7         16.6      15.4     13.6       2.8      2.5      2.0      1.3      1.5      1.7    11.0       9.8    12.8     16.4     16.1      15.6
Indonesia (25)                                98,073        4.1     9.2      16.2      15.1     13.4       3.8      3.3      2.8      2.0      2.7      2.9    18.8       7.3    12.7     24.2     22.3      21.7
Korea (105)                                  537,727       -0.1     6.5      12.6        9.8      8.3      1.3      1.2      1.1      1.1      1.2      1.4 -16.3       34.7     17.5       8.6    12.4      12.9
Malaysia (44)                                131,170        2.6     5.0      16.4      15.4     14.0       2.1      2.0      1.8      2.8      3.3      3.5      8.4      9.4    10.2     13.1     13.1      13.3
New Zealand (5)                               13,027        1.2 11.5         16.1      16.3     14.4       1.6      1.7      1.6      5.5      5.4      5.5     -3.5     -1.5    13.0     10.1     10.2     11.4
Philippines (19)                              32,409        4.0 23.0         19.7      17.6     15.7       3.0      2.7      2.4      2.3      2.3      2.5      5.4    11.9     12.4     15.4     15.4      15.5
Singapore (32)                               193,776       -0.2 14.9         14.3      13.9     13.0       1.5      1.4      1.4      3.6      3.6      3.8     -3.4      7.4      5.6    10.8     10.5      10.5
Taiwan (114)                                 385,794       -0.5     4.1      16.1      15.1     13.1       1.7      1.7      1.6      3.3      3.2      3.7 -29.1         9.3    21.5     12.5     11.4      12.5
Thailand (21)                                 79,447        2.0 18.5         14.5      12.6     10.6       2.6      2.2      1.9      3.1      3.6      4.2    16.2     13.7     18.7     17.9     16.4      17.4
EM EU/M East/Africa (139)                    645,810        0.4 11.1         11.0      11.1       9.9      1.4      1.3      1.2      3.2      3.6      4.0    26.1      -3.7      6.5    16.6     13.6      13.1
Czech Republic (3)                            11,756        2.0     2.5      10.9      10.7     10.9       1.8      1.7      1.7      6.3      6.0      6.1 -12.4         1.4     -1.4    16.8     16.3      15.4
Egypt (8)                                     13,176        0.5 61.0         10.6      12.0       9.8      1.1      1.8      1.8      2.3      3.4      4.0    20.9     45.9       9.2      7.3    11.4      11.4
Hungary (4)                                   11,383        3.6 14.4           8.2       9.8      8.0      1.0      0.9      0.9      1.3      3.1      3.9    13.9 -16.3        21.6     12.4       9.6     10.8
Israel (10)                                   62,534        0.1     -1.3       8.4       8.5      7.9      1.6      1.4      1.2      2.5      2.3      2.9    12.4       1.1      7.6    20.2     16.6      16.2
Morocco (3)                                     2,981      -8.0 -19.9        11.6      10.6       9.6      2.6      2.6      2.4      4.9      4.7      3.4     -1.4      9.3    10.7     22.0     24.6      25.5
Poland (21)                                   54,896        1.4 11.2         11.8      10.5     10.9       1.3      1.2      1.2      4.1      4.0      4.6    25.5 -13.1         -3.0    14.3     11.9      10.9
Russia (26)                                  219,329       -2.2     4.9        7.2       8.5      7.9      0.8      0.8      0.7      2.1      3.7      3.8    37.2 -11.8          1.2    17.8     12.7      11.6
South Africa (50)                            268,550        1.6 11.2         14.9      12.9     11.1       2.4      2.2      2.0      3.4      3.7      4.1    19.1     14.9     16.9     15.7     16.9      17.4
Turkey (24)                                   63,739        3.0 36.0         12.4      11.4     10.1       1.9      1.7      1.5       na      2.7      2.9     -6.7      9.3    12.6     15.4     15.0      15.0
Latin America (137)                          777,498        1.3     5.7      14.7      14.2     11.7       1.7      1.7      1.6      3.5      2.9      3.1     -1.4     -1.7    17.9     12.3     12.4      13.7
Brazil (78)                                  463,391        0.0     3.6      12.9      12.4     10.3       1.4      1.4      1.3      3.8      3.4      3.6     -2.8     -9.0    18.5     12.2     11.8      12.7
Chile (20)                                    68,354        0.7     -2.9     17.4      17.0     15.0       2.1      2.0      1.9      3.5      3.1      3.2     -8.4      2.0    13.8     11.8     12.1      12.8
Colombia (14)                                 44,576        2.3 10.4         18.2      16.0     13.1       1.6      1.3      1.2      2.2      3.1      3.4    36.6     22.6     22.1       8.0      7.4      7.9
Mexico (21)                                  177,223        4.3 13.2         20.3      19.5     15.3       3.0      2.9      2.6      3.3      1.8      1.9     -2.2    34.1     17.7     11.6     14.7      19.6
Peru (4)                                      23,953        3.2     9.0      12.4      12.8     11.6       3.6      3.0      2.6      2.3      2.7      2.7    31.0      -3.1    10.2     28.2     23.7      21.7
Developed Markets (1625)                 24,949,691        -0.2 10.2         13.6      13.2     11.8       1.8      1.6      1.5      2.6      2.8      3.0      8.0      3.8    12.9     12.8     12.5      12.9
Emerging Markets (818)                    3,581,406         2.1     8.3      12.8      12.0     10.5       1.6      1.5      1.4      2.8      2.8      3.1      3.2      5.7    12.8     13.6     13.5      13.7
World (2443)                             28,531,097         0.1     9.9      13.5      13.1     11.6       1.7      1.6      1.5      2.6      2.8      3.0      7.3      4.0    12.9     12.9     12.6      13.0
Source: Deutsche Bank, I/B/E/S, MSCI. Note: Data in the table are compiled based on MSCI AC World index universe. P/E, P/B, dividend yield, EPS growth and ROE are aggregated using I/B/E/S consensus estimates
(calendarized to December year end) with current prices. All numbers are free-float adjusted.


Page 24                                                                                                                                                            Deutsche Bank AG/Hong Kong
17 October 2012
The Investigator


Global – market intelligence (continued)

Figure 34: Market intelligence by sector
11Oct12                                       Mcap          LC Perf     P/E (x)         P/B (x)      Div Yld (%)        EPSg (%)         ROE (%)
Sector (#Co)                                   U$m          1m YTD CY11 CY12 CY13 CY11 CY12 CY13 CY11 CY12 CY13 CY11 CY12 CY13 CY11 CY12 CY13
Energy (172)                              3,186,599        -0.7 1.3 10.3 11.3 10.4  1.6    1.4  1.3 2.8   3.0    3.1 26.6 -9.6   7.9 16.2 12.9 12.8
Materials (272)                           2,137,281         0.5     2.1      11.9      13.4     11.0       1.5      1.5      1.4      2.6      2.6      2.8     14.6 -15.1       21.4     13.2      11.1     13.0
Capital Goods (247)                       2,116,557        -0.4     7.2      12.6      12.7     11.3       2.0      1.8      1.6      2.6      2.9      3.1     15.6      5.9    11.3     15.1     14.6      14.9
Comm Svc (36)                                209,582       -0.8     8.6      18.6      17.1     15.1       2.7      2.9      2.4      2.4      2.6      2.7      5.0      8.8    13.2     12.9     13.3      14.2
Transportation (97)                          544,596       -1.0     5.8      18.0      16.2     13.6       2.0      1.8      1.7      2.1      2.3      2.6 -15.1       19.2     21.5     10.1      10.8     12.3
Autos (72)                                   678,531       -2.8     8.6      11.0        9.0      7.7      1.2      1.1      1.0      2.0      2.4      2.8        4       25    20.6     11.1     12.6      13.0
Cons Durables (59)                           382,697       -2.4     6.9      18.7      15.3     13.4       1.9      1.8      1.7      1.8      2.0      2.2 -78.6 415.4          68.3       8.7    11.7      12.4
Cons Svc (48)                                411,077       -0.5     3.9      19.3      18.3     15.9       3.5      3.3      3.0      2.2      2.4      2.6     17.2      4.7    12.1     18.4      17.9     19.2
Media (56)                                   690,559        1.5 26.9         18.0      15.3     13.6       2.4      2.3      2.1      1.7      2.0      2.1     17.5    21.0       8.7    13.1     14.8      14.8
Retailing (84)                               787,901       -0.8 18.5         21.0      18.7     16.0       3.5      3.2      3.0      1.5      1.6      1.8     10.6    11.8     15.0     16.1      16.8     18.2
Food/Staples Retail (52)                     657,452       -0.2     9.2      16.1      14.9     13.5       2.2      2.1      1.9      2.4      2.6      2.9      7.3      8.0    10.4     13.9     14.0      14.4
Food Beverage (114)                       1,853,657         1.5 11.4         18.1      17.2     15.5       3.4      3.2      2.9      2.8      3.0      3.3      8.0      5.2    10.8     18.3      17.6     18.1
Household Products (29)                      500,048        0.9 10.4         19.2      18.6     17.2       3.4      3.2      3.1      2.7      2.9      3.0      1.0      3.1      7.8    18.3     18.2      18.3
Health Care Equip/Svc (64)                   657,781        2.9 15.4         15.5      14.2     12.8       2.6      2.2      2.0      1.1      1.2      1.4      9.8      9.6    11.0     17.2     15.7      15.4
Pharma & Biotech (71)                     2,071,230         1.7 14.9         13.6      13.5     12.6       3.0      2.8      2.6      2.8      3.0      3.2      3.6      0.8      6.7    21.5     20.8      19.3
Banks (189)                               2,617,624         1.9 13.9         10.0      10.0       9.1      1.1      1.1      1.0      3.7      3.9      4.1     11.8     -1.3    10.8     11.1     10.6      10.8
Div Financials (106)                      1,202,940         2.9 21.6         13.3      11.8       9.6      0.9      0.8      0.8      1.8      2.0      2.5 -17.4       14.6     21.8       6.6      7.2      8.3
Insurance (98)                            1,120,007         1.9 16.5         15.4      10.6       9.8      1.1      1.0      0.9      3.0      3.3      3.5      1.3    47.5       8.0      6.7      9.3      9.4
Real Estate (126)                            839,462        0.3 19.9         19.8      20.8     18.8       1.5      1.3      1.2      3.1      3.2      3.4      4.0     -2.6      8.5      7.5      6.3      6.7
Software (79)                             1,575,178         0.1 17.3         17.2      15.4     13.6       4.3      3.7      3.2      1.1      1.2      1.3     14.3    11.7     12.6     21.7     23.8      23.3
Tech Hard/Equip (94)                      1,378,568        -5.2 12.2         14.6      12.9     11.0       2.2      2.0      1.8      1.1      1.5      2.2    12.0     10.5     17.1     16.4     16.8     17.1
Semis (52)                                   602,030       -3.1     2.7      13.2      12.6     11.0       2.2      2.1      1.8      2.1      2.3      2.4 -12.2         3.3    18.5     16.6     16.5      16.3
Telecom (89)                              1,285,795        -1.3     5.7      12.8      12.7     11.8       1.9      1.8      1.7      4.9      4.6      5.1     -0.8     -0.1      9.2    14.3     13.8     14.3
Utilities (137)                           1,023,944         0.6     0.0      13.5      13.2     12.8       1.3      1.3      1.3      4.6      4.5      4.6 -21.7         8.3    15.7       9.0      9.3      9.9
World (2443)                             28,531,097         0.1     9.9      13.5      13.1     11.6       1.7      1.6      1.5      2.6      2.8      3.0      7.3      4.0    12.9     12.9     12.6      13.0
Source: Deutsche Bank, I/B/E/S, MSCI. Note: Data in the table are compiled based on MSCI AC World index universe. P/E, P/B, dividend yield, EPS growth and ROE are aggregated using I/B/E/S consensus estimates
(calendarized to December year end) with current prices. All numbers are free-float adjusted.


Figure 35: Equity market performance
   450                                                                                         450               500                                                                                       500
                                                                                                                                               MSCI AC World LC Index (LS)
   400             MSCI AC World LC Index (LS)                                                 400               450                                                                                       450
   350                                                                                         350               400                                                                                       400
   300                                                                                         300
                                                                                                                 350                                                                                       350
   250                                                                                         250
                                                                                                                 300                                                                                       300
   200                                                                                         200
   150                                                                                         150               250                                                                                       250
   100                                                                                         100               200                                                                                       200
    50                                                                                         50                150                                                                                       150
     0                                                                                         0                 100                                                                                       100
      1/73 1/76 1/79 1/82 1/85 1/88 1/91 1/94 1/97                                                                  1/00           1/02      1/04        1/06       1/08        1/10       1/12

Source: Deutsche Bank, MSCI


Deutsche Bank AG/Hong Kong                                                                                                                                                                            Page 25
17 October 2012
The Investigator


Asia – valuation
Asian valuations are moderately below historical averages. The problem is margins – in
China they seem to be in a secular decline, while in India they seem to be at a cyclical
low. The region cannot rely on asset turns and leverage – both at global levels – to
boost relative ROEs compared with the world. It is probably going to have to be EBIT
margin expansion that gets the PB up. We don’t see any substantial decline in the cost
of equity to boost PB multiples.

Figure 36: Composite valuation index                                                                     Figure 37: Price-to-book value
    3                                                                                      80%              4.0                                                              3.0
                                                                                                                                            Asia ex Japan P/BV (LS)
                                                                                           60%              3.5
    2                                                                                                                                       Rel to World (RS)                2.5
                                            Expensive                                      40%              3.0
    1                                                                                                                                                                        2.0
                                                                                           20%
                                                                                                            2.5
    0                                                                                      0%                                                                                1.5
                                                                                                            2.0
                                       Cheap                                               -20%
   -1                                                                                                                                                                        1.0
                       MSCI Asia ex Japan 12m fd rtn (RS)                                  -40%             1.5
   -2                                                                                                       1.0                                                              0.5
               Asia ex Japan Composite Valuation Index -60%
   -3          (S.D., LS)                              -80%                                                 0.5                                             0.0
     1/73 1/78 1/83 1/88 1/93 1/98 1/03 1/08 1/13                                                              1/73 1/78 1/83 1/88 1/93 1/98 1/03 1/08 1/13

Source: Deutsche Bank, IBES, MSCI. Note: Composite valuation index is the average of trailing P/E, 12m   Source: Deutsche Bank, MSCI, DataStream
forward P/E, P/Cash Earnings, P/BV, Dividend Yield, EV/EBITDA and EV/Sales, normalized over entire
history


Figure 38: 12m forward P/E                                                                               Figure 39: 12m trailing P/E
   25                                                                                          1.6         40                                                                2.0
                         Asia ex Japan 12m Forward P/E (LS)                                                                          Asia ex Japan Trailing P/E (LS)
   23                                                                                                                                                                        1.8
                         Rel to World (RS)                                                     1.4         35                        Rel to World (RS)
   21
                                                                                                           30                                                                1.6
   19                                                                                          1.2
   17                                                                                                                                                                        1.4
                                                                                                           25
   15                                                                                          1.0                                                                           1.2
   13                                                                                                      20
                                                                                                                                                                             1.0
   11                                                                                          0.8
                                                                                                           15                                                                0.8
    9                                                                                          0.6         10                                                                0.6
    7
    5                                                                                          0.4           5                                             0.4
     1/87             1/92           1/97            1/02           1/07            1/12                      1/73 1/78 1/83 1/88 1/93 1/98 1/03 1/08 1/13

Source: Deutsche Bank, MSCI, I/B/E/S                                                                     Source: Deutsche Bank, MSCI, DataStream


Figure 40: EV multiples                                                                                  Figure 41: ROE and EBIT margin
   18                                                                                          3.5         20%                                             16%
                              Asia ex Japan EV/EBITDA (LS)
                                                                                                           18%                                             15%
   16                         Asia ex Japan EV/SALES (RS)                                      3.0         16%                                             14%
   14                                                                                                      14%                                             13%
                                                                                               2.5
   12                                                                                                      12%                                             12%
                                                                                               2.0         10%                                             11%
   10                                                                                                       8%                                             10%
                                                                                               1.5          6%                                             9%
    8
                                                                                                            4%             Asia ex Japan ROE (LS)          8%
    6                                                                                          1.0
                                                                                                            2%             Asia ex Japan EBIT/Sales (RS)   7%
    4                                                                                          0.5          0%                                             6%
     1/87             1/92           1/97            1/02           1/07            1/12                      1/73 1/78 1/83 1/88 1/93 1/98 1/03 1/08 1/13

Source: Deutsche Bank, MSCI, FactSet                                                                     Source: Deutsche Bank, MSCI, FactSet


Page 26                                                                                                                                                  Deutsche Bank AG/Hong Kong
17 October 2012
The Investigator


Asia – investor sentiment

Risk-love in Asia is at neutral.

Figure 42: Asia Risk-Love indicator                                         Figure 43: China and Hong Kong Risk-Love indicator

   3.0                                                              100%       3.0                                                            3.0
                    MSCI AC Asia ex Jp 12m fd rtn (RS)                                                  China Risk-Love (SD)
                                                                    80%
   2.0              Asia ex Japan Risk-Love, SD                                2.0                      Hong Kong Risk-Love (SD)              2.0
                Euphoria                                            60%                     Euphoria
   1.0                                                              40%        1.0                                                            1.0
                                                                    20%
   0.0                                                              0%         0.0                                                            0.0
                                                                    -20%
   -1.0                                                             -40%       -1.0                                                           -1.0

   -2.0                                                             -60%       -2.0                                                           -2.0
                                          Panic                     -80%
   -3.0                                                             -100%      -3.0                                                  Panic    -3.0
       1/921/941/961/981/001/021/041/061/081/101/12                                1/00       1/02     1/04   1/06     1/08   1/10     1/12

Source: Deutsche Bank                                                       Source: Deutsche Bank


Figure 44: India and Indonesia Risk-Love indicator                          Figure 45: Korea and Malaysia Risk-Love indicator

   3.0                                                              3.0        3.0                                                            3.0
                             Indonesia Risk-Love (SD )                                                    Korea Risk-Love (SD)
   2.0                       India Risk-Love (SD)                   2.0        2.0                        Malaysia Risk-Love (SD)             2.0
                Euphoria                                                                    Euphoria
   1.0                                                              1.0        1.0                                                            1.0

   0.0                                                              0.0        0.0                                                            0.0

   -1.0                                                              -1.0      -1.0                                                           -1.0

   -2.0                                                              -2.0      -2.0                                                           -2.0

   -3.0                                                    Panic     -3.0      -3.0                                                  Panic    -3.0
       1/00       1/02     1/04   1/06   1/08       1/10     1/12                  1/00       1/02     1/04   1/06     1/08   1/10     1/12

Source: Deutsche Bank                                                       Source: Deutsche Bank


Figure 46: Philippines and Singapore Risk-Love indicator                    Figure 47: Taiwan and Thailand Risk-Love indicator

   3.0                                                              3.0        3.0                                                            3.0
                             Singapore Risk-Love (SD)                                                     Taiwan Risk-Love (SD)
   2.0                       Philippines Risk-Love (SD)             2.0        2.0                        Thailand Risk-Love (SD)             2.0
                Euphoria                                                                    Euphoria
   1.0                                                              1.0        1.0                                                            1.0

   0.0                                                              0.0        0.0                                                            0.0

   -1.0                                                              -1.0      -1.0                                                           -1.0

   -2.0                                                              -2.0      -2.0                                                           -2.0
                                                                                                                     Panic
   -3.0                                                    Panic     -3.0      -3.0                                                           -3.0
       1/00       1/02     1/04   1/06   1/08       1/10     1/12                  1/00       1/02     1/04   1/06     1/08   1/10     1/12

Source: Deutsche Bank                                                       Source: Deutsche Bank


Deutsche Bank AG/Hong Kong                                                                                                                    Page 27
17 October 2012
The Investigator


Asia – technicals

Technicals are improving – new highs are rising, and new lows have almost vanished.

Figure 48: Advance/decline ratio                                                 Figure 49: Percentage of stocks above their 200DMA

    2.0                                                                    2.0   100%                                                                                          100%
                                                                                                          50dma
    1.8                                                                    1.8
                                                                                                          % of stocks above their 200DMA
    1.6                  Bullish                                           1.6     80%                                                                                         80%
    1.4                                                                    1.4
    1.2                                                                    1.2     60%                                                                                         60%
    1.0                                                                    1.0
    0.8                                                                    0.8     40%                                                                                         40%
    0.6                                      10d Advancing                 0.6
                                             Issues/Declining Issues
    0.4                                                                    0.4     20%                                                                                         20%
                    Bearish                  25d Advancing
    0.2                                      Issues/Declining Issues       0.2
    0.0                                                                    0.0       0%                                                                                        0%
       1/06        1/07       1/08       1/09     1/10   1/11    1/12                  1/06           1/07       1/08       1/09       1/10        1/11       1/12
Source: Deutsche Bank, DataStream, FactSet                                       Source: Deutsche Bank, DataStream, FactSet


Figure 50: Relative Strength Index                                               Figure 51: Market breadth

     40                                                                    40     100%                                                                                        100%
                                                             22-day RSI
     30                                       Bullish                      30

     20                                                                    20       50%                                                                                       50%

     10                                                                    10
                                                                                      0%                                                                                      0%
      0                                                                    0
       1/06        1/07       1/08       1/09     1/10   1/11    1/12
    -10                                                                    -10
                                                                                   -50%                                                                                       -50%
    -20                                                                    -20
                                                                 Bearish                                      Market breadth
    -30                                                                    -30                                                            Asia ex-Japan
                                                                                 -100%                                                                                        -100%
                                                                                      1/06                     1/08                1/10            1/12
    -40                                                                    -40
Source: Deutsche Bank, DataStream, FactSet                                       Source: Deutsche Bank, DataStream, FactSet. Market breadth is defined as (# of sub-sectors up on 6
                                                                                 months basis minus # of sub-sectors down on 6 months basis) / total sub-sectors available.


Figure 52: Percentage of stocks at 52w Highs                                     Figure 53: Percentage of stocks at 52w Lows

30%                                                                        30%       50%                                                                                     50%
                                     % of stocks at 52W Highs                                                               % of stocks at 52W Lows
25%                                                                        25%
                                                                                     40%                                                                                     40%
20%                                                                        20%
                                                                                     30%                                                                                     30%
15%                                                                        15%
                                                  Bearish                            20%                                                           Bearish                   20%
10%                                                                        10%

  5%                                                                       5%        10%                                                                                     10%

  0%                                                                       0%          0%                                                                                    0%
    1/06          1/07       1/08        1/09     1/10    1/11    1/12                   1/06          1/07       1/08      1/09       1/10       1/11      1/12
Source: Deutsche Bank, DataStream, FactSet                                       Source: Deutsche Bank, DataStream, FactSet


Page 28                                                                                                                                 Deutsche Bank AG/Hong Kong
17 October 2012
The Investigator


Asia – growth and earnings
Asia’s leading economic indicators are bottoming, and policy is no longer being
tightened. Analysts have taken the knife to this year’s EPS growth forecasts from
around 13% at the start of the year to 5% now. We think that EPS revisions and
economic surprises are about bottoming now.

Figure 54: Leading economic and composite policy                                                                                                             Figure 55: Economic surprises
indicators
  30%                                                                                                                                     S.D. 1.2            40%                                                                 Asia ex-Japan
                                                              Easy Monetary/Fiscal                                                                                                                                                                                                                                        60
  25%                                                                Policy                                                                           0.8     30%
                                                                                                                                                                                                                                                                                                                          45
  20%                                                                                                                                                         20%                                                                                                                                                         30
                                                                                                                                                      0.4
                                                                                                                                                              10%                                                                                                                                                         15
  15%
                                                                                                                                                      0         0%                                                                                                                                                        0
  10%                                                                                                                                                                                                                                                                                                                     -15
                                                                                                                                                      -0.4   -10%
    5%                                                                                                                                                       -20%                                                                                                                                                         -30
                                           Tight Monetary/                                                                                            -0.8                                                                                                                                                                -45
    0%                                       Fiscal Policy                                                                                                   -30%
                                                                                                                                                                                                                                                                                                                          -60
   -5%      Asia Composite Leading Indicator* YoY% (LS) -1.2                                                                                                 -40%                                                                                                                                                         -75
            Asia Composite Policy Indicator** (S.D., RS)                                                                                                                       12m forward earnings revisions index, LS
 -10%                                                    -1.6                                                                                                -50%                                                                                                                                                         -90
                                                                                                                                                                               Economic Surprise Index, RS
     1/70 1/75 1/80 1/85 1/90 1/95 1/00 1/05 1/10                                                                                                            -60%                                                                                                                                                         -105
                                                                                                                                                                 1/03 1/04 1/05 1/06 1/07 1/08 1/09 1/10 1/11 1/12
Source: Deutsche Bank, CEIC, DataStream, Bloomberg Finance LP. Note: *Market cap weighted                                                                    Source: Deutsche Bank, Citigroup, Bloomberg Finance LP
average of composite leading economic indicators growth for China, India, Korea and Taiwan. **GDP
weighed average of composite policy indicators for China, HK, India, Indonesia, Korea, Malaysia,
Philippines, Spore, Taiwan & Thailand.


Figure 56: Earnings growth forecast (%)                                                                                                                      Figure 57: 12m forward growth forecast by sector

    25                                                                                                                                                25          30                                                  12m fwd EPS growth (%)                                                                              30
                                                                                                                   12/2011F
    23                                                                                                             12/2012F                           23                                                                                Latest                                      1m Ago
                                                                                                                                                                  24                                                                                                                                                      24
    21                                                                                                             12/2013F                           21
    19                                                                                                                                                19          18                                                                                                                                                      18
    17                                                                                                                                                17          12                                                                                                                                                      12
    15                                                                                                                                                15
                                                                                                                                                                    6                                                                                                                                                     6
    13                                                                                                                                                13
    11                                                                                                                                                11            0                                                                                                                                                     0
                                                                                                                                                                                                                                                               Materials
                                                                                                                                                                                                                    Health Care

                                                                                                                                                                                                                                   Cons Staples


                                                                                                                                                                                                                                                                                                    Financials
                                                                                                                                                                                                                                                                                         Telecom
                                                                                                                                                                                                                                                                           Industrials


                                                                                                                                                                                                                                                                                                                 Energy
                                                                                                                                                                                         Info Tech


                                                                                                                                                                                                                                                  Asia ex Jp
                                                                                                                                                                           Utilities


                                                                                                                                                                                                       Cons Disc


     9                                                                                                                                                9
     7                    MSCI AC World                                                                                                               7
     5                                                                                                                                                5
         1/09             7/09           1/10                 7/10         1/11 7/11 1/12 7/12

Source: Deutsche Bank, I/B/E/S, MSCI                                                                                                                         Source: Deutsche Bank, I/B/E/S, MSCI


Figure 58: 12m forward EPS revisions by sector                                                                                                               Figure 59: 12m forward EPS revisions by country

    30                                                                                                                                                30          0                                                                                                                                                       0
    15                                                                                                                                                15
     0                                                                                                                                                0         -20                                                                                                                                                       -20
   -15                                                                                                                                                -15
   -30                                                                                                                                                -30       -40                                                                                                                                                       -40
   -45                                                                                                                                                -45                                1m EPS revisions (%)
   -60                       1m EPS revisions (%)                                                                                                     -60       -60                                                                                                                                                       -60
   -75                                                                                                                                                -75
   -90                                                                                                                                                -90       -80                                                                                                                                                       -80
                                                                                                                                                                                                                                                               Taiwan
                                                                                                                                                                                                                                  Singapore
                                                                                                                                          Materials


                                                                                                                                                                                       Malaysia


                                                                                                                                                                                                                                                                           Asia Ex Jp
                                       Telecom


                                                                                                                                                                                                                                                                                         Thailand
            Health Care


                                                 Financials


                                                                                                    Cons Staples


                                                                                                                                                                                                                   Indonesia
                                                                                                                   Industrials
                                                               Info Tech

                                                                           Asia ex Jp


                                                                                                                                 Energy


                                                                                                                                                                                                                                                  India


                                                                                                                                                                                                                                                                                                                 China
                           Utilities


                                                                                                                                                                                                                                                                                                    Korea
                                                                                                                                                                                                     Philippines
                                                                                        Cons Disc


                                                                                                                                                                        Hong Kong


Source: Deutsche Bank, I/B/E/S, MSCI                                                                                                                         Source: Deutsche Bank, I/B/E/S, MSCI


Deutsche Bank AG/Hong Kong                                                                                                                                                                                                                                                                                                     Page 29
17 October 2012
The Investigator


Asia – liquidity
New issuance and secondaries have been paltry – a good positive contrarian indicator.
Foreign fund flows have resumed in earnest as markets have rallied.

Figure 60: M2/market cap                                                                  Figure 61: Free liquidity

      145%                                                                     145%         20%                                                                                       20%
                     Asia ex-Japan
      120%                                                                     120%
      95%                                                                      95%          10%                                                                                       10%

      70%                                                                      70%
                                                                                              0%                                                                                      0%
      45%                                                                      45%
      20%                                                                      20%
                                                                                           -10%                                                                                       -10%
       -5%                                                                     -5%                                    Aggregate Asia ex Japan (China, India,
      -30%                                                                     -30%                                   Korea & Taiwan) Narrow Money
                                                                                           -20%                                                                                       -20%
                                                                                                                      Growth less CPI Inflation less Leading
      -55%                           M2 / Market Cap, YoY%                     -55%
                                                                                                                      Economic Indicator Growth
      -80%                                                  -80%                           -30%                                                                                       -30%
          1/87 1/90 1/93 1/96 1/99 1/02 1/05 1/08 1/11 1/14                                        1/96 1/98 1/00 1/02 1/04 1/06 1/08 1/10 1/12
Source: Deutsche Bank, DataStream, Bloomberg Finance LP                                   Source: Deutsche Bank, DataStream, Bloomberg Finance LP


Figure 62: Asia-focused hedge fund exposure estimates                                     Figure 63: 6m total equity offerings* as percentage of
                                                                                          total market cap in Asia ex Japan
  100%                                                                         100%         1.0%    6m total IPOs & addl offerings as of Sep 2012                                   2.5%
                       Asia ex Japan Long Short Equities                                    0.9%    = U$38.6bn (excl China A); U$47.9bn (incl
                       Hedge Fund Exposure Proxy                                            0.8%    China A)                                                                        2.0%
      80%                                                                      80%
                                                                                            0.7%
                                                                         61%
                                                                                            0.6%                                                                                    1.5%
      60%                                                                      60%          0.5%
                                                                                            0.4%        6m total IPOs & additional offerings as                                     1.0%
      40%                                                                      40%          0.3%        % of M2 (excl A shs), LS
                                                                                            0.2%                                                                                    0.5%
                                                                                                        6m total IPOs & addl offerings as % of
      20%                                                                      20%          0.1%
                                                                                                        market cap (excl A shs), RS
            Based on 6 month rolling beta on MSCI AXJ returns                               0.0%                                                                                    0.0%
      0%                                                                       0%               1/99 1/01 1/03 1/05 1/07 1/09 1/11
            1/00     1/02       1/04          1/06    1/08   1/10       1/12
Source: Deutsche Bank, Bloomberg Finance LP                                               Source: Deutsche Bank, Bloomberg Finance LP, DataStream. Note: *Equity offerings includes IPO and
                                                                                          additional equity offerings of primary and secondary shares.


Figure 64: Foreign fund flows                                                             Figure 65: Foreign fund flows

  4                                                                                  4      4                       Korea                Taiwan                  Philippines                  4
                                                     Indonesia
  3                                                  India                           3
  2                                                  Thailand                        2      2                                                                                                 2
  1                                                                                  1
  0                                                                                  0
                                                                                            0                                                                                                 0
 -1                                                                                  -1
 -2                                                                                  -2
 -3                                       Deviation from 3-yr average                -3     -2                                                                                                -2
                                                                                                                                            3m net inflows (S.D.)
 -4                            3m net inflows (S.D.)                                 -4                                              Deviation from 3-yr average
 -5                                                                                  -5     -4                                                                                                -4
   1/05                 1/07                   1/09              1/11                         1/05                  1/07                  1/09                  1/11
Source: Deutsche Bank, Bloomberg Finance LP                                               Source: Deutsche Bank, Bloomberg Finance LP


Page 30                                                                                                                                         Deutsche Bank AG/Hong Kong
17 October 2012
The Investigator


Asia – factor performance
Value strategies and high profitability have done well this year, while high projected
growth stocks have been punished.

Figure 66: Best- and worst-performing factors (1-mth)                                                                                                                           Figure 67: Best- and worst-performing factors (YTD)
   2.5      %                                                                                                                                                                         8     %
   2.0
   1.5                                                                                                                                                                                4
   1.0
   0.5                                                                                                                                                                                0
   0.0
  -0.5        Best quintile vs market                                                                                                                                                          Best quintile vs market
  -1.0                                                                                                                                                                               -4
            1-mth performance spread                                                                                                                                                          YTD performance spread
  -1.5
  -2.0                                                                                                                                                                               -8
                                                                            Low P/Op Inc


                                                                                                                                                             High FY1 EPS Rev
            Low P/BV

                       Low Price/Sales


                                                                                                       High 6m Price


                                                                                                                       Low FY2 EPS Disp
                                                                                           Low P/FCF
                                         Low 12m Fd P/E


                                                                                                                                          High Price Up/Dn
                                                          High LT Gth Est


                                                                                                                                                                                                                                                                Low P/Op Inc
                                                                                                                                                                                                                                Low EV/Sales
                                                                                                                                                                                            Low Capex/Sales

                                                                                                                                                                                                              Low Price/Sales


                                                                                                                                                                                                                                                                               High 5yr Sales Gth


                                                                                                                                                                                                                                                                                                                                                           High 6m Price
                                                                                                                                                                                                                                               High Cash ROC,


                                                                                                                                                                                                                                                                                                                       High 3m chg in


                                                                                                                                                                                                                                                                                                                                        High 5yr EPS Gth
                                                                                                                                                                                                                                                                                                    High FY2 Gth Est


                                                                                                                                                                                                                                                                                                                         Price Mom
                                                                                                                                                                                                                                                   yoy chg
                                                                                                           Mom


                                                                                                                                                                                                                                                                                                                                                               Mom
                                                                                                                                                Days


 AXJ                                                                                                                                                                             AXJ

Source: Deutsche Bank                                                                                                                                                           Source: Deutsche Bank


Deutsche Bank AG/Hong Kong                                                                                                                                                                                                                                                                                                                                             Page 31
17 October 2012
The Investigator


Figure 68: Factor performance (sector neutral**)
                                                                     Bes t quint ile vs m a r ket r ela t ive per f or m a nc e (%)
As ia ex J a pa n                                      Returns                            Ann. Rtn.                                                             Returns                          Ann. Rtn.
S ep 30, 12                         YTD      1m       3m       6m     12m          5y     10y      15y                                        YTD      1m      3m       6m     12m          5y   10y     15y
                                              Valuation                                                                                                Profitability
Low 12m Fd P/E                       1.2      2.1     -0.1    -0.4      3.3       5.6      7.8      5.7 High Cash ROC                          3.2    -0.5     -0.1     0.3      3.7       6.0    4.4    6.8
Low Trailing P/E                     3.6      1.3     0.4      0.2      4.0       8.6      8.4      7.8 High Cash ROC, yoy chg                 4.6    -0.5     -0.2     2.1      6.4       3.5   3.3     3.6
Low P/Op Inc                         4.4      1.6     -0.2     1.8      6.3       7.6      8.0      6.8 High ROE                               4.1    -0.3      1.3     2.5      4.7       3.2    3.3    3.7
Low P/BV                            -1.4      2.2     0.0     -1.9     -0.7       3.0      3.6      1.1 High ROE, yoy chg                      3.1    -0.3      0.8     1.5      4.6       3.8   3.5     3.5
Low Price/Sales                      5.5      2.1     2.2      4.2      4.6       2.1      3.7      1.9 Aver a ge                             3.8 -0.4         0.5     1.6      4.8       4.1    3.6    4.4
Low P/FCF                            1.5     -1.2     0.4      2.8      1.7       3.9      3.0      5.3                                                  Growth
Low EV/EBIT                          4.3     -0.8     0.9      3.4      6.3       8.4      7.4      7.8 High 3yr Sales Gth                    -2.0     0.5     -1.0     -1.8    -0.2      -2.5   -1.7    -3.4
Low EV/EBITDA                        1.1     -0.1     0.9      1.4      3.0       7.0      6.3      7.6 High 5yr Sales Gth                    -2.5     0.6     -2.3     -4.0     0.1      -2.7   -0.9    -1.6
Low EV/Cap Emp                       0.3      1.2     2.0      0.7      2.6       3.5      3.3      2.3 High 3yr EPS Gth                       2.7    -0.8      0.4     1.5      3.5      -0.7    0.8    -1.2
Low EV/Sales                         5.5      0.6     1.3      3.6      6.7       6.0      5.5      5.9 High 5yr EPS Gth                      -3.7    -0.6     -1.5     -4.2    -2.9      -2.3   -0.6    -0.1
Low EV/Op CF                         2.4     -0.2     1.1      2.3      2.8       6.6      6.2      8.8 High LT Gth Est                        0.3     1.9     -0.3     -1.5    -0.2      -2.4    1.8    1.0
Low EV/FCF                           2.5     -0.9     0.8      2.6      2.9       4.5      3.5      6.3 High FY1 Gth Est                      -2.2     0.5     -0.5     -3.1    -0.3      -1.6    1.0    -1.2
High Dividend Yield                  3.4      1.1     2.0      3.4      2.4       8.2      7.4     10.0 High FY2 Gth Est                      -2.6     1.6     -2.1     -5.3    -1.0      -4.1   -0.1    -1.7
Aver a ge                           2.6     0.7      0.9      1.9      3.5       5.8      5.7      6.0     Aver a ge                         -1.4     0.5     -1.1     -2.6    -0.2      -2.3    0.0    -1.2
                                          Price Momentum                                                                                                 Stability
High 6m Price Mom                   -4.2     -1.3     -1.0     0.4     -8.5      -4.7     -0.3     -0.5 Low EPS Vola                           1.8     0.1      0.9     3.9      0.1       2.2    0.6    2.3
High 9m Price Mom                    0.3     -0.3     0.2      3.0     -3.0      -5.2      1.1      1.5 Low Op Inc Vola                        3.7     0.0      0.2     4.2      3.6       2.9    1.5    3.1
High 12m Price Mom                   1.9     -0.8     0.6      3.6     -1.1      -4.3      1.2      1.1 Low Book Value Vola                    0.4    -0.9     -0.1     0.7      0.7       0.3    0.7    0.6
High Price Rel Strg                 -0.4     -0.8     0.9      2.7     -2.0      -4.1      1.1      2.4 Low Sales Vola                         0.7    -0.7      0.1     0.8     -1.7      -0.8   -0.9    1.5
High 3m chg in Price Mom -2.8                -0.4     -2.1    -1.9     -7.3      -4.0      0.0     -1.3 Low EPS Est Vola                       3.6    -0.1      1.3     4.2      1.6       2.6   -1.8    0.7
High Price Up/Dn Days               -0.1     -1.5     -0.2     2.1     -2.0       0.7      1.8      1.7 Aver a ge                             2.1 -0.3         0.5     2.7      0.9       1.4    0.0    1.6
Aver a ge                          -0.9    -0.8     -0.3      1.7     -4.0      -3.6      0.8      0.8                                                       Risk
                                       Earnings Momentum                                                   Low FY1 EPS Disp                    1.1     0.0      1.6     3.3     -2.7       1.1    0.9    4.5
High FY1 EPS Mom                    -0.6     -0.5     -1.5     0.1      0.0      -0.1      3.0      1.4 Low FY2 EPS Disp                       2.8    -1.4      1.3     4.2     -0.6       0.7    0.5    3.3
High FY2 EPS Mom                     1.0      0.3     1.1      2.1      1.2       0.8      4.9      4.8 High EBIT/Int Exp                      3.2    -1.0      0.4     2.7      1.9       3.7   2.7     5.2
High 12m Fd EPS Mom                 -0.7     -0.7     0.2      0.5      0.0      -0.4      4.6      3.9 Low Debt/Equity                        0.8    -0.6      1.4     2.1      0.7       3.1    1.1    2.6
High FY1 EPS Rev                     2.3     -1.5     1.6      3.2      0.5       0.2      4.5      3.9 High Altman Z Score                    0.6    -0.8      1.2     1.5     -3.3      -1.0   -1.6    -0.7
High FY2 EPS Rev                     1.4     -0.8     2.0      3.2     -1.2       0.2      4.7      3.5 High Market Cap                       -2.3    -0.4     -0.9     -0.3    -0.3      -0.5    0.6    1.7
Aver a ge                           0.7    -0.7      0.7      1.8      0.1       0.1      4.3      3.5     Aver a ge                          1.0 -0.7         0.8     2.3     -0.7       1.2    0.7    2.8
                           Capex Deployment & Earnings Accruals                                                                                   Consensus Ratings
Low Capex/Depr                       3.4     -0.7     0.7      2.1      3.9       0.4     -1.5     -1.7 High Analyst Rec                       1.3    -0.2      0.0     0.9      2.3       2.7    3.3    6.9
Low Capex/Sales                      6.0     -0.3     3.5      5.9      5.0       4.3      2.1      1.8 High Analyst Rec 1m chg                2.2    -0.4      0.5     0.0      3.4       3.3    4.8    4.7
Low Capex/FA                         1.5      0.5     1.7      2.7      3.5      -2.7     -2.8     -3.7 Aver a ge                             1.7 -0.3         0.2     0.4      2.8       3.0    4.1    5.8
High Receivables yoy chg             0.9     -0.3     0.1      0.1      1.4       0.4      0.1      1.1
Low Inventory yoy chg               -1.0     -0.4     -0.6     0.6     -0.8      -0.7      0.6      1.9
Low Payables yoy chg                -2.0      0.4     0.5     -2.1     -1.4      -2.3     -1.9     -0.7
Aver a ge                           1.5    -0.1      1.0      1.6      1.9      -0.1     -0.6     -0.2
Source: Deutsche Bank, FactSet, I/B/E/S. Note: *1m, 3m, 6m, 12m, 5yr, 10yr and 15yr returns are as of month ended Sep 2012. **Quintile baskets are formed on a regional sector relative basis.
Relative performance is based on equal weighted average returns of the best quintile basket and the market. For description on factors please see appendix A.


Page 32                                                                                                                                                                Deutsche Bank AG/Hong Kong
17 October 2012
The Investigator


Asia – market intelligence

Figure 69: Equity market performance
       500                                                                                 220                     800                                                                                 170
                             MSCI Asia ex Japan LC Index (LS)                                                                             MSCI Asia ex Japan LC Index (LS)
       450                                                                                 200
                             Rel to World (RS)                                                                     700                    Rel to World (RS)                                            150
       400                                                                                 180
       350                                                                                 160                     600                                                                                 130
       300
                                                                                           140
       250                                                                                                         500                                                                                 110
                                                                                           120
       200
                                                                                           100                     400                                                                                 90
       150
       100                                                                                 80
                                                                                                                   300                                                                                 70
        50                                                                                 60
         0                                                                                 40                      200                                                                                 50
             1/73        1/78         1/83          1/88          1/93          1/98                                  1/00         1/02       1/04       1/06      1/08       1/10       1/12

Source: Deutsche Bank, MSCI.


Figure 70: Market intelligence by sector
11Oct12                                        Mcap         LC Perf                  P/E (x)          P/B (x)      Div Yld (%)        EPSg (%)        ROE (%)
Sector (#Co)                                    U$m         1m YTD          CY11      CY12 CY13 CY11 CY12 CY13 CY11 CY12 CY13 CY11 CY12 CY13 CY11 CY12 CY13
Energy (30)                                  193,608        4.5 4.1           9.4      10.3  9.4  1.6    1.5  1.4 3.3   3.1    3.3 18.7 -8.0 10.1 17.6 14.4 14.5
Materials (69)                               186,673        2.5      0.3     11.4      13.1      10.9      1.4      1.3      1.2      2.9      2.3      2.7 -10.3 -17.2           24.5     11.8     10.3        11.6
Capital Goods (79)                           203,519        1.3      8.3     11.2      11.8      10.5      1.4      1.3      1.2      2.4      2.5      2.6      9.2     -5.8     11.5     13.2     11.1        11.4
Comm Svc (1)                                    1,039       2.6 16.9         19.5      18.2      16.3      3.2      3.2      3.2      1.8      1.9      2.0      7.1      7.1     11.4     16.4     17.5        19.8
Transportation (32)                           51,603        3.6      5.5     17.5      19.1      14.2      1.3      1.2      1.1      2.7      2.6      2.9      nm      51.0     48.1      7.6      6.0         7.7
Autos (25)                                   133,869        2.8 10.3         12.7        8.7      7.8      2.2      1.8      1.5      1.0      1.4      1.5     -1.4     53.7     10.3     16.5     20.8        19.1
Cons Durables (12)                            20,901        0.8      4.5     31.9      12.9      10.6      2.7      1.5      1.3      2.1      2.6      2.9 -61.7 147.9           21.7      0.6     11.0        12.7
Cons Svc (13)                                 45,955       -0.4      5.2     17.6      16.4      14.3      3.0      2.6      2.3      2.5      2.4      2.7     22.1      7.1     15.1     15.6     14.7        14.9
Media (3)                                       8,871       4.8 20.6         20.7      19.4      18.1      3.9      3.8      3.7      4.4      4.5      4.8 -11.7         6.6      7.1     19.0     19.7        20.6
Retailing (18)                                39,949       -0.1 -10.4        15.7      14.9      12.5      2.1      1.9      1.7      2.7      2.5      2.9 -16.2         5.2     19.5     13.0     12.6        13.6
Food/Staples Retail (7)                       22,630        2.5      0.6     25.1      19.3      17.1      3.4      2.3      2.1      2.0      1.9      2.2     11.5     12.3     12.9     13.6     11.7        12.2
Food Beverage (29)                            95,862        3.6      7.9     20.1      19.6      16.6      2.8      2.5      2.3      2.1      2.2      2.5     -4.8      2.3     18.3     14.5     12.9        14.1
Household Products (8)                        32,998        2.0 26.8         40.8      31.3      26.4      6.6      5.1      4.6      1.3      1.5      1.8     12.9     30.4     18.5     23.4     26.8        21.4
Health Care Equip/Svc (4)                       8,037      10.1 37.0         30.4      27.9      23.1      2.8      2.3      2.1      0.9      0.7      0.9     21.5     22.1     20.8      9.2      8.1         9.0
Pharma & Biotech (10)                         18,318       -0.7 22.1         25.7      21.6      18.2      3.2      2.9      2.8      1.1      0.9      0.9     14.8     19.3     14.0     13.0     13.9        17.7
Banks (66)                                   483,438        5.1 11.7           9.3       8.9      8.4      1.4      1.3      1.1      3.4      3.7      3.9     23.9      8.4      3.3     15.3     14.8        13.8
Div Financials (24)                           63,029        6.2      7.8     14.6      15.2      14.1      1.7      1.7      1.5      2.8      2.7      2.9      2.5     -4.1      8.9     11.5     10.6        10.9
Insurance (14)                               114,962        6.0 14.3         20.0      16.1      14.0      2.0      1.8      1.6      1.3      1.4      1.7 -10.3        24.4     14.8     10.1     11.2        11.5
Real Estate (45)                             187,422        3.7 29.6         12.9      13.6      12.5      1.0      0.9      0.9      3.0      2.8      3.0     15.5     -4.9      9.1      8.0      7.1         7.1
Software (9)                                  86,665        0.0 19.0         24.6      20.7      17.4      6.7      5.4      4.3      0.9      1.0      1.1     21.9     18.8     18.8     27.3     26.0        24.7
Tech Hard/Equip (39)                         121,519       -3.5      0.3     16.2      13.2      10.8      1.4      1.4      1.3      2.7      2.8      3.4 -46.7        35.8     41.0     12.0     11.3        13.0
Semis (24)                                   268,958        1.7 15.7         16.4      11.6       9.6      2.0      2.0      1.7      1.8      1.9      2.0 -30.2        41.3     21.5     12.5     16.9        17.6
Telecom (26)                                 178,368        2.0 10.1         14.8      14.4      13.3      2.2      2.0      1.9      3.9      4.1      4.3      1.2      2.7      8.1     14.7     13.8        13.9
Utilities (29)                               102,839        4.0 14.3         17.8      15.2      13.9      2.1      1.9      1.7      2.3      2.6      2.9 -21.4        43.9     26.3      5.6      8.2         9.9
Asia ex Japan (616)                       2,671,032         2.8      9.9     13.1      12.2      10.9      1.7      1.5      1.4      2.6      2.7      2.9     -1.4      9.7     13.0     12.4     12.8        12.9
Source: Deutsche Bank, I/B/E/S, MSCI. Note: Data in the table are compiled based on MSCI AC Asia ex Japan index universe. P/E, P/B, dividend yield, EPS growth and ROE are aggregated using I/B/E/S consensus
estimates (calendarized to December year end) with current prices. All numbers are free-float adjusted.


Figure 71: Market Expected Return Indicator for Asia ex-Japan
   8                                                                             Market Expected Return Indicator, LS                                                                                           800
   6                   Asia ex-Japan
                                                                                 MSCI AXJ , RS                                                                                                                  700
   4                                                                                                                                                                                                            600
   2                                            Bullish
                                                                                                                                                                                                                500
   0
                                                                                                                                                                                                                400
  -2
  -4                                                                                                                                                                                                            300

  -6                                       Bearish                                                                                                                                                              200
  -8                                                                                                                                                                                                            100
       1/92 1/93 1/94 1/95 1/96 1/97 1/98 1/99 1/00 1/01 1/02 1/03 1/04 1/05 1/06 1/07 1/08 1/09 1/10 1/11 1/12
Source: Deutsche Bank, MSCI, Bloomberg Finance LP


Deutsche Bank AG/Hong Kong                                                                                                                                                                             Page 33
17 October 2012
The Investigator


 Japan – valuations
Japanese stocks continue to look undervalued versus history. A return to credible
inflation and higher nominal GDP growth globally is required to unlock value. Recent
tensions with China are unhelpful for risk assets in Japan.

Figure 72: Composite valuation index                                                                     Figure 73: Price-to-book value

    3                                                                                        60%            6.0                                                                                         2.5
                      MSCI Japan 12m fd rtn (RS)                                                                                                                      Japan P/BV (LS)
    2                 Japan Composite Valuation Index (S.D., LS)                             40%            5.0                                                       Rel to World (RS)                 2.0
                  Expensive
    1                                                                                        20%            4.0
                                                                                                                                                                                                        1.5
    0                                                                                        0%             3.0
                                                                                                                                                                                                        1.0
   -1                                                                                        -20%           2.0
                                       Cheap                                                                                                                                                            0.5
   -2                                                                                        -40%           1.0

   -3                                                                                        -60%           0.0                                             0.0
     1/73        1/79        1/85        1/91        1/97        1/03        1/09                              1/73 1/78 1/83 1/88 1/93 1/98 1/03 1/08 1/13

Source: Deutsche Bank, IBES, MSCI. Note: Composite valuation index is the average of trailing P/E, 12m   Source: Deutsche Bank, MSCI, DataStream. Note: Market relative = relative to MSCI AC Asia ex Japan.
forward P/E, P/Cash Earnings, P/BV, Dividend Yield, EV/EBITDA and EV/Sales, normalized over entire
history.


Figure 74: 12m forward P/E                                                                               Figure 75: 12m trailing earnings yield

   85                                                                                              4.1      10                                                                                          1.2
                                                Japan 12m Forward P/E (LS)                                                         Japan Trailing Earnings Yield (LS, %)
   75                                                                                                        9
                                                Rel to World (RS)                                  3.6                             Rel to World (RS)                                                    1.0
                                                                                                             8
   65                                                                                              3.1       7                                                                                          0.8
   55                                                                                                        6
                                                                                                   2.6
   45                                                                                                        5                                                                                          0.6
                                                                                                   2.1       4
   35
                                                                                                             3                                                                                          0.4
   25                                                                                              1.6
                                                                                                             2                                                                                          0.2
   15                                                                                              1.1
                                                                                                             1
     5                                                                                             0.6       0                                                                                          0.0
      1/87            1/92             1/97           1/02           1/07            1/12                     1/73        1/78      1/83      1/88      1/93      1/98      1/03      1/08      1/13

Source: Deutsche Bank, MSCI, I/B/E/S. Note: Market relative = relative to MSCI AC Asia ex Japan.         Source: Deutsche Bank, MSCI, DataStream. Note: Market relative = relative to MSCI AC Asia ex Japan.


Figure 76: EV multiples                                                                                  Figure 77: ROE and EBIT margin

                                                                                                   1.7      14%                                             9%
   19                                Japan EV/EBITDA (LS)
                                                                                                            12%                                             8%
                                     Japan EV/SALES (RS)                                           1.5
   17                                                                                                       10%                                             7%
   15                                                                                              1.3       8%                                             6%
                                                                                                             6%
   13                                                                                                                                                       5%
                                                                                                   1.1       4%
                                                                                                                                                            4%
   11                                                                                                        2%
                                                                                                   0.9       0%                                             3%
     9
                                                                                                            -2%               Japan ROE (LS)                2%
     7                                                                                             0.7
                                                                                                            -4%               Japan EBIT/Sales (RS)         1%
     5                                                                                             0.5      -6%                                             0%
      1/87            1/92             1/97           1/02           1/07            1/12                      1/73 1/78 1/83 1/88 1/93 1/98 1/03 1/08 1/13

Source: Deutsche Bank, MSCI, FactSet                                                                     Source: Deutsche Bank, MSCI, FactSet


Page 34                                                                                                                                                        Deutsche Bank AG/Hong Kong
17 October 2012
The Investigator


Japan – investor sentiment

Sentiment is at neutral levels.

Figure 78: Equity Risk-Love indicator                                                   Figure 79: Market volatility (inverted scale)

   1.5                           TOPIX 6m fwd rtn (RS)                           30%      0.6                                                                             0.6
                                                                                                               Nikkei 225 Options Put/Call Volume Ratio
                                 JP Risk-Love, SD (LS)                                                         (4w Rolling, Inverted Scale)
   1.0                                                                           20%      0.8                                                                             0.8
                 Euphoria
   0.5                                                                           10%         1                                     Euphoria                               1

   0.0                                                                           0%       1.2                                                                             1.2

   -0.5                                                                          -10%     1.4                                                                             1.4
                                                                                                                    Panic
   -1.0                                                                          -20%     1.6                                                                             1.6
                                                        Panic
   -1.5                                                                          -30%     1.8                                                                             1.8
       1/00        1/02       1/04       1/06       1/08        1/10   1/12                  1/04 1/05 1/06 1/07 1/08 1/09 1/10 1/11 1/12 1/13

Source: Deutsche Bank, Bloomberg Finance LP                                             Source: Deutsche Bank, DataStream


Figure 80: Asset allocation to stocks for publicly offered                              Figure 81: Percentage premium to NAV of closed-end
investment trusts of contractual type                                                   equity funds
   35                % of assets in stocks for publicly offered                   35        20                                                                            30
                                                                                                       % premium to NAV of closed-end equity funds
                     investment trusts of contractual type (%)                              15                                                                            25
   30                12m mov avg                                                  30                                                                                      20
                                                                                            10
                                                                                                                                                                          15
                                                                                              5                                                     Euphoria
   25                                                                             25                                                                                      10
                   Euphoria
                                                                                              0                                                                           5
   20                                                                             20         -5                                                                           0
                                                                                                                                                                          -5
                                                                                           -10                          Panic
   15                                                                             15                                                                                      -10
                                     Panic                                                 -15             Japan Equity Fund (RS)                                         -15
   10                                                  10                                  -20             Japan Smaller Capitalization Fund (LS)                         -20
     1/95 1/97 1/99 1/01 1/03 1/05 1/07 1/09 1/11 1/13                                        1/04 1/05 1/06 1/07 1/08 1/09 1/10 1/11 1/12 1/13

Source: Deutsche Bank, SENTIX Capital Markets Survey.                                   Source: Deutsche Bank, Cabinet Office, Shoko Chukin Bank.


Figure 82: Market volatility                                                            Figure 83: Margin ratio

                                                                                           8.0                                                                            8.0
     0                                                                            0                            Tokyo Stock Exchange Long/Short Margin
             S.D.                             Euphoria                    S.D.             7.0                                                                            7.0
   0.5                                                                            0.5                          Ratio
     1                                                                            1        6.0                                                                            6.0
   1.5                                                                            1.5      5.0                                            Euphoria                        5.0
     2                                                                            2        4.0                                                                            4.0
   2.5                                                                            2.5      3.0                                                                            3.0
     3                                                                            3        2.0                                                                            2.0
                              Panic
   3.5                                                                            3.5
                                    Nikkei 225 100-Day Price Volatility                    1.0                                                      Panic                 1.0
     4                                                                            4
                                    (Inverted Scale)                                       0.0                                                                            0.0
   4.5                                                  4.5
                                                                                              1/95          1/98        1/01           1/04         1/07    1/10   1/13
      1/95 1/97 1/99 1/01 1/03 1/05 1/07 1/09 1/11 1/13

Source: Deutsche Bank, DataStream                                                       Source: Deutsche Bank, Tokyo Stock Exchange.


Deutsche Bank AG/Hong Kong                                                                                                                                            Page 35
17 October 2012
The Investigator


Japan – technicals

Technicals are mixed.

Figure 84: Advance/decline ratio                                                          Figure 85: Percentage of stocks above their 200dma

2.0                                                                                 2.0   100%                                                                                          100%
                          10d Advancing Issues/Declining Issues                                                 % of stocks above their 200dma
1.8                                                                                 1.8
1.6                       25d Advancing Issues/Declining Issues                     1.6     80%                                                                                         80%
1.4                                          Bullish                                1.4
1.2                                                                                 1.2     60%                                                                                         60%
1.0                                                                                 1.0
0.8                                                                                 0.8     40%                                                                                         40%
0.6                                                                                 0.6
0.4                                                                                 0.4     20%                                                                                         20%
0.2                        Bearish                                                  0.2
0.0                                                                                 0.0
                                                                                              0%                                                                                        0%
   1/06          1/07       1/08        1/09           1/10     1/11    1/12
                                                                                                1/06           1/07       1/08       1/09       1/10        1/11       1/12
Source: Deutsche Bank, DataStream, FactSet                                                Source: Deutsche Bank, DataStream, FactSet


Figure 86: Relative Strength Index                                                        Figure 87: Market breadth

 40                                                                                 40         100%                                                                                100%
                                               22-day RSI                                                        Japan
 30                                                                                 30           75%                                                                               75%
                                                              Bullish
 20                                                                                 20           50%                                                                               50%

 10                                                                                 10           25%                                                                               25%
                                                                                                   0%                                                                              0%
  0                                                                                 0
   1/06          1/07       1/08        1/09           1/10     1/11    1/12                    -25%                                                                               -25%
-10                                                                                 -10
                                                                                                -50%                                                                               -50%
-20                                                                                 -20
                                                                                                -75%                                                                               -75%
-30                  Bearish                                                        -30                                     Market breadth
                                                                                               -100%                                                                               -100%
                                                                                                    1/06 1/07 1/08 1/09 1/10 1/11 1/12 1/13
-40                                                                                 -40
Source: Deutsche Bank, DataStream, FactSet                                                Source: Deutsche Bank, DataStream, FactSet. Market breadth is defined as (# of sub-sectors up on 6
                                                                                          months basis minus # of sub-sectors down on 6 months basis) / total sub-sectors available.


Figure 88: Percentage of stocks at 52w Highs                                              Figure 89: Percentage of stocks at 52w Lows

                                                                                              30%                                                                                     30%
    14%                           % of stocks at their 52W Highs               14%
                                                                                              25%                        % of stocks at their 52W Lows                                25%
    12%                                                                        12%
    10%                                                                        10%            20%                                                                                     20%
      8%                                                                       8%             15%                                                                                     15%
      6%                                 Bearish                               6%
                                                                                              10%                                                                                     10%
      4%                                                                       4%
      2%                                                                       2%               5%                                                                                    5%

      0%                                                                       0%               0%                                                                                    0%
        1/06 1/07 1/08 1/09 1/10 1/11 1/12 1/13                                                   1/06 1/07 1/08 1/09 1/10 1/11 1/12 1/13
Source: Deutsche Bank, DataStream, FactSet                                                Source: Deutsche Bank, DataStream, FactSet


Page 36                                                                                                                                          Deutsche Bank AG/Hong Kong
17 October 2012
The Investigator


Japan – growth and earnings

Economic surprises are nasty and mean-reverting. They are probably going to get less
bad. EPS revisions continue to slide.

Figure 90: Leading economic indicators                                                                                                                     Figure 91: Earnings revisions and economic surprises

 15%                                                                                                                                                  55    40%                                                                             Japan                                                    100

 10%                                                                                                                                                  50    20%
                                                                                                                                                                                                                                                                                                     50
   5%                                                                                                                                                 45      0%
                                                                                                                                                                                                                                                                                                     0
   0%                                                                                                                                                 40   -20%
                                                                                                                                                                                                                                                                                                     -50
  -5%                                                                                                                                                 35   -40%
                             OECD Japan Leading Economic Indicator
-10%                         (LS, YoY%) - Aug 2012                                                                                                    30                                 12m forward earnings revisions index, LS                                                                    -100
                                                                                                                                                           -60%
                             Small & Med Enterprise Survey Expectation                                                                                                                   Economic surprise index, RS
-15%                         Index (RS) - Sep 2012                                                                                                    25   -80%                                                       -150
    1/90                 1/93 1/96 1/99 1/02 1/05 1/08 1/11                                                                                                    1/03 1/04 1/05 1/06 1/07 1/08 1/09 1/10 1/11 1/12 1/13
Source: Deutsche Bank, OECD, DataStream                                                                                                                    Source: Citigroup, I/B/E/S, Factset


Figure 92: Composite policy indicator                                                                                                                      Figure 93: Earnings growth forecast (%)

                                                                                                                                                             100                                                                                                                                         100
    1.0      S.D.                                                                                                                   S.D.         1.0
                                          Easy Monetary/Fiscal Policy
                                                                                                                                                               80                                                                                                                                        80
    0.5                                                                                                                                          0.5
                                                                                                                                                               60                                                                                                                                        60
    0.0                                                                                                                                          0.0           40                             03/2012F                                                                                                   40
                                                                                                                                                                                              03/2013F
                                                                                                                                                               20                                                                                                                                        20
   -0.5                                                                                                                                          -0.5
                                                                                                                                                                                              03/2014F
                                                                                                                                                                 0                                                                                                                                       0
   -1.0                                                                                                                                          -1.0
                                                                                                                                                             -20                                                                                                                                         -20
               Tight Monetary/Fiscal Policy Japan                                                                                                                              MSCI Japan
   -1.5                                             -1.5                                                                                                     -40                                                                                                                                         -40
       1/81 1/85 1/89 1/93 1/97 1/01 1/05 1/09 1/13                                                                                                                  1/09         7/09            1/10       7/10               1/11              7/11             1/12                 7/12

Source: Deutsche Bank, CEIC, DataStream, Bloomberg Finance LP, IMF. Note: Composite policy indicator                                                       Source: Deutsche Bank, MSCI, I/B/E/S
is a normalized average of real effective exchange rate yoy growth, real broad money (M2) y-o-y growth,
short term real interest rate and government fiscal deficit/surplus as a % of GDP.


Figure 94: 12m forward EPS revisions by sector                                                                                                             Figure 95: 12m forward EPS growth forecast by sector

    40                                                                                                                                           40            180                                 12m fwd EPS growth (%)                                                                           180
    20                                                                   1m EPS revisions (%)                                                    20            150                                                                                                    Latest                        150
     0                                                                                                                                           0             120                                                                                                    1m Ago                        120
                                                                                                                                                                90                                                                                                                                  90
   -20                                                                                                                                           -20
                                                                                                                                                                60                                                                                                                                  60
   -40                                                                                                                                           -40            30                                                                                                                                  30
   -60                                                                                                                                           -60             0                                                                                                                                  0
   -80                                                                                                                                           -80           -30                                                                                                                                  -30
                                                                          Japan


                                                                                                                                                                                                  Japan
                                                                                                                                     Materials


                                                                                                                                                                                      Materials
            Financials


                                                                                              Cons Staples
                         Health Care


                                                   Telecom


                                                                                                                                                                                                                      Health Care


                                                                                                                                                                                                                                                                 Telecom
                                                                                                             Industrials


                                                                                                                                                                                                                                                  Cons Staples


                                                                                                                                                                                                                                                                           Financials
                                                                                                                                                                                                                                    Industrials
                                                                                  Info Tech


                                                                                                                           Energy


                                                                                                                                                                                                          Info Tech


                                                                                                                                                                                                                                                                                          Energy
                                                             Utilities
                                       Cons Disc


                                                                                                                                                                          Cons Disc


Source: Deutsche Bank, MSCI, I/B/E/S. Note: EPS revisions = number of upward less downward revisions                                                       Source: Deutsche Bank, MSCI, I/B/E/S
as % of total number of revisions in one month.


Deutsche Bank AG/Hong Kong                                                                                                                                                                                                                                                                         Page 37
17 October 2012
The Investigator


Japan – liquidity
Fund flows are weak and the market continues to underperform the world as US 10-
year bond yields remain suppressed.

Figure 96: M2/market cap                                                               Figure 97: Free liquidity

   100%                                                                    100%          40%                                                                                        40%
                       Japan                                                                             Japan Narrow Money Growth less CPI
       80%                                                                 80%           35%             Inflation less Leading Economic Indicator                                  35%
       60%                                                                 60%           30%                                                                                        30%
       40%                                                                 40%           25%                                                                                        25%
       20%                                                                 20%           20%                                                                                        20%
       0%                                                                  0%            15%                                                                                        15%
   -20%                                                                    -20%          10%                                                                                        10%
   -40%                                                                    -40%           5%                                                                                        5%
   -60%                                                                    -60%           0%                                                                                        0%
                                    M2 / Market Cap, YoY%
                                                                                         -5%                                                                                        -5%
   -80%                                             -80%
       1/73 1/78 1/83 1/88 1/93 1/98 1/03 1/08 1/13                                     -10%                                                                                        -10%
                                                                                            1/85          1/89       1/93       1/97       1/01      1/05       1/09       1/13
Source: Deutsche Bank, DataStream                                                      Source: Deutsche Bank, DataStream


Figure 98: Foreign fund flows into equities                                            Figure 99: IPOs and additional equity offerings (6m
                                                                                       rolling) as % of total market cap
  4                                                                               4      1.8%                                                                                    1.8%
                                               3m net inflows (S.D.)                            6m total IPOs & addl offerings as of Jul 12* =
  3                                                                               3      1.6% U$9.5bn                                                                            1.6%
                                                                                         1.4%                                                                                    1.4%
  2                                                                               2                6m total IPOs & addl offerings as % of
                                                                                         1.2%                                                                                    1.2%
  1                                                                               1                total market cap, Japan
                                                                                         1.0%                                                                                    1.0%
   0                                                                              0      0.8%                                                                                    0.8%
    1/03             1/05             1/07           1/09          1/11                  0.6%                                                                                    0.6%
  -1                                                                              -1
                                                                                         0.4%                                                                                    0.4%
  -2                                                                              -2     0.2%                                                                                    0.2%
  -3               Japan                                                          -3     0.0%                                                                                    0.0%
                                           Deviation from 1-yr average
                                                                                             1/99 1/01 1/03 1/05 1/07 1/09 1/11
  -4                                                                              -4

Source: Deutsche Bank, Bloomberg Finance LP                                            Source: Deutsche Bank, Bloomberg Finance LP, DataStream. Note: *Equity offerings includes IPO and
                                                                                       additional equity offerings of primary and secondary shares.


Figure 100: US 10-year bond yield and Nikkei 225                                       Figure 101: Japan yield curve

10.2      %                            US 10Yr Bond Yield, LS               35000      3.5                                                                                            110
                                                                                                                            Japan yield curve (10yr yield                             100
  9.2
                                       Nikkei 225, RS                       30000      3.0                                  less 3m yield), LS
  8.2                                                                                                                                                                                 90
  7.2                                                                       25000      2.5                                  Topix banks/ Topix Index, RS                              80
  6.2                                                                                                                                                                                 70
                                                                            20000      2.0
  5.2                                                                                                                                                                                 60
  4.2                                                                       15000      1.5                                                                                            50
  3.2                                                                                                                                                                                 40
                                                                            10000      1.0
  2.2                                                                                                                                                                                 30
  1.2                                                                       5000       0.5                                                                                            20
     1/90       1/93     1/96       1/99      1/02   1/05   1/08    1/11                  1/94               1/98              1/02             1/06             1/10
Source: Deutsche Bank, DataStream                                                      Source: Deutsche Bank, DataStream


Page 38                                                                                                                                      Deutsche Bank AG/Hong Kong
17 October 2012
The Investigator


Japan – factor performance
Value remains the long-term winner.
Figure 102: Best- and worst-performing factors (1-mth)                                                                                                                                                 Figure 103: Best- and worst-performing factors (YTD)
   2.0       %                                                                                                     Best quintile vs market                                                                 12      %                                                                                Best quintile vs market
   1.5                                                                                                           1-mth performance spread                                                                   8                                                                                      YTD performance spread
   1.0
                                                                                                                                                                                                            4
   0.5
   0.0                                                                                                                                                                                                      0
  -0.5                                                                                                                                                                                                     -4
  -1.0                                                                                                                                                                                                     -8
  -1.5                                                                                                                                                                                                    -12
             Low Capex/Depr

                              High FY2 EPS Rev

                                                   High 5yr Sales Gth


                                                                                                                                        Low Capex/Sales
                                                                                            Low P/BV


                                                                                                                                                                             Low Price/Sales
                                                                         Low EV/Cap Emp


                                                                                                        High Cash ROC
                                                                                                                        High FY2 EPS


                                                                                                                                                          High Price Up/Dn


                                                                                                                                                                                                                     High 12m Price


                                                                                                                                                                                                                                      Low Capex/Depr


                                                                                                                                                                                                                                                                                   Low Capex/FA

                                                                                                                                                                                                                                                                                                       High 5yr EPS Gth


                                                                                                                                                                                                                                                                                                                                                                Low Price/Sales
                                                                                                                                                                                                                   High Receivables


                                                                                                                                                                                                                                                          Low EPS Est Vola
                                                                                                                                                                                                                      High Altman Z


                                                                                                                                                                                                                                                                                                                           High FY2 EPS


                                                                                                                                                                                                                                                                                                                                           High FY2 Gth Est
                                                                                                                            Mom


                                                                                                                                                                                                                                                                                                                               Mom
                                                                                                                                                                                                                          Score
                                                                                                                                                                                                                        yoy chg

                                                                                                                                                                                                                          Mom
  JP                                                                                                                                                            Days                                     JP

Source: Deutsche Bank                                                                                                                                                                                  Source: Deutsche Bank


Figure 104: Factor performance (sector neutral**)
                                                                                                                                Bes t quint ile vs m a r ket r ela t ive per f or m a nc e (%)
J a pa n                                                                                                Returns                                                                 Ann. Rtn.                                                                                    Returns                                                                          Ann. Rtn.
S ep 30, 12                                                             YTD                1m          3m                6m        12m                            5y              10y           15y                              YTD               1m                    3m                       6m              12m                     5y                   10y                 15y
                                                                                            Valuation                                                                                                                                                  Profitability
Low 12m Fd P/E                                                          -1.9               -0.5        -2.2             -3.1           -1.0                    -1.6                  3.0        5.5 High Cash ROC                 3.9 -0.8                                   2.1                  6.3                     5.4             1.3                  1.9                 2.5
Low Trailing P/E                                                        0.8                0.2         1.0               0.7            2.4                      2.5                 4.4        7.4 High Cash ROC, yoy chg        3.1              0.1                       0.5                  3.3                     6.3             2.1                  3.1                 2.4
Low P/Op Inc                                                            -1.2               0.4         -1.7             -2.2            0.3                      4.1                 6.4        6.4 High ROE                      6.3 -0.4                                   4.1                  7.1                     7.9         -1.1                     0.2                 1.7
Low P/BV                                                                -3.2               1.0         -1.7             -4.5           -2.7                     6.7                  4.9        6.2 High ROE, yoy chg             2.9 -0.1                                   1.0                  2.2                     6.1         -1.5                     0.9                 2.0
Low Price/Sales                                                         -7.5               -1.1        -9.1             -8.0           -5.7                     2.3                  2.5        3.6 Aver a ge                    4.1 ###                             1.9                    4.7                     6.4              0.2                      1.5                 2.2
Low P/FCF                                                               2.1                0.3         -1.1              1.1            3.8                     5.1                  5.9        7.2                                                      Growth
Low EV/EBIT                                                             6.4                0.4         6.3               6.6            5.4                      3.3                 4.3        6.1 High 3yr Sales Gth           -0.3 -0.4                                   3.9                  3.5                 -2.2            -3.5                     -0.3                -0.6
Low EV/EBITDA                                                           6.9                0.5         4.6               5.6            5.9                      6.0                 6.0        5.2 High 5yr Sales Gth            1.6              1.1                       5.2                  4.7                     0.9         -2.0                     -0.4                0.1
Low EV/Cap Emp                                                          0.7                1.0         1.5              -0.7            0.8                      6.2                 4.1        5.5 High 3yr EPS Gth             -2.7 -0.5                             -2.1                       0.1                 -4.0            -2.6                     0.3                 1.2
Low EV/Sales                                                            4.7                0.0         0.8               3.4            3.9                     5.5                  3.5        4.1 High 5yr EPS Gth             -3.3 -0.4                             -0.4                   -1.1                    -4.1            -1.4                     -0.1                0.6
Low EV/Op CF                                                            4.4                0.6         4.2               4.0            4.5                      7.4                 6.4        7.0 High LT Gth Est               1.8 -0.8                             -0.4                       1.0                     1.1             0.3                  1.0                 0.2
Low EV/FCF                                                              4.6                -0.4        3.5               3.7            5.0                     4.5                  5.1        6.2 High FY1 Gth Est             -0.2 -0.2                             -1.8                       0.9                     0.4         -3.6                     -0.2                0.0
High Dividend Yield                                                     -0.9               0.2         -1.3             -2.4           -1.0                      6.2                 6.5        7.7 High FY2 Gth Est             -5.6              0.1                 -7.3                   -6.9                    -5.2            -0.8                     1.4                 0.6
Aver a ge                                                               1.2               0.2          0.4              0.3            1.7                    4.5               4.8            6.0     Aver a ge                -1.2 ###                         -0.4                       0.3                 -1.9                -2.0                      0.2                 0.3
                                                                                 Price Momentum                                                                                                                                                         Stability
High 6m Price Mom                                                       5.1                -0.6        2.9               6.9            1.9                    -6.0               -1.8          -1.2 Low EPS Vola                 1.2              0.1                       3.0                  4.2                     0.6             0.8                  -0.4                -0.9
High 9m Price Mom                                                       7.0                0.5         5.1               9.3            4.0                    -5.8               -1.8          -0.8 Low Op Inc Vola              4.8              1.0                       5.5                  6.8                     4.7             2.7                  -0.4                0.8
High 12m Price Mom                                                      8.1                0.3         6.2              10.8            6.6                    -4.4                  0.0        -0.1 Low Book Value Vola          3.8              0.9                       3.6                  3.3                     2.7             3.7                  0.3                 -0.1
High Price Rel Strg                                                     6.8                0.4         4.7               9.2            4.3                    -6.0               -0.9          0.4 Low Sales Vola               -2.1 -0.3                             -1.2                   -0.1                    -3.9                0.4                  -1.6                -0.6
High 3m chg in Price Mom                                                7.1                0.0         3.4               6.4            4.1                    -1.2                  0.8        1.0 Low EPS Est Vola              7.3              0.8                       6.3                  9.3                     4.9             1.0                  -0.5                0.5
High Price Up/Dn Days                                                   -1.3               -0.9        -0.1              0.3           -2.4                    -3.4               -1.1          -0.9 Aver a ge                   3.0 0.5                             3.4                    4.7                     1.8              1.7                      -0.5                -0.1
Aver a ge                                                               5.5               -0.1         3.7              7.2            3.1                  -4.5             -0.8              -0.2                                                        Risk
                                                                         Earnings Momentum                                                                                                             Low FY1 EPS Disp           1.9              0.9                       3.7                  4.4                 -0.1            -0.3                     -0.9                -0.2
High FY1 EPS Mom                                                        1.1                0.5         0.4               1.0            0.0                    -4.6               -0.7          1.8 Low FY2 EPS Disp             -0.9              0.2                       2.8                  2.1                 -3.4            -2.9                     -2.9                -0.7
High FY2 EPS Mom                                                        -4.6               -0.9        -5.7             -4.3           -6.5                    -5.4               -0.4          -0.1 High EBIT/Int Exp            6.9              0.6                       6.8                  8.1                     5.7             1.5                  -0.6                0.5
High 12m Fd EPS Mom                                                     1.1                0.3         0.3               1.3            0.5                    -3.5                  0.4        2.2 Low Debt/Equity               5.7              0.6                       7.6                  7.4                     4.0             2.7                  -0.7                1.5
High FY1 EPS Rev                                                        4.2                -0.3        3.9               6.1            1.6                    -3.9                  0.7        3.5 High Altman Z Score           7.9              0.4                       8.0                  9.4                     5.6             0.3                  -1.0                -1.0
High FY2 EPS Rev                                                        4.4                1.2         2.6               6.6            1.0                    -3.8                  2.5        2.6 High Market Cap               3.6              0.2                       2.5                  2.5                     5.4         -2.5                     -1.7                -2.2
Aver a ge                                                               1.2               0.2          0.3              2.1        -0.7                     -4.2                0.5            2.0     Aver a ge                 4.2 0.5                             5.2                    5.7                     2.9             -0.2                      -1.3                -0.4
                                                 Capex Deployment & Earnings Accruals                                                                                                                                                 Consensus Ratings
Low Capex/Depr                                                          7.6                1.6         2.5               4.8            8.2                      4.6                 3.7        2.8 High Analyst Rec              5.3              0.1                       3.5                  5.9                     4.2         -3.7                     -1.8                0.3
Low Capex/Sales                                                         7.2                -0.9        3.3               5.7            7.1                      2.8                 1.8        1.8 High Analyst Rec 1m chg       0.2 -0.1                             -0.9                   -0.3                        0.7         -0.7                     0.1                 2.3
Low Capex/FA                                                            -3.3               -0.1        -3.1             -3.6           -2.8                      0.5                 0.7        0.9 Aver a ge                    2.7 0.0                             1.3                    2.8                     2.4             -2.2                      -0.8                1.3
High Receivables yoy chg                                                8.4                0.4         3.7               7.7           10.5                      3.5                 3.5        2.7
Low Inventory yoy chg                                                   2.3                0.5         2.5               2.8            2.1                     0.1               -0.3          -1.3
Low Payables yoy chg                                                    1.0                -0.5        0.8               1.7            0.9                      0.4              -0.9          -0.9
Aver a ge                                                               3.9               0.2          1.6              3.2            4.3                    2.0               1.4            1.0
Source: Deutsche Bank, FactSet, I/B/E/S. Note: *1m, 3m, 6m, 12m, 5yr, 10yr and 15yr returns are as of month ended September 2012. **Quintile baskets are formed on a regional sector relative basis.
Relative performance is based on equal weighted average returns of the best quintile basket and the market. For description on factors please see appendix A.


Deutsche Bank AG/Hong Kong                                                                                                                                                                                                                                                                                                                                                        Page 39
17 October 2012
The Investigator


Japan – market intelligence

Figure 105: Equity market performance
          1800                                                                           250                          1200                                                                               50
                                    MSCI Japan LC Index (LS)                                                                                     MSCI Japan LC Index (LS)
          1600                                                                                                        1100
                                    Rel to World (RS)                                                                                            Rel to World (RS)                                       45
          1400                                                                           200
                                                                                                                      1000
          1200                                                                                                                                                                                           40
                                                                                         150                            900
          1000
                                                                                                                        800                                                                              35
           800
                                                                                         100                            700
           600                                                                                                                                                                                           30
           400                                                                                                          600
                                                                                         50
                                                                                                                                                                                                         25
           200                                                                                                          500
             0                                                                           0                              400                                                                              20
               1/73         1/78         1/83        1/88          1/93       1/98                                         1/00        1/02      1/04       1/06        1/08      1/10     1/12

Source: Deutsche Bank, Bloomberg Finance LP, DataStream.


Figure 106: Market intelligence by sector
11Oct12                                          Mcap       LC Perf                  P/E (x)          P/B (x)      Div Yld (%)        EPSg (%)         ROE (%)
Sector (#Co)                                     U$m        1m YTD          CY11      CY12 CY13 CY11 CY12 CY13 CY11 CY12 CY13 CY11 CY12 CY13 CY11 CY12 CY13
Energy (7)                                      33,124      6.8 -7.9          7.2        9.8 9.2  0.7    0.6  0.6 2.9   2.9    2.9 39.1 -40.4 14.1 10.8   6.2  6.8
Materials (36)                               126,581        -2.7 -14.3        14.1      14.6     10.2       0.8      0.8      0.8      2.7      2.7      2.9 -11.2         -4.6    50.9       5.1      5.1        7.0
Capital Goods (46)                           280,126        -3.3    -6.7       9.1      11.1       9.2      1.0      0.9      0.8      3.0      3.2      3.3     20.7      7.0       8.6    10.7     10.7        10.7
Comm Svc (3)                                    16,960      -4.4    -9.8      33.6      19.2     13.5       0.8      1.3      0.8      3.5      3.6      3.7 -54.5        74.4     42.5       2.0      3.4        4.7
Transportation (19)                             92,059      -0.2     0.3      22.6      17.7     13.7       1.1      1.1      1.0      1.8      1.8      2.0 -31.8        60.3     33.7       3.4      5.3        6.8
Autos (22)                                   251,250        -8.2     3.5      15.8      10.3       8.2      0.9      0.9      0.8      1.9      2.5      3.0       nm     69.7     30.6       5.8      8.4        9.8
Cons Durables (14)                              64,251      -6.8 -19.3        16.3      12.9     11.7       0.7      0.7      0.7      2.4      2.4      2.5       na       na       na       6.3      2.6        6.2
Cons Svc (3)                                    11,560      -1.1 13.9         24.9      19.2     16.6       2.1      1.9      1.8      1.5      1.5      1.6     14.9     29.6     15.9       8.3    10.0        10.7
Media (4)                                        9,546      -4.0 -11.4        17.8      15.2     13.9       1.0      0.9      0.9      1.8      2.0      2.2     11.8     17.0      9.6       5.5      6.1        6.3
Retailing (12)                                  41,943      -4.6    -2.4      15.6      13.4     12.9       1.4      1.3      1.2      1.4      1.6      1.6     34.9     15.9      3.9       9.1      9.5        9.1
Food/Staples Retail (4)                         35,562      -2.5     2.6      15.1      13.1     11.7       1.1      1.1      1.0      2.7      2.9      3.1     20.6     15.2     12.3       7.5      8.0        8.5
Food Beverage (13)                              76,356      1.6 16.5          20.5      15.7     14.2       1.4      1.4      1.3      1.9      2.2      2.5     28.7     30.6     10.6       7.1      8.7        9.1
Household Products (3)                          25,719      -5.8    -1.4      28.0      23.1     19.9       2.1      2.1      2.0      2.6      2.6      2.6 -14.2        20.8     16.5       7.6      8.9        9.9
Health Care Equip/Svc (7)                       22,012      -3.3 13.3         58.8      23.4     16.2       1.5      1.5      1.4      1.4      1.3      1.5 -60.8 151.7           44.1       5.5      7.1        8.6
Pharma & Biotech (15)                        122,063        -2.2     5.8      19.0      17.2     15.5       1.4      1.3      1.3      3.8      3.9      4.0 -23.2        10.7     10.4       7.3      7.8        8.2
Banks (21)                                   193,115        -2.6     6.9       6.8       7.1       7.7      0.6      0.6      0.5      3.6      3.6      3.7     25.8      -7.5     -8.2      9.3      8.1        7.1
Div Financials (7)                              36,324      -1.1 17.7         31.3      14.9     10.4       0.6      0.6      0.6      1.9      1.9      2.1 -21.4 110.7           42.7       1.9      3.8        5.4
Insurance (6)                                   52,325      0.5      8.7 374.0          26.6     14.4       0.8      0.8      0.7      3.0      3.1      3.1       nm       na     84.5      -1.7      2.9        5.2
Real Estate (15)                                92,102      5.3 32.2          22.3      20.2     18.1       1.5      1.4      1.4      1.4      1.5      1.6 -12.8        47.3     11.7       6.7      7.1        7.5
Software (13)                                   41,854      4.5     -3.9      24.1      19.3     14.4       1.5      1.4      1.3      2.0      1.8      2.2 -41.0        24.4     34.1       6.3      7.4        9.3
Tech Hard/Equip (25)                         169,808        -4.4 -14.3        12.2      12.6     10.3       1.0      0.9      0.9      2.9      3.0      3.2     -1.8      8.0     22.7       6.7      6.9        8.1
Semis (4)                                       12,854      -7.2 -15.4        27.8      43.7     18.5       0.8      0.8      0.8      2.4      1.9      2.1       nm          na 136.6       2.7      1.8        4.1
Telecom (4)                                     77,770      -5.1     3.4      10.8       9.3       8.6      1.1      1.1      1.0      2.8      3.1      3.4     16.6     15.6      8.6     10.6     11.3        11.2
Utilities (13)                                  58,998      8.4 -22.5         43.4      14.6     12.9       0.7      0.7      0.7      4.0      2.8      2.4       na       na       na      -0.9      2.1        7.5
Japan (316)                                1,944,263        -2.6    -1.8      13.2      12.2     10.4       0.9      0.9      0.8      2.6      2.8      3.0 -15.9        33.7     29.6       6.8      7.4        8.2
Source: Deutsche Bank, I/B/E/S, MSCI. Note: Data in the table are compiled based on MSCI country index universe. P/E, P/B, dividend yield, EPS growth and ROE are aggregated using I/B/E/S consensus estimates
(calendarized to December year end) with current prices. All numbers are free-float adjusted.


Figure 107: Market Expected Return Indicator for Japan
   10                                                                            Market Expected Return Indicator, LS                                                                                     1,300
                       Japan                         Bullish
                                                                                 MSCI JAPAN, RS                                                                                                           1,100
    5
                                                                                                                                                                                                          900
    0
                                                                                                                                                                                                          700
    -5
                                                                                                                                                                                                          500
  -10                                                                                                                                                                                                     300
                                           Bearish
  -15                                                                                                                                                                                                     100
         1/93 1/94 1/95 1/96 1/97 1/98 1/99 1/00 1/01 1/02 1/03 1/04 1/05 1/06 1/07 1/08 1/09 1/10 1/11 1/12
Source: Deutsche Bank, MSCI, Bloomberg Finance LP


Page 40                                                                                                                                                             Deutsche Bank AG/Hong Kong
17 October 2012
The Investigator


Companies Mentioned

Figure 108: Companies Mentioned
                                                   DB     Bloomberg     Price                                                     DB     Bloomberg  Price       
S.No Country Company                               Rating Ticker        (15 Oct) S.No Country Company                             Rating Ticker     (15 Oct)
    1 CN       Belle Int'l Holding                  Buy    1880 HK        13.5      54    CN   Dongfeng Motor                      Buy     489 HK         9.9
    2 CN       China Comm Services                  Buy    552 HK          4.5      55    HK   Hang Lung Properties                Buy     101 HK        26.2
    3 CN       China Comms Construct                Buy    1800 HK         7.0      56    TW   Delta Electronics                   Buy     2308 TT       101.0
    4 CN       Haitong Securities                   Buy    6837 HK        10.6      57    CN   Franshion                           Buy     817 HK         2.4
    5 CN       China Mobile                         Hold   941 HK         84.1      58    MY   Genting Bhd                         Hold    GENT MK        8.8
    6 CN       CNOOC Ltd                            Hold   883 HK         15.8      59    TH   Kasikornbank                        Buy     KBANK TB      176.5
    7 CN       Guangdong Investment                 Buy    270 HK          6.1      60    KR   Nexen Tire                          Hold    002350 KS    18800.0
    8 CN       ICBC                                 Buy    1398 HK         4.9      61    TW   Orise Technology                    Buy     3545 TT       34.9
    9 CN       SouFun                               Buy    SFUN US        17.9      62    CN   Shanghai Electric                   Buy     2727 HK        3.0
   10 CN       Db X-Trackers Csi300 Trn Index Et     NA    3049 HK         NA       63    MY   DiGi.Com                             NA     DIGI MK        NA
   11 HK       SJM                                  Buy    880 HK         16.4      64    IN   Bank of Baroda                      Buy     BOB IN        779.8
   12 HK       BOC Hong Kong Holdings               Buy    2388 HK        24.1      65    CN   China CITIC                         Hold    998 HK         4.1
   13 HK       Giordano                             Hold   709 HK          6.3      66    IN   Asian Paints                        Hold    APNT IN      3865.8
   14 HK       SHK Properties Ltd                   Buy    16 HK          109.0     67    KR   Hyundai Heavy                       Buy     009540 KS   236000.0
   15 ID       Indocement                           Buy    INTP IJ       21150.0    68    KR   Korean Reinsurance                   NA     003690 KS    11750.0
   16 ID       Ace Hardware Indonesia               Buy    ACES IJ       6600.0     69    CN   Sinopec-H                           Buy     386 HK         7.9
   17 IN       ICICI Bank                           Buy    ICICIBC IN    1053.1     70    HK   Cathay Pacific                       Sell   293 HK        13.4
   18 IN       Oil India Limited                    Buy    OINL IN        489.3     71    CN   Maanshan-H                           Sell   323 HK         1.9
   19 IN       ONGC                                 Buy    ONGC IN        279.9     72    TW   Siliconware Precision               Hold    2325 TT       31.6
   20 IN       IDFC                                 Buy    IDFC IN        150.6     73    KR   DSME                                Hold    042660 KS    23900.0
   21 IN       Shree Cement                         Buy    SRCM IN       4080.2     74    KR   OCI Company                          NA     010060 KS   159500.0
   22 IN       Grasim                               Buy    GRASIM IN     3422.1     75    ID   BRI                                 Buy     BBRI IJ      7650.0
   23 KR       Korea Zinc                           Buy    010130 KS    445000.0    76    KR   Samsung Eng.                        Hold    028050 KS   163500.0
   24 KR       Dongbu Insurance Co. Ltd.             NR    005830 KS     51300.0    77    TH   Siam Cement                         Buy     SCC TB        349.0
   25 KR       SEC                                  Buy    005930 KS    1300000.0   78    CN   KWG Property                        Buy     1813 HK        4.2
   26 KR       SK Innovation                        Buy    096770 KS    151000.0    79    CN   SOHO China                          Buy     410 HK         5.1
   27 KR       LG Chem                              Buy    051910 KS    314000.0    80    KR   Hyundai Dept Store                  Buy     069960 KS   148500.0
   28 MY       Top Glove                            Buy    TOPG MK         5.3      81    HK   SJM                                 Buy     880 HK        16.4
   29 MY       Telekom Malaysia                     Hold   T MK            6.3      82    TW   Taiwan Cement                       Hold    1101 TT       36.2
   30 PH       Megaworld                            Buy    MEG PM          2.4      83    TW   Powertech Technology                 Sell   6239 TT       51.0
   31 SG       Keppel Land                          Buy    KPLD SP         3.5      84    KR   Amorepacific Corp.                  Hold    090430 KS   1249000.0
   32 SG       Sembcorp Industries Ltd              Buy    SCI SP          5.5      85    MY   Hong Leong Bank Bhd.                Hold    HLBK MK       14.0
   33 SG       Sembcorp Marine                      Buy    SMM SP          4.9      86    KR   Industrial Bank of Korea            Hold    024110 KS    11700.0
   34 TH       BEC World PLC                        Hold   BEC TB         57.3      87    KR   KT&G Corp.                          Hold    033780 KS    91200.0
   35 TH       Minor International PLC              Buy    MINT TB        18.2      88    PH   Aboitiz Power Corp.                 Hold    AP PM         33.4
   36 TH       Sino-Thai Engineering                Buy    STEC TB        21.2      89    TH   Krung Thai Bank Public Co., Ltd     Buy     KTB TB        18.2
   37 TH       PTT PCL                              Hold   PTT TB         313.0     90    ID   PT Charoen Pokphand Indones         Buy     CPIN IJ      3100.0
   38 TW       Uni-President                        Buy    1216 TT        51.8      91    ID   PT Perusahaan Gas Negara (P         Buy     PGAS IJ      4325.0
   39 TW       Far EasTone Telecom                  Buy    4904 TT        72.8      92    SG   Yangzijiang Shipbuilding (Holdin    Hold    YZJ SP         0.9
   40 TW       Novatek Microelectronics             Buy    3034 TT        104.0     93    TW   Formosa Chemicals & Fibre           Hold    1326 TT       75.3
   41 CN       Agri. Bank of China                  Hold   1288 HK         3.2      94    CN   China Construction Bank-H           Hold    939 HK         5.8
   42 CN       Anta Sports                          Hold   2020 HK         6.6      95    HK   Wharf Holdings ltd                  Hold    4 HK          51.4
   43 SG       Fraser & Neave                       Buy    FNN SP          8.9      96    IN   Wipro Ltd                           Buy     WPRO IN       353.0
   44 CN       China Shineway                       Hold   2877 HK        10.8      97    ID   United Tractors Tbk Pt              Buy     UNTR IJ      19700.0
   45 TW       Chunghwa Tel                         Hold   2412 TT        92.1      98    MY   Public Bank                         Hold    PBKF MK       14.5
   46 TW       Far EasTone Telecom                  Buy    4904 TT        72.8      99    TW   Mstar Semiconductor Inc             Buy     3697 TT       240.0
   47 PH       First Philippine Hldgs               Buy    FPH PM         80.0      100 CN     Bank of China Ltd-H                 Buy     3988 HK        3.1
   48 KR       LIG Insurance                         NA    002550 KS     26150.0    101 KR     Hyundai Marine & Fire Ins Co         NA     001450 KS    36200.0
   49 ID       Perusahaan Gas Negara                Buy    PGAS IJ       4325.0     102 KR     HYUNDAI MOTOR CO                    Buy     005380 KS   225500.0
   50 MY       PLUS Expressways                      NA    PLUS MK         NA       103 KR     HYUNDAI MOBIS                       Buy     012330 KS   297000.0
   51 SG       SATS                                  NA    SATS SP         NA       104 TW     SIMPLO TECHNOLOGY CO LT Buy                 6121 TT       178.0
   52 MY       Top Glove                            Buy    TOPG MK         5.3      105 SG     STARHUB LTD                         Hold    STH SP         3.7
   53 HK       Wynn Macau                           Buy    1128 HK        20.4      106


Deutsche Bank AG/Hong Kong                                                                                                                             Page 41
17 October 2012
The Investigator


Appendix A
In the stock ranking model, optimized weights based on back-tests are given to various
factors (see Figure 109) to form an aggregate score for each stock. Scores are given on
a sector- and country-relative basis, and the weight matrix used in each industry group
varies depending on back-test results.

Figure 109: Definition of factors
V a lua t ion Fa c t or s
12m Fd P/E: price to 12-month forward EPS
Trailing P/E: price to 12m trailing EPS
Dividend Yield: 12m trailing dividend yield
P/Op Inc: Price to operating income
P/BV: Price to book value
Price/Sales: Price to sales
P/FCF: Price to free cash flow
EV/EBIT: Enterprise value to EBIT
EV/EBITDA: Enterprise value to EBITDA
EV/Cap Emp: Enterprise value to capital employed
EV/Sales: Enterprise value to sales
EV/Op CF: Enterprise value to operating cash flow
EV/FCF: Enterprise value to free cash flow
P r ic e Mom ent um Fa c t or s
6m Price Mom: 6-month price momentum
9m Price Mom: 9-month price momentum
12m Price Mom: 12-month price momentum
Price Rel Strength: 65-day to 260-day moving average in stock price
Price Mom, 3mΔ: 3-month change in 12-month price momentum
Price ↑ / ↓ Days: Number of up less down days in stock price in 130 days
E a r nings Mom ent um Fa c t or s
FY1 EPS Mom: Weighted average on 1-, 2- and 3-month change in FY1 eps mean estimate
FY2 EPS Mom: Weighted average on 1-, 2- and 3-month change in FY2 eps mean estimate
12m Fd EPS Mom: Weighted average on 1-, 2- and 3-month change in 12-month forward eps mean estimate
FY1 EPS Rev: % of upward less downward revisions in FY1 eps estimates in 3 months
FY2 EPS Rev: % of upward less downward revisions in FY2 eps estimates in 3 months
E a r nings Q ua lit y (E a r nings Ac c r ua ls a nd Ca pex Deploy m ent Fa c t or s )
Capex/Depr: Capital expenditure to depreciation expense
Capex/Sales: Capital expenditure to sales
Capex/FA: Capital expenditure to fixed assets
Receivables/Ttl Assets, YoYΔ: YoY change in account receivables to total assets ratio
Inventory/Ttl Assets, YoYΔ: YoY change in inventory to total assets ratio
Payables/Ttl Assets, YoYΔ: YoY change in account payable to total assets ratio
P r of it a bilit y Fa c t or s
Rtn of Capital Employed: Cash return on capital employed
Rtn of Capital Employed, YoYΔ: YoY change in cash return on capital employed
ROE: Return on equity
ROE, YoYΔ: YoY change in return on equity
Gr owt h Fa c t or s
3yr Sales Gth: 3-year growth in sales (actual)
5yr Sales Gth: 5-year growth in sales (actual)
3yr EPS Gth: 3-year growth in eps (actual)
5yr EPS Gth: 5-year growth in eps (actual)
LT Gth Est: Consensus estimate on long term eps growth
FY1 Gth Est: Consensus estimate on FY1 eps growth
FY2 Gth Est: Consensus estimate on FY2 eps growth
S t a bilit y Fa c t or s
EPS Vola: 3-year volatility in trailing eps
Op Inc Vola: 3-year volatility in trailing operating income per share
Book Value Vola: 3-year volatility in historical book value per share
Sales Vola: 3-year volatility in trailing sales per share
EPS Est Vola: 3-year volatility in 12-month forward eps estimate
Ris k Fa c t or s
FY1 EPS Dispersion: Dispersion of FY1 eps estimates
FY2 EPS Dispersion: Dispersion of all the FY2 eps estimates
EBIT/Int Exp: EBIT to interest expense
Debt/Equity: Debt to equity
Altman Z Score: (1.2 x working capital + 1.4 x retained earnings + 3.3 x EBIT + sales) / total assets + 0.6 x market value of equity / total liabilities
Market Cap: Company market capitalisation
Cons ens us Ra t ing Fa c t or s
Analyst Rating: Consensus rating
Analyst Rating, 1mΔ: 1-month change on consensus rating
Source: Deutsche Bank


Page 42                                                                                                                                                    Deutsche Bank AG/Hong Kong
17 October 2012
The Investigator


Figure 110: Bottom-up sector ranking (Rank 1 = Best)


                                                                                                                                                                                                              12 month Forward EPS
                                                                                                                                                      FY1 EPS Revisions

                                                                                                                                                                          FY2 EPS Revisions


                                                                                                                                                                                                                                                               Earnings Revisions
                                                                                                   Mkt Cap (U$ mn)


                                                                                                                             12m fwd P/E


                                                                                                                                                                                                                                     expectation


                                                                                                                                                                                                                                                                                     Profitability
                                                                                                                                                                                                                                                                                                     Technicals
                                                                                                                                                                                                                                                   Valuation
                                                                                                                                                                                              ROE (%)
                                                                                                                                            EV/EBIT
                                                                                                                     P/B


                                                                                                                                                                                                        RSI
Rank Country               Sector
   1     Philippines Utilities                                                                       3,637            2.9        11.6       11.7      1.00 1.00                               22.5 1.10                        22%                   O           ++ ++ ++
   2     Japan             Banks                                                                193,115               0.5             9.5              0.23 -0.15                                 4.5 0.98                           -2% ++                           +                 --                -
   3     Thailand          Telecommunication Services                                                5,930            4.9        16.6       18.6      0.89 0.51                               21.4 1.22                        15%                   --          ++ ++ ++
   4     Indonesia         Utilities                                                                 4,952            6.5        13.8       12.0      0.75 0.43                               48.5 1.09                        12%                     -         ++ ++ ++
   5     Japan             Telecommunication Services                                             77,770              1.0             8.7       7.5   0.18 0.19                                   9.9 1.03                     12% ++                            ++                        -           O
   6     Thailand          Banks                                                                  32,450              1.7        10.6                  0.65 0.50                              12.4 1.11                        18%                   O           ++                     O             ++
   7     Philippines Banks                                                                           3,961            1.7        11.9                  0.60 0.67                              14.8 1.11                        10%                   O           ++                      +            ++
   8     Indonesia         Banks                                                                  31,482              2.0             9.7              0.65 0.50                              18.8 1.01                        14%                    +          ++                      +             O
   9     Indonesia         Household & Personal Products                                             4,133           52.7        37.2       33.0      0.43 0.71 122.3 1.22                                                     16%                   --          ++ ++ ++
  10     Thailand          Food & Staples Retailing                                                  5,559           12.2        25.5       22.4      0.63 0.83                               38.7 1.13                        23%                   --          ++ ++ ++
  11     India             Software & Services                                                    37,853              3.2        12.7       11.0      0.58 0.63                               21.7 1.10                        15%                     -         ++ ++ ++
  12     China             Utilities                                                              17,175              1.2             9.5   18.1      0.50 0.64                                   5.6 1.10                     27%                    +          ++                     - - ++
  13     China             Real Estate                                                            34,144              0.9             5.7       5.9   0.00 -0.17                              14.4 1.06                        13% ++                                 +                  +              +
  14     Indonesia         Pharmaceuticals & Biotechnology                                                     467    5.3        18.7       16.2      0.71 0.71                               24.5 1.08                        20%                   --          ++ ++ ++
  15     Hong Kong Real Estate                                                                  112,266               0.6        12.6           7.2   0.33 0.20                                   8.8 1.06                           3% ++                       ++                        -            +
  16     Philippines Diversified Financials                                                          1,773            2.1        15.7                  0.83 0.80                                  9.1 1.10                     20%                   --          ++                        -          ++
  17     Japan             Retailing                                                              41,943              0.9        11.1           6.5   0.17 0.06                               10.2 1.00                              9% ++                       ++                     O              O
  18     Malaysia          Utilities                                                              13,877              1.3        12.7       12.5      0.35 0.43                                   9.9 1.10                           5%              O           ++                     O             ++
  19     China             Banks                                                                153,529               1.0             5.5             -0.25 -0.52                             21.3 0.92                              1% ++                           O                ++ - -
  20     Japan             Media                                                                     9,546            0.8        12.6           5.6   0.00 0.20                                   6.2 0.98                     10% ++                            ++                     --                -
  21     Japan             Food & Staples Retailing                                               35,562              1.3        11.4           6.5   0.05 -0.08                              10.6 1.09                        12% ++                                 +                 O             ++
  22     India             Banks                                                                  60,156              0.8             5.2             -0.37 -0.35                             18.3 0.97                        16% ++                                O                   +                -
  23     Japan             Health Care Equipment & Services                                       22,012              0.9        13.2           7.1 -0.20 0.27                                    6.6 1.11                     17% ++                                 +                    -          ++
  24     Korea             Insurance                                                              17,335              1.4             6.5             -0.22 -0.09                             15.1 0.99                        14% ++                                 +                  +                -
  25     Korea             Banks                                                                  43,648              0.6             5.8             -0.67 -0.71                             12.8 0.96                              0% ++                               -              O                 -
  26     Japan             Pharmaceuticals & Biotechnology                                      122,063               1.5        14.7           9.5   0.50 0.14                                   8.7 1.06                           8%              O           ++                        -            +
  27     Singapore Real Estate                                                                    29,308              0.9        15.9       13.6      0.49 0.20                               10.2 1.12                              4%                -         ++                     O             ++
  28     Japan             Diversified Financials                                                 36,324               0.7       11.1                 -0.17 0.42                                  3.8 1.01                     19% ++                            ++                     --             O
  29     Japan             Commercial Services & Supplies                                         16,960              0.9        13.7           7.1   0.00 0.00                                   5.3 1.04                     17% ++                                 +                 --              +
  30     Malaysia          Banks                                                                  33,575               1.9       12.2                  0.32 0.00                              16.5 1.05                        10%                    +          ++                      +              +
  31     Singapore Retailing                                                                         4,270            3.2        11.6           8.8   0.14 0.11                               24.8 1.09                        16%                   O           ++ ++ ++
  32     Korea             Automobiles & Components                                               76,862              1.2             6.4       6.6 -0.20 -0.20                               16.5 0.98                        17% ++                                O                   +                -
  33     Singapore Banks                                                                          60,279              1.4        11.4                  0.24 -0.17                             11.3 1.07                              5%               +               +                 O               +
  34     Philippines Real Estate                                                                     5,457            1.6        10.7       16.4      0.67 0.10                                   8.6 1.09                     15%                     -         ++                        -          ++
  35     Japan             Software & Services                                                    41,854              1.2        11.4           7.0   0.00 0.17                                   8.9 1.01                     18% ++                                 +                    -           O
  36     Hong Kong Banks                                                                          29,986               1.1       12.0                  0.45 -0.17                                 9.2 1.00                           4%               +          ++                        -           O
Source: Deutsche Bank, EPS momentum is the number of upward less downward revisions in respective financial year EPS estimate in last 3 months. RSI is the ratio of 65-day to 260-day moving average in stock price. All
the metrics shown above except market cap are median data for the sector. ++ Very favorable, + Favorable, O Neutral, - Unfavorable, Very unfavorable


Deutsche Bank AG/Hong Kong                                                                                                                                                                                                                                                          Page 43
17 October 2012
The Investigator


Figure 110: Bottom-up sector ranking (Rank 1 = Best), continued


                                                                                                                                                                                                                  12 month Forward EPS
                                                                                                                                                         FY1 EPS Revisions

                                                                                                                                                                             FY2 EPS Revisions


                                                                                                                                                                                                                                                                   Earnings Revisions
                                                                                                   Mkt Cap (U$ mn)


                                                                                                                                12m fwd P/E


                                                                                                                                                                                                                                         expectation


                                                                                                                                                                                                                                                                                        Profitability

                                                                                                                                                                                                                                                                                                        Technicals
                                                                                                                                                                                                                                                       Valuation
                                                                                                                                                                                                 ROE (%)
                                                                                                                                               EV/EBIT
                                                                                                                         P/B


                                                                                                                                                                                                            RSI
Rank Country               Sector
  37     Korea             Hotels Restaurants & Leisure                                              2,095                2.8       12.9       12.0       0.55 0.00                              17.6 1.13                         27%                     -         ++                     +            ++
  38     Malaysia          Automobiles & Components                                                  1,718                1.1       10.5           7.9    0.00 0.00                              14.9 1.06                         18%                    +               +                 +              +
  39     India             Household & Personal Products                                          11,909                 11.6       27.0       29.1       0.35 0.34                              35.0 1.14                         19%                   --          ++ ++ ++
  40     India             Energy                                                                 30,512                  1.4            8.6   10.2 -0.08 0.00                                   12.2 1.01                         12%                    +               +                O              O
  41     Taiwan            Consumer Durables & Apparel                                               5,653                2.3       13.8       15.3       0.17 0.33                              14.0 1.05                         12%                     -         ++                    O               +
  42     India             Diversified Financials                                                 11,120                  1.7       10.9                 -0.14 0.00                              18.6 1.07                         18%                    +               +                 +              +
  43     Japan             Automobiles & Components                                             251,250                   0.9            7.5       5.8 -0.48 -0.44                                   8.2 0.94                      25% ++                                O                    -           --
  44     Korea             Utilities                                                                 7,708                0.3       17.5       11.0 -0.60 -0.14                                      2.8 1.05                      11% ++                                O                 --              +
  45     Japan             Consumer Durables & Apparel                                            64,251                  0.7       11.0           9.8 -0.33 0.02                                    4.3 0.97                      15% ++                                 +                --                -
  46     Taiwan            Banks                                                                  34,373                  1.0       11.3                 -0.16 -0.07                                 8.2 1.03                            7%               +               +                   -           O
  47     Philippines Food & Staples Retailing                                                                        0    2.0       12.3           9.9    0.00 0.00                              12.7 1.06                         11%                   O                +                O               +
  48     Japan             Transportation                                                         92,059                  0.9       11.5       18.1 -0.12 -0.07                                      5.7 1.00                      14% ++                                 +                --             O
  49     Malaysia          Diversified Financials                                                    3,438                1.1       12.2                  0.08 -0.07                                 8.9 0.97                            9%               +               +                   -              -
  50     Malaysia          Telecommunication Services                                             18,375                  2.9       22.2       18.1       0.16 0.00                              20.8 1.14                         12%                   --               +              ++ ++
  51     Korea             Energy                                                                 15,613                  1.0            7.6   10.9 -0.64 -0.17                                  12.4 1.02                         15% ++                                O                 O              O
  52     Korea             Technology Hardware & Equipment                                        15,766                  1.4       10.0       13.0       0.05 -0.12                             10.8 1.04                         25%                   O                +                O               +
  53     Indonesia         Food Beverage & Tobacco                                                   8,432                2.7       12.8       13.0 -0.41 0.33                                   21.7 1.04                         16%                     -              +              ++ +
  54     Japan             Food Beverage & Tobacco                                                76,356                  1.0       14.5       12.7 -0.20 -0.33                                      5.2 1.01                      13%                    +              O                 --             O
  55     India             Pharmaceuticals & Biotechnology                                        13,343                  4.7       18.2       19.4       0.00 0.11                              20.4 1.06                         18%                   --               +              ++ +
  56     Indonesia         Telecommunication Services                                             12,307                  1.8       18.1       27.1 -0.06 0.24                                       0.1 1.03                      15%                     -         ++                    --             O
  57     China             Software & Services                                                    33,658                  2.3       11.0           7.3 -0.33 -0.13                               18.7 0.97                         17%                   O               O                  +                -
  58     Indonesia         Automobiles & Components                                               16,899                  2.1       13.8       13.8 -0.08 0.00                                   21.2 0.96                         15%                     -              +              ++                  -
  59     Taiwan            Insurance                                                              10,968                  1.3       13.3                 -0.69 0.00                                  7.0 1.00                      11%                    +              O                    -           O
  60     Japan             Real Estate                                                            92,102                  1.0       12.5                 -0.13 -0.50                                 5.0 1.06                      10%                    +              O                 --              +
  61     Malaysia          Hotels Restaurants & Leisure                                           10,261                  1.6       13.0           9.2 -0.41 -0.10                               11.3 1.02                         10%                   O               O                 O              O
  62     India             Materials                                                              21,862                  2.2            9.3   10.9 -0.27 -0.29                                  14.2 1.01                         14%                   O               O                  +             O
  63     Japan             Capital Goods                                                        280,126                   0.8       10.8           8.8 -0.55 -0.50                                   6.3 0.96                      15% ++                                    -             --                -
  64     China             Telecommunication Services                                             83,466                  1.3       12.9           6.3 -0.48 -0.53                               12.8 1.05                         17% ++                                    -             O               +
  65     Taiwan            Telecommunication Services                                             22,664                  3.6       18.8       18.3 -0.23 0.00                                   14.9 1.10                         13%                   --               +                 +            ++
  66     Malaysia          Capital Goods                                                          14,418                  1.3       12.6       11.8 -0.23 -0.23                                  11.8 1.01                         17%                   O               O                 O              O
  67     Korea             Food Beverage & Tobacco                                                15,228                  1.3       10.8       12.6 -0.65 -0.10                                      9.3 1.07                      15%                    +              O                    -            +
  68     Japan             Insurance                                                              52,325                  1.2       13.2                 -0.08 -0.41                                 2.5 1.00                      25%                    +              O                 --             O
  69     India             Utilities                                                              11,075                  1.8       11.1       12.0 -0.36 -0.14                                  11.7 0.97                               8%              O               O                 O                 -
  70     Hong Kong Technology Hardware & Equipment                                                             860        1.2       10.6       13.1       0.00 -0.20                                 6.0 0.86                      21%                    +               +                --             --
  71     Singapore Capital Goods                                                                  38,292                  1.2       11.8       12.3 -0.66 0.00                                       9.0 1.07                      18%                   O               O                    -            +
  72     Japan             Energy                                                                 33,124                  0.7       13.0       16.0 -0.56 -0.33                                      1.9 0.89                            -6% ++                          O                 --             --
Source: Deutsche Bank, EPS momentum is the number of upward less downward revisions in respective financial year EPS estimate in last 3 months. RSI is the ratio of 65-day to 260-day moving average in stock price. All
the metrics shown above except market cap are median data for the sector. ++ Very favorable, + Favorable, O Neutral, - Unfavorable, Very unfavorable


Page 44                                                                                                                                                                                                    Deutsche Bank AG/Hong Kong
17 October 2012
The Investigator


Figure 110: Bottom-up sector ranking (Rank 1 = Best), continued


                                                                                                                                                                                                             12 month Forward EPS
                                                                                                                                                     FY1 EPS Revisions

                                                                                                                                                                         FY2 EPS Revisions


                                                                                                                                                                                                                                                              Earnings Revisions
                                                                                                   Mkt Cap (U$ mn)


                                                                                                                            12m fwd P/E


                                                                                                                                                                                                                                    expectation


                                                                                                                                                                                                                                                                                   Profitability

                                                                                                                                                                                                                                                                                                   Technicals
                                                                                                                                                                                                                                                  Valuation
                                                                                                                                                                                             ROE (%)
                                                                                                                                           EV/EBIT
                                                                                                                     P/B


                                                                                                                                                                                                       RSI
Rank Country               Sector
  73     India             Food Beverage & Tobacco                                                13,829              3.6       21.2       17.8 -0.25 0.00                                   19.2 1.05                        20%                   --               +              ++ +
  74     Taiwan            Semiconductors & Semiconductor Equipment                             111,700               1.5       14.0       18.3 -0.20 -0.05                                      8.5 0.98                     19%                     -              +                   -              -
  75     Thailand          Media                                                                     1,820            3.2       18.1       19.7 -0.25 -0.10                                  12.5 1.10                        17%                   --              O                 O             ++
  76     Hong Kong Telecommunication Services                                                        1,584            1.5       11.8       11.5 -0.86 -0.28                                  15.7 1.06                              6%               +                  -              +              +
  77     Hong Kong Consumer Durables & Apparel                                                       2,556            1.2            8.1       6.5 -0.50 -0.89                               13.8 0.93                        10% ++                                    -             O              --
  78     Korea             Capital Goods                                                          62,600              1.0            9.7   14.3 -0.33 -0.33                                      7.0 0.95                     26%                    +              O                    -              -
  79     Singapore Transportation                                                                 12,117              1.7       15.7       16.4 -0.30 -0.26                                  10.7 1.03                              7%                -             O                 O              O
  80     Philippines Telecommunication Services                                                      3,698            3.5       14.2       14.0 -0.26 -0.55                                  21.8 1.04                              3%                -             O               ++ +
  81     Malaysia          Food Beverage & Tobacco                                                15,148              2.1       14.3       13.9 -0.50 -0.07                                  16.8 1.05                        13%                     -             O                  +              +
  82     India             Automobiles & Components                                               17,730              2.9       13.3       12.0 -0.50 -0.33                                  21.6 1.05                        20%                   O               O               ++ +
  83     Korea             Materials                                                              59,183              0.9            8.9   11.1 -0.49 -0.52                                      7.8 0.90                     16% ++                                    -                -           --
  84     Singapore Diversified Financials                                                            4,742            1.9       15.5                 -0.20 -0.39                                 7.3 1.04                           6%                -             O                    -            +
  85     Japan             Materials                                                            126,581               0.7            9.5   10.6 -0.73 -0.58                                      5.0 0.89                     17% ++                                    -             --             --
  86     Japan             Household & Personal Products                                          25,719              1.4       15.6           8.8 -0.71 -0.17                                   8.6 1.00                     17%                    +              O                    -           O
  87     Philippines Capital Goods                                                                10,086              3.1       12.0       14.2 -0.50 -0.47                                  21.3 1.12                        14%                     -                 -           ++ ++
  88     Singapore Media                                                                             5,319            3.1       16.3       15.5 -0.43 -0.20                                  17.2 1.04                              2%                -             O                  +              +
  89     Taiwan            Diversified Financials                                                 10,772              0.9       17.2                 0.01 -0.56                                  3.2 0.98                           -1%               -             O                 --                -
  90     Malaysia          Transportation                                                            3,823            1.7       17.1       14.9 -0.32 -0.20                                  11.8 0.97                              4%                -             O                 O                 -
  91     Korea             Transportation                                                            5,194            1.3       18.1       ####       0.00 0.14 -15.9 1.02                                                    21%                   --               +                --             O
  92     Malaysia          Materials                                                                 7,080            1.4            9.6   14.4 -0.60 -0.33                                  10.9 1.00                        15%                   O               O                 O              O
  93     China             Health Care Equipment & Services                                          5,936            4.4       26.5       10.4 -0.67 -0.50                                  51.3 1.11                        26%                   --                  -           ++ ++
  94     Hong Kong Utilities                                                                      43,255              1.7       14.4       22.2 -0.06 -0.82                                      9.8 1.06                           8%                -             O                    -            +
  95     Malaysia          Energy                                                                    4,970            1.5       13.4       33.6 -0.17 -0.16                                      4.2 0.94                     16%                     -              +                --                -
  96     India             Real Estate                                                               2,388            0.9       13.0       16.0 -0.47 0.00                                       3.5 0.95                     27%                   O               O                 --                -
  97     Hong Kong Hotels Restaurants & Leisure                                                   25,672              1.0       14.1       14.8 -0.50 -0.45                                  14.9 1.02                        15%                   O                   -              +             O
  98     India             Media                                                                     1,731            5.3       16.9       12.9 -0.33 -0.45                                  18.0 1.05                        17%                     -             O                  +              +
  99     Singapore Telecommunication Services                                                     22,195              5.9       14.1       15.5 -0.67 -0.29                                  21.4 1.05                              7%                -                 -           ++ +
  100 Hong Kong Transportation                                                                       8,726            1.0       15.6       27.7 -0.04 -0.60                                      5.4 0.98                           8%                -             O                 --                -
  101 Japan                Technology Hardware & Equipment                                      169,808               0.9       11.3           9.8 -0.65 -0.70                                   4.9 0.93                     24% ++                                    -             --             --
  102 China                Energy                                                               113,603               1.5            8.7       8.9 -0.67 -0.71                               15.4 0.94                        10%                    +                  -              +             --
  103 Taiwan               Technology Hardware & Equipment                                        97,160              1.4       10.7       11.4 -0.50 -0.71                                  10.7 0.97                        13%                    +                  -             O                 -
  104 Thailand             Energy                                                                 19,189              1.6            8.8   15.2 -0.80 -0.54                                      8.2 0.99                     13%                    +                  -                -              -
  105 Hong Kong Diversified Financials                                                            17,866              0.8            9.8             -0.66 -0.77                                 6.5 0.97                     13%                    +                  -                -              -
  106 Korea                Pharmaceuticals & Biotechnology                                           3,823            2.4       20.1       78.4 -0.20 0.00                                       5.6 1.04                     21%                   --               +                --              +
  107 Korea                Consumer Durables & Apparel                                               8,108            1.5            9.6   12.1 -0.69 -0.69                                  11.2 0.97                        19%                    +                  -             O                 -
  108 China                Technology Hardware & Equipment                                           7,733            1.1            7.4       7.5 -0.83 -0.65                                   8.0 0.89                     17% ++                                    -                -           --
Source: Deutsche Bank, EPS momentum is the number of upward less downward revisions in respective financial year EPS estimate in last 3 months. RSI is the ratio of 65-day to 260-day moving average in stock price. All
the metrics shown above except market cap are median data for the sector. ++ Very favorable, + Favorable, O Neutral, - Unfavorable, Very unfavorable


Deutsche Bank AG/Hong Kong                                                                                                                                                                                                                                                         Page 45
17 October 2012
The Investigator


Figure 110: Bottom-up sector ranking (Rank 1 = Best), continued


                                                                                                                                                                                                              12 month Forward EPS
                                                                                                                                                     FY1 EPS Revisions

                                                                                                                                                                         FY2 EPS Revisions


                                                                                                                                                                                                                                                               Earnings Revisions
                                                                                                   Mkt Cap (U$ mn)


                                                                                                                            12m fwd P/E


                                                                                                                                                                                                                                     expectation


                                                                                                                                                                                                                                                                                    Profitability

                                                                                                                                                                                                                                                                                                    Technicals
                                                                                                                                                                                                                                                   Valuation
                                                                                                                                                                                             ROE (%)
                                                                                                                                           EV/EBIT
                                                                                                                     P/B


                                                                                                                                                                                                        RSI
Rank Country               Sector
  109 Thailand             Materials                                                                 9,958            1.4       10.3       11.1 -0.76 -0.63                                  13.0 1.01                         15%                    +                  -             O              O
  110 China                Insurance                                                              47,571              2.3       13.6                 -0.71 -0.56                             10.6 0.99                         31%                    +                  -             O                 -
  111 Indonesia            Capital Goods                                                             3,416            3.2       15.6           9.1 -1.00 -0.50                               19.1 1.01                         10%                   O                   -           ++ O
  112 Korea                Telecommunication Services                                                3,634            0.8            8.6   15.0 -1.00 -0.80                                      3.8 1.03                      37% ++                                --                --             O
  113 Singapore Food & Staples Retailing                                                             2,477            2.5       15.0       16.3 -1.00 -0.40                                  34.9 0.99                         18%                   O                   -           ++                  -
  114 Korea                Retailing                                                                 6,249            1.2            8.4       8.1 -0.90 -0.70                               10.2 0.94                         16% ++                                --                O              --
  115 China                Capital Goods                                                          26,477              0.9            8.8   10.0 -0.75 -1.00                                  10.8 0.93                         10% ++                                --                O              --
  116 Hong Kong Capital Goods                                                                     24,979              0.8       10.6           8.0 -1.00 -0.80                                   8.1 0.96                            7% ++                           --                   -              -
  117 India                Capital Goods                                                          13,851              2.5       13.4       11.9 -0.60 -0.57                                  13.4 0.99                         15%                   O                   -             O                 -
  118 Hong Kong Semiconductors & Semiconductor Equipment                                             2,285            2.0            7.8       6.9 -1.00 -1.00                               28.0 0.93                         21% ++                                --              ++ - -
  119 Taiwan               Food & Staples Retailing                                                  2,977            1.6       22.6       21.7 -0.40 -0.56                                  17.8 1.02                               8%              --                  -              +             O
  120 Korea                Food & Staples Retailing                                                  4,437            1.0       10.2       10.6 -0.60 -0.80                                      8.9 0.88                      22%                    +                  -                -           --
  121 Japan                Utilities                                                              58,998              0.5     -15.1        53.9       0.07 -0.42                               -0.4 0.76                       30%                   O               O                 --             --
  122 China                Automobiles & Components                                               12,980              1.3            6.8   10.5 -0.83 -0.81                                  15.2 0.91                         17%                    +              --                 +             --
  123 Hong Kong Retailing                                                                         10,035              1.8       11.2           9.4 -0.64 -0.84                               16.9 0.94                         16%                   O                   -              +             --
  124 Indonesia            Energy                                                                    6,341            2.4            9.2   10.0 -0.78 -0.94                                  20.2 0.84                               -8%              +              --              ++ - -
  125 China                Transportation                                                         13,464              0.8            9.1   10.0 -0.84 -0.94                                      8.7 0.91                            8% ++                           --                   -           --
  126 Japan                Hotels Restaurants & Leisure                                           11,560              1.2       10.5       11.4 -1.00 -1.00                                      9.6 1.02                      14% ++                                --                   -           O
  127 Korea                Household & Personal Products                                          10,032              3.9       23.4       19.0 -0.75 -0.33                                      8.4 1.05                      19%                   --                  -                -            +
  128 Indonesia            Materials                                                                 8,406            3.2       13.1       14.4 -0.70 -0.50                                  10.4 1.00                         12%                     -                 -             O              O
  129 Thailand             Food Beverage & Tobacco                                                   3,381            2.6       12.6       17.2 -0.79 -1.00                                  16.7 1.17                         14%                     -             --                 +            ++
  130 Singapore Food Beverage & Tobacco                                                              8,242            2.4       14.4       12.1 -0.95 -0.89                                  15.3 1.07                         12%                   O               --                 +              +
  131 Taiwan               Real Estate                                                               2,399            1.3       10.9       33.2 -1.00 -0.57                                  11.8 1.04                               4%                -             --                O               +
  132 Korea                Diversified Financials                                                 10,246              0.7       10.7                 -0.68 -1.00                                 4.5 0.95                      10%                   O               --                --                -
  133 Korea                Semiconductors & Semiconductor Equipment                             153,775               1.6       10.5       11.8 -0.94 -0.56                                      8.3 0.91                      30%                   O                   -                -           --
  134 China                Materials                                                              29,268              0.9            7.7   11.7 -1.00 -1.00                                      8.9 0.87                      16% ++                                --                   -           --
  135 Taiwan               Automobiles & Components                                                  7,681            1.4       14.2       21.1 -0.67 -1.00                                      7.1 1.04                      16%                     -             --                   -            +
  136 India                Telecommunication Services                                                4,516            2.0       18.0       21.4 -0.60 -0.58                                      4.1 0.87                      25%                     -                 -             --             --
  137 Taiwan               Capital Goods                                                             9,400            1.5       12.6       11.1 -1.00 -1.00                                  10.3 0.97                         10%                   O               --                O                 -
  138 China                Food Beverage & Tobacco                                                22,286              1.5       14.2       17.6 -0.67 -0.88                                      9.3 0.97                      21%                     -                 -                -              -
  139 Taiwan               Retailing                                                                 2,746            2.3       15.0       19.0 -1.00 -1.00                                  14.4 1.01                         17%                   O               --                 +             O
  140 Taiwan               Transportation                                                            4,751            1.2       12.5       22.1 -0.33 -0.80                                      3.9 0.96                      69%                     -                 -             --                -
  141 China                Retailing                                                              15,723              1.4       12.6           8.2 -0.92 -0.92                               13.4 0.83                         15%                   O               --                O              --
  142 Japan                Semiconductors & Semiconductor Equipment                               12,854              0.8       13.2       95.6 -0.43 -0.43                                    -2.2 0.83                       82%                   O               O                 --             --
  143 Taiwan               Materials                                                              50,916              1.4       14.2       16.2 -1.00 -1.00                                      7.1 1.00                      19%                   O               --                   -              -
  144 Korea                Software & Services                                                    15,154              2.7       12.9       17.6 -0.93 -0.43                                  11.4 0.89                         24%                   --                  -             O              --
  145 Singapore Hotels Restaurants & Leisure                                                         6,535            0.9       19.6       21.9 -0.87 -1.00                                      6.6 1.01                      19%                     -             --                   -           O
  146 China                Food & Staples Retailing                                                  7,180            2.3       12.1       13.3 -1.00 -1.00                                  18.1 0.86                         11%                     -             --                 +             --
  147 China                Household & Personal Products                                             6,925            2.4       39.2         (4.8) -1.00 -1.00 -22.3 0.88                                                      31%                   --              --                --             --
Source: Deutsche Bank, EPS momentum is the number of upward less downward revisions in respective financial year EPS estimate in last 3 months. RSI is the ratio of 65-day to 260-day moving average in stock price. All
the metrics shown above except market cap are median data for the sector. ++ Very favorable, + Favorable, O Neutral, - Unfavorable, Very unfavorable


Page 46                                                                                                                                                                                                Deutsche Bank AG/Hong Kong
17 October 2012
The Investigator


Appendix 1
Important Disclosures
Additional information available upon request

For disclosures pertaining to recommendations or estimates made on securities other than the primary subject of this
research, please see the most recently published company report or visit our global disclosure look-up page on our
website at http://gm.db.com/ger/disclosure/DisclosureDirectory.eqsr

Analyst Certification
The views expressed in this report accurately reflect the personal views of the undersigned lead analyst(s). In addition,
the undersigned lead analyst(s) has not and will not receive any compensation for providing a specific recommendation
or view in this report. Ajay Kapur/Ritesh Samadhiya


Equity rating key                                           Equity rating dispersion and banking relationships

Buy: Based on a current 12- month view of total share-          450
holder return (TSR = percentage change in share price           400
                                                                         56 %
from current price to projected target price plus pro-          350
jected dividend yield ) , we recommend that investors           300                           38 %
                                                                250
buy the stock.                                                  200
Sell: Based on a current 12-month view of total share-          150
holder return, we recommend that investors sell the             100           11 %                16 %           5%
                                                                 50                                                    10 %
stock                                                             0
Hold: We take a neutral view on the stock 12-months                        Buy                 Hold                 Sell
out and, based on this time horizon, do not
recommend either a Buy or Sell.
                                                                          Companies Covered     Cos. w/ Banking Relationship
Notes:
                                                                                   Asia-Pacific Universe
1. Newly issued research recommendations and target
prices always supersede previously published
research.
2. Ratings definitions prior to 27 January, 2007 were:
       Buy: Expected total return (including dividends)
       of 10% or more over a 12-month period
       Hold:    Expected     total   return   (including
       dividends) between -10% and 10% over a 12-
       month period
       Sell: Expected total return (including dividends)
       of -10% or worse over a 12-month period


Deutsche Bank AG/Hong Kong                                                                                                 Page47
17 October 2012
The Investigator


Regulatory Disclosures
1. Important Additional Conflict Disclosures
Aside from within this report, important conflict disclosures can also be found at https://gm.db.com/equities under the
"Disclosures Lookup" and "Legal" tabs. Investors are strongly encouraged to review this information before investing.

2. Short-Term Trade Ideas
Deutsche Bank equity research analysts sometimes have shorter-term trade ideas (known as SOLAR ideas) that are
consistent or inconsistent with Deutsche Bank's existing longer term ratings. These trade ideas can be found at the
SOLAR link at http://gm.db.com.

3. Country-Specific Disclosures
Australia and New Zealand: This research, and any access to it, is intended only for "wholesale clients" within the
meaning of the Australian Corporations Act and New Zealand Financial Advisors Act respectively.
Brazil: The views expressed above accurately reflect personal views of the authors about the subject company(ies) and
its(their) securities, including in relation to Deutsche Bank. The compensation of the equity research analyst(s) is
indirectly affected by revenues deriving from the business and financial transactions of Deutsche Bank. In cases where
at least one Brazil based analyst (identified by a phone number starting with +55 country code) has taken part in the
preparation of this research report, the Brazil based analyst whose name appears first assumes primary responsibility for
its content from a Brazilian regulatory perspective and for its compliance with CVM Instruction # 483.
EU      countries:     Disclosures    relating     to   our     obligations   under   MiFiD     can    be   found      at
http://www.globalmarkets.db.com/riskdisclosures.
Japan: Disclosures under the Financial Instruments and Exchange Law: Company name - Deutsche Securities Inc.
Registration number - Registered as a financial instruments dealer by the Head of the Kanto Local Finance Bureau
(Kinsho) No. 117. Member of associations: JSDA, Type II Financial Instruments Firms Association, The Financial Futures
Association of Japan, Japan Investment Advisers Association. Commissions and risks involved in stock transactions - for
stock transactions, we charge stock commissions and consumption tax by multiplying the transaction amount by the
commission rate agreed with each customer. Stock transactions can lead to losses as a result of share price fluctuations
and other factors. Transactions in foreign stocks can lead to additional losses stemming from foreign exchange
fluctuations. "Moody's", "Standard & Poor's", and "Fitch" mentioned in this report are not registered credit rating
agencies in Japan unless “Japan” or "Nippon" is specifically designated in the name of the entity.
Russia: This information, interpretation and opinions submitted herein are not in the context of, and do not constitute,
any appraisal or evaluation activity requiring a license in the Russian Federation.


Page48                                                                                       Deutsche Bank AG/Hong Kong
Deutsche Bank AG/Hong Kong
Asia-Pacific locations
Deutsche Bank AG                                       Deutsche Bank AG                                       Deutsche Equities India Pte Ltd                        Deutsche Securities Inc.
Deutsche Bank Place                                    Filiale Hongkong                                       3rd Floor, Kodak House                                 2-11-1 Nagatacho
Level 16                                               International Commerce Centre,                         222, Dr D.N. Road                                      Sanno Park Tower
Corner of Hunter & Phillip Streets                     1 Austin Road West,Kowloon,                            Fort, Mumbai 400 001                                   Chiyoda-ku, Tokyo 100-6171
Sydney, NSW 2000                                       Hong Kong                                              SEBI Nos: INB231196834                                 Japan
Australia                                              tel: (852) 2203 8888                                   INB011196830, INF231196834                             Tel: (81) 3 5156 6770
Tel: (61) 2 8258 1234                                                                                         Tel: (91) 22 6658 4600


Deutsche Bank (Malaysia)                               In association with                                    Deutsche Securities Korea Co.                          Deutsche Bank AG
Berhad                                                 Deutsche Regis Partners, Inc.                          17th Floor, YoungPoong Bldg.,                          Singapore
Level 18-20                                            Level 23, Tower One                                    33 SeoRin-Dong,                                        One Raffles Quay
Menara IMC                                             Ayala Triangle, Ayala Avenue                           Chongro-Ku, Seoul (110-752)                            South Tower
8 Jalan Sultan Ismail                                  Makati City, Philippines                               Republic of Korea                                      Singapore 048583
Kuala Lumpur 50250                                     Tel: (63) 2 894 6600                                   Tel: (82) 2 316 8888                                   Tel: (65) 6423 8001
Malaysia
Tel: (60) 3 2053 6760
Deutsche Securities Asia Ltd                           In association with                                    In association with
Taiwan Branch                                          TISCO Securities Co., Ltd                              PT Deutsche Verdhana Indonesia
Level 6                                                TISCO Tower                                            Deutsche Bank Building,
296 Jen-Ai Road, Sec 4                                 48/8 North Sathorn Road                                6th Floor, Jl. Imam Bonjol No.80,
Taipei 106                                             Bangkok 10500                                          Central Jakarta,
Taiwan                                                 Thailand                                               Indonesia
Tel: (886) 2 2192 2888                                 Tel: (66) 2 633 6470                                   Tel: (62 21) 318 9541


International locations
Deutsche Bank Securities Inc.                          Deutsche Bank AG London                                Deutsche Bank AG                                       Deutsche Bank AG
60 Wall Street                                         1 Great Winchester Street                              Große Gallusstraße 10-14                               Deutsche Bank Place
New York, NY 10005                                     London EC2N 2EQ                                        60272 Frankfurt am Main                                Level 16
United States of America                               United Kingdom                                         Germany                                                Corner of Hunter & Phillip Streets
Tel: (1) 212 250 2500                                  Tel: (44) 20 7545 8000                                 Tel: (49) 69 910 00                                    Sydney, NSW 2000
                                                                                                                                                                     Australia
                                                                                                                                                                     Tel: (61) 2 8258 1234
Deutsche Bank AG                                       Deutsche Securities Inc.
Filiale Hongkong                                       2-11-1 Nagatacho
International Commerce Centre,                         Sanno Park Tower
1 Austin Road West,Kowloon,                            Chiyoda-ku, Tokyo 100-6171
Hong Kong                                              Japan
Tel: (852) 2203 8888                                   Tel: (81) 3 5156 6770


Global Disclaimer
The information and opinions in this report were prepared by Deutsche Bank AG or one of its affiliates (collectively "Deutsche Bank"). The information herein is believed to be reliable and has been obtained from public
sources believed to be reliable. Deutsche Bank makes no representation as to the accuracy or completeness of such information.
Deutsche Bank may engage in securities transactions, on a proprietary basis or otherwise, in a manner inconsistent with the view taken in this research report. In addition, others within Deutsche Bank, including
strategists and sales staff, may take a view that is inconsistent with that taken in this research report.
Opinions, estimates and projections in this report constitute the current judgement of the author as of the date of this report. They do not necessarily reflect the opinions of Deutsche Bank and are subject to change
without notice. Deutsche Bank has no obligation to update, modify or amend this report or to otherwise notify a recipient thereof in the event that any opinion, forecast or estimate set forth herein, changes or
subsequently becomes inaccurate. Prices and availability of financial instruments are subject to change without notice. This report is provided for informational purposes only. It is not an offer or a solicitation of an
offer to buy or sell any financial instruments or to participate in any particular trading strategy. Target prices are inherently imprecise and a product of the analyst judgement.
As a result of Deutsche Bank’s March 2010 acquisition of BHF-Bank AG, a security may be covered by more than one analyst within the Deutsche Bank group. Each of these analysts may use differing methodologies
to value the security; as a result, the recommendations may differ and the price targets and estimates of each may vary widely.
In August 2009, Deutsche Bank instituted a new policy whereby analysts may choose not to set or maintain a target price of certain issuers under coverage with a Hold rating. In particular, this will typically occur for
"Hold" rated stocks having a market cap smaller than most other companies in its sector or region. We believe that such policy will allow us to make best use of our resources. Please visit our website at
http://gm.db.com to determine the target price of any stock.
The financial instruments discussed in this report may not be suitable for all investors and investors must make their own informed investment decisions. Stock transactions can lead to losses as a result of price
fluctuations and other factors. If a financial instrument is denominated in a currency other than an investor's currency, a change in exchange rates may adversely affect the investment. Past performance is not
necessarily indicative of future results. Deutsche Bank may with respect to securities covered by this report, sell to or buy from customers on a principal basis, and consider this report in deciding to trade on a
proprietary basis.
Unless governing law provides otherwise, all transactions should be executed through the Deutsche Bank entity in the investor's home jurisdiction. In the U.S. this report is approved and/or distributed by Deutsche
Bank Securities Inc., a member of the NYSE, the NASD, NFA and SIPC. In Germany this report is approved and/or communicated by Deutsche Bank AG Frankfurt authorized by the BaFin. In the United Kingdom this
report is approved and/or communicated by Deutsche Bank AG London, a member of the London Stock Exchange and regulated by the Financial Services Authority for the conduct of investment business in the UK
and authorized by the BaFin. This report is distributed in Hong Kong by Deutsche Bank AG, Hong Kong Branch, in Korea by Deutsche Securities Korea Co. This report is distributed in Singapore by Deutsche Bank AG,
Singapore Branch, and recipients in Singapore of this report are to contact Deutsche Bank AG, Singapore Branch in respect of any matters arising from, or in connection with, this report. Where this report is issued or
promulgated in Singapore to a person who is not an accredited investor, expert investor or institutional investor (as defined in the applicable Singapore laws and regulations), Deutsche Bank AG, Singapore Branch
accepts legal responsibility to such person for the contents of this report. In Japan this report is approved and/or distributed by Deutsche Securities Inc. The information contained in this report does not constitute the
provision of investment advice. In Australia, retail clients should obtain a copy of a Product Disclosure Statement (PDS) relating to any financial product referred to in this report and consider the PDS before making any
decision about whether to acquire the product. Deutsche Bank AG Johannesburg is incorporated in the Federal Republic of Germany (Branch Register Number in South Africa: 1998/003298/10). Additional information
relative to securities, other financial products or issuers discussed in this report is available upon request. This report may not be reproduced, distributed or published by any person for any purpose without Deutsche
Bank's prior written consent. Please cite source when quoting.
Copyright © 2012 Deutsche Bank AG


GRCM2012PROD027185

Db investigator strategy 121017

  • 1.
    Deutsche Bank Markets Research Asia Strategy Date 17 October 2012 The Investigator Strategy Update Ajay Kapur, CFA Policy Uncertainty – The Financial Strategist (+852) 2203 6196 World's Dominator ajay.kapur@db.com Ritesh Samadhiya, CFA Elevated Economic Policy Uncertainty – about to drop? We might be at an important inflection point in the financial markets. The elevation of Strategist Economic Policy Uncertainty, since 2008, to twice the level of the previous 23 years has (+852) 2203 6251 increased the equity risk premium, diminished the opportunity set for stock-picking, and ritesh.samadhiya@db.com favored defensive stocks over cyclicals. Finance professionals and investors may have wrongly concluded that this state of affairs will be prolonged and enduring. We think this Absolute Return Drivers status quo view is wrong, and that we could be at a turning point, and that economic Current Account Balance/GDP policy uncertainty has probably peaked. Let the profitable boredom begin! US Political Polarization at 130-year high Sentiment (Risk-Love) Political polarization might just recede with this coming US election. Financial Total Score (current) Real Exchange Rate deregulation – a key driver of complexity, the consequent compensation premium in the Total Score (last) financial sector, the rise in the ratio of bank fee income to total income, and income inequality, all likely peaked together in 2008. Any potential reduction in political Technicals Valuation polarization will likely involve compromise, less policy uncertainty, and a lower likelihood Liquidity Growth of policies being overturned with every election. Policy Economic Policy Uncertainty highly correlated with poor stock-picking efficacy Economic Policy Uncertainty is a function of media mentions of the issue, laws dropping China 8 -2 off the books, and economic forecast dispersion. The correlation coefficient between Hong Kong -2 -2 Economic Policy Uncertainty and stock-picking efficacy was only 0.09 between 1985 and Indonesia 1 0 2007. Since then it has jumped to 0.74. As a stock-picker, you want Economic Policy India 4 3 Uncertainty to fall. Adjusted for portfolio volatility, the stock-picking opportunity will Korea 6 -3 become much wider if uncertainty drops. Malaysia 2 3 Economic Policy Uncertainty is highly correlated with equity risk premium and Philippines 5 0 defensives over cyclicals Singapore -2 4 From 1985 to 2007, there was NO relationship between the two, a correlation coefficient Thailand 4 6 of -0.07. Since 2008, however, the correlation coefficient between policy uncertainty and Taiwan 1 0 equity risk premium has shot up to 0.67! Presumably, stocks are “cheap” compared with Asia ex-Japan 4 -2 bonds, since policy is uncertain, the impact on cash flows is uncertain and, as the most Japan 2 -4 junior entity in the capital structure, stocks need to be cheap to compensate for this policy uncertainty. Economic Policy Uncertainty probably peaking out globally: huge implications Our model portfolio is available as a DB In the US, a 130-year peak in political polarization and an important election on what to do about this polarization should help resolve things one way or another. Whatever the thematic basket (DBHKASTR). outcome of the election, another four years of peak political polarization is not what the electorate is voting for. In Europe, there is still a long way to go on reducing policy uncertainty on the part of governments, north and southern Europe, and within provinces in countries, but the ECB’s views are quite clear, agree or disagree with them. In China, the important political transition that occurs once in a decade will soon be over. Governance and policy – the work of government – can then get renewed attention. In India, after a period of lethargy, the government has recently been invigorated and policy has come unstuck. Of course, this is all speculation and could be wrong, but not having a view on the direction of Policy Uncertainty is NOT an option for financial professionals, given its salience. We are adding Top Glove Corp Bhd, Korea Zinc Co Ltd., Ace Hardware and Shree Cement Ltd to the model portfolio. The model portfolio is up 23.1% YTD vs. 13.3% for MSCI AXJ. ________________________________________________________________________________________________________________ Deutsche Bank AG/Hong Kong All prices are those current at the end of the previous trading session unless otherwise indicated. Prices are sourced from local exchanges via Reuters, Bloomberg and other vendors. Data is sourced from Deutsche Bank and subject companies. Deutsche Bank does and seeks to do business with companies covered in its research reports. Thus, investors should be aware that the firm may have a conflict of interest that could affect the objectivity of this report. Investors should consider this report as only a single factor in making their investment decision. DISCLOSURES AND ANALYST CERTIFICATIONS ARE LOCATED IN APPENDIX 1. MICA(P) 072/04/2012.
  • 2.
    17 October 2012 TheInvestigator Table Of Contents Policy Uncertainty – The Financial World’s Dominator ..................................................... 3  Asia Model Portfolio update ............................................................................................... 8  Country selection .............................................................................................................. 15  Country-sector selection .................................................................................................. 16  Asia Model Portfolio ......................................................................................................... 20  Global – valuation ............................................................................................................. 21  Global metrics ................................................................................................................... 22  Global metrics (continued) ............................................................................................... 23  Global – market intelligence ............................................................................................. 24  Global – market intelligence (continued) .......................................................................... 25  Asia – valuation ................................................................................................................ 26  Asia – investor sentiment ................................................................................................. 27  Asia – technicals ............................................................................................................... 28  Asia – growth and earnings.............................................................................................. 29  Asia – liquidity .................................................................................................................. 30  Asia – factor performance ................................................................................................ 31  Asia – market intelligence ................................................................................................ 33  Japan – valuations ............................................................................................................ 34  Japan – investor sentiment .............................................................................................. 35  Japan – technicals ............................................................................................................ 36  Japan – growth and earnings ........................................................................................... 37  Japan – liquidity ................................................................................................................ 38  Japan – factor performance ............................................................................................. 39  Japan – market intelligence.............................................................................................. 40  Companies Mentioned ..................................................................................................... 41  Appendix A ................................................................................... 42  Page 2 Deutsche Bank AG/Hong Kong
  • 3.
    17 October 2012 TheInvestigator Policy Uncertainty – The Financial World’s Dominator The only thing that matters – policy uncertainty and polarization We contend that the main driver of the level of equity markets, the relative performance of risk assets versus “safe” assets, and the potential opportunity for stock-pricing – pretty much what defines a finance professional’s life – are increasingly determined by just one primary factor. The rest of it – all those company meetings, the travel, spreadsheets, conferences and broker research reports – are less salient compared to this one factor. This is a bold claim. So what is this salient, primary factor? And can we prove our contention? It is, in our view, Policy Uncertainty. A few academics have quantified this for the US and Europe, and we will try to prove our point regarding its link with changes in the equity risk premium, the relative performance of risky versus “safe assets” and the stock-picking opportunity set. We will also speculate that Policy Uncertainty in the world is about to downshift remarkably from current ungainly elevated levels. If we are right, this will have hugely positive implications for equities, risk assets and the opportunities for stock-picking. So far, since the financial crisis broke out, Policy Uncertainty has been at twice the level of the previous 23 years, keeping the equity risk premium high, challenging risky assets versus “safe assets”, and rendering stock-picking opportunities exceptionally tough. All that might be about to change. But first a quick point on political polarization in the USA, where we have the data. As Figure 1 shows, political polarization in the USA, proxied by how often Republicans vote similarly to one another, as do Democrats, is at a record high since 1880! It is like two sullen adults sitting at opposite ends of a see-saw, looking away from each other. With that degree of entrenched polarization, it is tough to get policies passed, and a malodorous air of policy inaction and uncertainty hangs heavy in the land. Note in Figure 1 how policy polarization correlates well with income inequality (or plutonomy). (Interested readers in the concept of political polarization should go to http://www.slate.com/articles/life/do_the_math/2001/12/growing_apart.single.html, The Mathematical Evidence for Congress’ Growing Polarization by Jordan Ellenberg1.) Our humble contention is that time-series that are at 130-year extremes are most likely to mean revert, however fanciful that might seem at the time of the extreme. In other words, political polarization might just recede with this coming US election. Financial deregulation – a key driver of complexity, the consequent compensation premium in the financial sector, the rise in the ratio of bank fee income to total income, and income inequality, all likely peaked together in 2008. Any potential reduction in political polarization will likely involve compromise, less policy uncertainty, and less of a likelihood of policies being overturned with every election. As Figure 2 shows, more policy certainty would diminish one key headache for business. Economic Policy Uncertainty Scott Baker, Nick Bloom and Steven Davis at Stanford have constructed Economic Policy Uncertainty indices for the US, Europe and Canada. For the US, in their words: To measure policy-related economic uncertainty, we construct an index from three types of underlying components. One component quantifies newspaper coverage of policy-related economic uncertainty. A second component reflects the number of federal tax code provisions set to expire in future years. The third component uses disagreement among economic forecasters as a proxy for uncertainty. The first component is an index of search results from 10 large newspapers. The newspapers included in our index are USA Today, the Miami Herald, the Chicago Tribune, the Washington Post, the Los Angeles Times, 1 Also see the original authors’ work at http://voteview.com/Polarized_America.htm#MPRBOOK Deutsche Bank AG/Hong Kong Page 3
  • 4.
    17 October 2012 TheInvestigator the Boston Globe, the San Francisco Chronicle, the Dallas Morning News, the New York Times, and the Wall Street Journal. From these papers, we construct a normalized index of the volume of news articles discussing economic policy uncertainty of some type. The second component of our index draws on reports by the Congressional Budget Office (CBO) that compile lists of temporary federal tax code provisions. We create annual discounted numbers of tax code provisions scheduled to expire for each year, giving a measure of the level of uncertainty regarding the path that the federal tax code will take in the future. The third component of our policy-related uncertainty index draws on the Federal Reserve Bank of Philadelphia's Survey of Professional Forecasters. Here, we utilize the dispersion between individual forecasters' predictions about future levels of the Consumer Price Index, Federal Expenditures, and State and Local Expenditures to construct indices of uncertainty about policy-related macroeconomic variables. (From their website, www.policyuncertainty.com) Figure 1: US: record political polarization and income inequality – about to reverse? 1.2 20 Higher 1.1 18 Polarization 1.0 16 0.9 14 0.8 12 0.7 10 0.6 8 0.5 0.4 6 House Polarization, LS 0.3 Senate Polarization, LS 4 Income share of the top 1% (excluding capital gains), RS 0.2 2 1879 1899 1919 1939 1959 1979 1999 Source: Deutsche Bank. Polarization is measured as difference in party means - first dimension. http://voteview.com/Polarized_America.htm Figure 2: US: Economic Uncertainty a huge problem Source: NFIB Figure 3 shows the US, European and Canadian Economic Policy uncertainty indices. We will use the US version for our arguments here. Figure 4 shows the US Economic Page 4 Deutsche Bank AG/Hong Kong
  • 5.
    17 October 2012 TheInvestigator Policy Uncertainty Index alongside the average US stock performance correlations with the MSCI USA benchmark (a proxy for the potential efficacy of stock picking. If stocks all move in the same direction with the benchmark, it reduces the efficacy of stock- picking, once we adjust for portfolio volatility). A few things stand out. As the inventors of the index note, US Economic Policy Uncertainty since 2007 has been at twice the level of the prior 23 years. As Figure 4 also shows, the relationship between Economic Policy Uncertainty and the stock-picking opportunity set has increased markedly since 2008. The correlation coefficient between Economic Policy Uncertainty and stock- picking efficacy was only 0.09 between 1985 and 2007. Since then, it has jumped to 0.74. If you are a stock-picker, you want Economic Policy Uncertainty to subside, big time. Adjusted for portfolio volatility, the stock picking opportunity will become much wider, and life presumably a bit less stressful. Having a view on Economic Policy Uncertainty is critical. Figure 3: Economic Policy Uncertainty has been elevated since 2008, about to drop? 300 300 US Economic Policy Uncertainty Index 250 European Economic Policy Uncertainty Index High policy 250 uncertainty Canadian Economic Policy Uncertainty Index 200 200 150 150 100 100 50 50 0 0 1/85 1/88 1/91 1/94 1/97 1/00 1/03 1/06 1/09 1/12 Source: Deutsche Bank, Scott Baker, Nick Bloom and Steven Davis (www.policyuncertainty.com) Figure 4: Economic Policy Uncertainty and stock correlations with the benchmark move together. Stock-picking to become more potent as Policy Uncertainty drops 0.9 Average US stock performance (60 trading days) EU credit crisis 300 correlations with MSCI USA, LS Lehman Failure 0.8 87 crash US Economic Policy Uncertainty measure, RS 250 0.7 Worldcom Scandal High High policy economic uncertainty 0.6 LTCM 200 policy US recession uncertainty Asian 0.5 Crisis 150 0.4 0.3 100 Macro-driven market, 0.2 correlation 0.74 50 0.1 Stock-pickers market, correlation 0.09 0.0 0 1/86 1/88 1/90 1/92 1/94 1/96 1/98 1/00 1/02 1/04 1/06 1/08 1/10 1/12 Source: Deutsche Bank, Stock correlations with MSCI USA based on rolling 60-day daily returns on a broad universe of stocks covering the top 95% of total market capitalization (i.e.1,053 to 2,684 stocks from 1985 to 2012). For more on the “Economic Policy Uncertainty Index”, go to the website http://policyuncertainty.com. According to the authors, “To measure policy-related economic uncertainty, we construct an index from three types of underlying components. One component quantifies newspaper coverage of policy-related economic uncertainty. A second component reflects the number of federal tax code provisions set to expire in future years. The third component uses disagreement among economic forecasters as a proxy for uncertainty.” Figure 5 shows the relationship between the US Economic Policy Uncertainty index and the equity risk premium (the higher it is, the “cheaper” stocks are versus bonds). From 1985 to 2007, there was NO relationship between the two, a correlation coefficient of - 0.07. Since 2008, however, the correlation coefficient between policy uncertainty and Deutsche Bank AG/Hong Kong Page 5
  • 6.
    17 October 2012 TheInvestigator the equity risk premium has shot up to 0.67! Presumably, stocks are “cheap” compared with bonds, since policy is uncertain, the impact on cash flows is uncertain and, as the most junior entity in the capital structure, stocks need to be cheap to compensate for this policy uncertainty. Logically, if the correlation holds and there is a substantial decline in policy uncertainty, the equity risk premium could decline in tandem – stocks would beat bonds massively. Having a view on Economic Policy Uncertainty is critical. How about defensive sectors versus cyclicals? Does US Economic Policy Uncertainty have any role here? Yes. As Figure 6 shows, changes in US Economic Policy Uncertainty relate well with changes in the relative performance of defensives versus cyclicals. The correlation coefficient has doubled from 0.33 between 1985-2007 and 2008 now. As policy uncertainty rises, there is an unsurprising rush to defensives, and vice versa. Again, this relationship has been a lot more salient since 2008. Having a view on Economic Policy Uncertainty is critical. Figure 5: Equity Risk Premium and Economic Policy Uncertainty have moved in lock- step since 2008. Unlocking equity risk premium if Policy Uncertainty drops 250 8% High policy 230 US Economic Policy Uncertainty Index, uncertainty 3mma, LS 6% 210 Equity Risk Premium (S&P500 earnings 4% 190 yield less 10yr bond yield), RS 170 2% 150 0% 130 110 -2% Correlation 0.67 90 Correlation -0.07 -4% 70 50 -6% 1/85 1/87 1/89 1/91 1/93 1/95 1/97 1/99 1/01 1/03 1/05 1/07 1/09 1/11 1/13 Source: Deutsche Bank Figure 6: Defensives versus Cyclicals ( or risk-off versus risk-on) moves with changes in Economic Policy Uncertainty 80% Economic Policy Uncertainty, 6m change, LS 80% 60% US defensive sectors / cyclical sectors, 6 month change, RS 60% 40% 40% 20% 20% 0% 0% 1/85 1/87 1/89 1/91 1/93 1/95 1/97 1/99 1/01 1/03 1/05 1/07 1/09 1/11 1/13 -20% -20% -40% Correlation 0.33 Correlation 0.68 -40% -60% Defensive sectors are Consumer staples, -60% healthcare, utilities and telecom. -80% -80% Source: Deutsche Bank. Defensive sector price index is from Datastream while MSCI CYC Index is used for cyclicals. So what is our view on Policy Uncertainty globally? We can only speculate on this, but it is important to do so. In the US, a 130-year peak in political polarization and an important election on what to do about this polarization should help resolve things one way or another. Whatever the outcome of the election, we think it’s safe to say that another four years of peak political polarization is not what the electorate is hoping for. The party that loses is unlikely to find recalcitrance and obstructionism a future vote- gathering strategy, in our view. Of course, we could be wrong and the logjam, the Page 6 Deutsche Bank AG/Hong Kong
  • 7.
    17 October 2012 TheInvestigator polarization, the policy uncertainty could go on for longer. In Europe, the ECB approved its aggressive bond-buying plan with just one dissenter. While there is still a long way to go on reducing policy uncertainty on the part of governments, north and southern Europe, and within provinces in countries, the ECB’s views are quite clear, agree or disagree with them. In China, the important political transition that occurs once in a decade will soon be over. A renewed focus on governance and policy – the work of government – can then begin. In India, after a period of lethargy, the government has recently been invigorated and policy has come unstuck. With the passage of time since the outbreak of the financial crisis, there is early empirical evidence in the "austerity versus fiscal spending" debate. 2 As more time elapses and more empirical results reveal themselves, we believe policy uncertainty will likely diminish. Policymakers and voters will be better informed about the consequences of opposing policy choices. Thus, the menu of successful policy options will likely shrink – there should be less uncertainty about the "right" policy course. Our simple read is that the substantial elevation of policy uncertainty around the world is probably coming to an end. The confusion of policymakers in facing the rather unique challenges of a once-in-seventy-years potential debt deflation was understandable. It is by no means all blue skies from here, but policymakers and politicians are both learning what is “working”, and what is not. Electorates are making choices about the direction they want to go in, rather than the logjam of the past five years. Debtors and creditors always fight about loss allocation in a debt crisis – time is the only healer that can bring them together, however reluctantly. That time seems to be approaching. Again, this is simple expectation on our part, and we could be plain wrong. But we stress that not having a view on the direction of Policy Uncertainty is NOT an option for financial professionals. In sum, we might be at an important inflection point in financial markets. The elevation of Economic Policy Uncertainty since 2008 has elevated the equity risk premium, diminished the opportunity set for stock-picking, and favored defensive stocks over cyclicals. The mindset of finance professionals and investors might have wrongly concluded that this state of affairs is going to be prolonged and enduring – that bonds are better than stocks, that stock-picking is ruinously counter-productive in this “macro- driven” market, and that defensives are superior investments to cyclicals. This view implies a continued elevated level of global Economic Policy Uncertainty. We think this status quo view is wrong, and that we could be at a turning point, and that economic policy uncertainty has probably peaked. Let the profitable boredom begin! 2 See the latest IMF World Economic Outlook, Coping with High Debt and Sluggish Growth and Fiscal Policy in a Depressed Economy by Lawrence H. Summers and J. Bradford DeLong. (www.brookings.edu/~/.../2012_spring_BPEA_delongsummers.pdf) Deutsche Bank AG/Hong Kong Page 7
  • 8.
    17 October 2012 TheInvestigator Asia Model Portfolio update We are removing Hyundai Motor Co, Hyundai Mobis, Simplo Technology Co Ltd and Starhub Ltd. Hyundai Motor and Hyundai Mobis have dropped to the fourth and third quintile respectively in our multifactor stock ranking model. Hyundai Motor looks weaker (relative to the region) on profitability, growth and earnings momentum. Hyundai Mobis is now looking expensive and has lower earnings momentum. Simplo Technology faded on price momentum, earnings momentum and consensus rating metrics. We are cutting Singapore on poor earnings revisions and dropping Starhub from the model portfolio. We are adding Top Glove Corp Bhd, Korea Zinc Co Ltd, Ace Hardware and Shree Cement Ltd. Top Glove ranks highly on valuation, earnings and price momentum. Korea Zinc looks better on profitability, earnings, price momentum and earnings quality. Ace hardware, though looking expensive, scores well on profitability, growth, earnings and price momentum. Shree Cement looks good on profitability, earnings, price momentum and consensus analyst rating. For factor description, see appendix A. Top Glove Corp Bhd (TOPG MK) Outlook remains positive; reiterating Buy. Disciplined capacity expansion plans, expectations of leveling raw material prices as a result of higher rubber production in ASEAN and slower consumption growth globally, as well as resilient demand for rubber gloves for medical and hygiene purposes should drive multi-year growth for the sector and allow Top Glove to generate two-year (FY13-15E) net profit CAGR of 14%, in our view. We reiterate our Buy recommendation with a price target of RM6.05/share, implying a total return of 21%. (Michelle Foong, 12 October 2012) Korea Zinc Co Ltd (010130 KS) Gold/silver price forecast upgrades affect Zijin/Zhaojin/Korea Zinc. Deutsche Bank’s global commodity team has upgraded its gold/silver price forecasts by 2.4% for 2013 and 11.1% for 2014 in light of further central bank action to expand monetary conditions. The most relevant stocks in Asia ex-Japan are Zijin, Zhaojin and Korea Zinc (50% revenue exposure). We raise Zijin/Zhaojin/Korea Zinc’s 2013E earnings by 2.4%/5.1%/1.5%, respectively. Our DCF valuation method differentiates Zijin (Buy) from Zhaojin (downgrade from Buy to Hold), with target price upgrades at 5.6% and 8.3%, respectively. We believe the bullishness on the gold price has been factored into Zhaojin’s share price, after a 36% rally in the past month. We roll over Korea Zinc’s target price to 2013-based and raise it by 24%. Overall, Zijin and Korea Zinc stand out after the upgrades, with their target prices now implying 20% and 27% upside potential. (Chanwook Park, 4 October, 2012) Ace Hardware (ACES IJ) Consistently delivering strong growth and aggressive expansion. We believe that Ace Hardware Indonesia will continue to deliver strong growth as it is one of the best proxies for the expanding middle class, enjoying a forecast earnings CAGR of 22% over the next three years. Management has a strong operational and financial track record, delivering a sales CAGR of 32% on expansion of 21% over the past three years. We believe the company is on track to have 100 stores in the next three years, which is a 43% increase. Maintaining Buy with new DCF-based target price of Rp8,000 (from Rp5,000). (Reggy Susanto, 28 September, 2012) Shree Cement (SRCM IN) A high FCF yield of over 9% in FY13e, EBITDA CAGR of 27% over FY12-FY14e, driven by improving realizations and attractive valuations of 6.6x FY13e EV/EBITA, and a ~30% discount to large cap peers makes us confident of continued outperformance from the stock despite a 37% rise in the stock price over the past three months. (Harshad Katkar, 16 October, 2012) Page 8 Deutsche Bank AG/Hong Kong
  • 9.
    17 October 2012 TheInvestigator Summary Global High policy uncertainty, and the attendant flight from junior tranches of the capital structure, along with a dismal prior decade of equity returns keeps them “cheap”. Reduced policy uncertainty and losses from bond portfolios are likely to be required as catalysts to unlock value in equities. Despite all the despair about global growth, our own mother of all leading indicators (MOMLI) is looking up, as are asset-price-based opinions on global growth. Meanwhile, analysts have lost confidence and are looking for just 5% EPS growth globally in 2012, and 12% for 2013. Global Risk-Love (sentiment) has now entered euphoria, a slight concern. The global Tape is very strong, and the Marshallian K is rising. Asia Asian valuations are moderately below historical averages. The problem is margins – in China they seem to be in a secular decline, while in India they seem to be at a cyclical low. The region cannot rely on asset turns and leverage – both at global levels – to boost relative ROEs compared with the world. It is probably going to have to be EBIT margin expansion that gets the PB up. We don’t see any substantial decline in the cost of equity to boost PB multiples. Risk-love in Asia is at neutral. Technicals are improving – new highs are rising, and new lows have almost vanished. Asia’s leading economic indicators are bottoming, and policy is no longer being tightened. Analysts have taken the knife to this year’s EPS growth forecasts from around 13% at the start of the year to 5% now. We think that EPS revisions and economic surprises are about bottoming now. New issuance and secondaries have been paltry – a good positive contrarian indicator. Foreign fund flows have resumed in earnest as markets have rallied. Value strategies and high profitability have done well this year, while high projected growth stocks have been punished. Japan Japanese stocks continue to look undervalued versus history. A return to credible inflation and higher nominal GDP growth globally is required to unlock value. Recent tensions with China are unhelpful for risk assets in Japan. Sentiment is at neutral levels. Technicals are mixed. Economic surprises are nasty and mean-reverting. They are probably going to get less bad. EPS revisions continue to slide. Fund flows are weak and the market continues to underperform the world as US 10-year bond yields remain suppressed. Value remains the long-term winner. China (neutral) China’s valuations look “cheap” compared with history and are at fair value on our PB ROE less COE model. However, on prospective ROEs of around 7% in three years’ time and COE of around 10%, the current PB of 1.4 is substantially overvalued. Monetary reflation could lift the current multiple, but the long-term deterioration in EBIT margins is the key challenge to a re-rating. Sentiment is at neutral. Worryingly, turnover/market cap is plumbing new depths. Once the political transition is done, and policy making, reflation and market-supportive steps are likely taken, sentiment and pathetic turnover might perk up. Technicals are weak. Policy is tightening via the currency, and weak monetary growth. Real interest rates for corporates are rising with the corporate price deflator contracting yoy. EPS revisions keep dropping as do EPS growth forecasts for 2012 and 2013. We are watching carefully for EPS revisions to hook up. The good news is that the credit multiplier is rising yoy, and the market is responsive to this indicator. The bad news is that the gap between M1 and M2 growth is still weak and correlates with the PB multiple. We need to see a more credible reflation to see the market make Deutsche Bank AG/Hong Kong Page 9
  • 10.
    17 October 2012 TheInvestigator strong upward moves. Earnings revisions and momentum, together with analyst opinions are being rewarded this year, while value investing has been patchy. Hong Kong (neutral) Hong Kong equities are at fair value compared with history, and about in the middle of the pack compared with the other Asian markets. Sentiment has rebounded from the panic levels earlier this year. Turnover to market capitalization is still anemic, but we are encouraged by the rise in the gap between M1 and M2 growth. Technicals have improved since the summer. Policy seems to be tightening (even as real interest rates are quite negative), and EPS revisions are still quite weak. The EPS growth forecast for 2012 has collapsed – the sign changed from an expected +12% earlier this year to -12% growth expected now! For next year, EPS growth is expected at 10%. Inflation is making the real effective exchange rate less competitive, and the yield curve is flat. A good dose of monetary reflation in China is required to turn liquidity up. Negative real interest rates are here to stay in HK for longer than anyone recognizes. Value and low risk styles have been exceptional performers this year. India (overweight) Despite the recent run-up, the market is still undervalued on EV/Sales, EV/EBITDA and PB compared with history. On other metrics, like trailing PE and dividend yield, it is at long-term averages. On our PB versus ROE less COE model it is at fair value, and needs for ROEs to rise and/or COEs to fall – likely if the RBI cuts rates as the Rupee strengthens. Risk-love has perked up from panic in May to neutral now. Meeting with scores of clients around the world, however, we think there is still considerable skepticism about the market. With the recent rally, technicals have improved. The downgrade to GDP growth by the IMF is unfathomable to us simpletons. The leading indicator from the OECD has been rising for months, and the EPS revisions trajectory has also been improving for months. Our policy indicator has curled up with the weakness in the Rupee. Looking ahead, we expect the monetary base to start growing from its paltry 4% yoy rate, as net foreign asset growth resumes on the back of reforms and confidence. EPS growth projections for next year, at 12-14%, are reasonable. The monetary base growth at 4.4% is anemic. The lack of net foreign asset growth is being compensated by a substantial increase in net RBI lending to government. This is a vicious cycle that needs to be broken, and probably will be, if reform momentum is maintained. The yield curve is no longer negative, but is still flat as a chapatti. Value and EPS momentum have been rewarded well this year. Stick with them. Indonesia (neutral) Valuations are at fair levels compared with history. We are a bit concerned about the decline in Indonesia’s EBIT margins. Maintaining premium valuations to the region requires maintaining premium ROEs to the region. Having almost doubled capex/GDP in the past few years, and as it is exposed to any slowdown in nominal GDP growth in China, keep an eye on declining margins in Indonesia. Indonesia has gone from the poster child of solid macro policy last year to one that is perceived as having less than optimal policies – interest rates cut “too soon”, etc. We didn’t understand either position. Indeed, it seems that other EM central banks are now following BI in cutting interest rates to combat slower growth. Maybe BI is a lot smarter than the gallery of critics assumes. We think policy easing makes sense (unlike consensus) – real economy data is coming in really weak, EPS revisions are negative (but recovering), and EPS growth expectations have collapsed from 17% a few months ago to just 8% now for calendar 2012. Inflation, a lagging indicator, is stable at the 4%-ish level. The currency is more competitive in real effective terms, free liquidity is booming and the yield curve is flat-ish. Value and EPS mo are king here. The rest are not really adding alpha this year. Page 10 Deutsche Bank AG/Hong Kong
  • 11.
    17 October 2012 TheInvestigator Korea (underweight) The market is at fair value compared with its history, but cheap compared with other markets on a snapshot basis. This is a low ROE, low EBIT margin market, and is likely to remain a low PB market unless ROEs rise sharply. Interestingly, unlike China, Taiwan and Singapore, where margins have been in secular decline, and ROEs have been goosed by rising asset turns and leverage (this has also been happening in Malaysia and Indonesia recently), in Korea this is not happening. EBIT margins and ROEs move together – albeit at low levels. We think this deserves a higher multiple than currently obtained. We think investors in the other markets might be suffering from “ROE illusion”, implying very strong nominal GDP growth and more leverage – both unlikely. Sentiment is just shy of neutral. Technicals are a lot stronger than overall market performance suggests. Close to a record percentage of stocks are making 52-week highs. The leading economic indicator has been rising persistently for many months now, but EPS revisions are still in the doldrums. Implication: margins are under continued pressure. The terms of trade are improving and we expect this to feed through to improving margins and EPS revisions soon. The yield curve is flat, and flattening. Value has made a massive comeback in the past six months. Price and EPS mo have been disasters this year. Stock-picking in Korea based on style is very tricky because the factors go in and out of style with a head-spinning intensity. Malaysia (neutral) Malaysian equities are undervalued versus history but quite expensive versus the other markets on a relative basis. As in Indonesia, we are concerned about the sharp drop in EBIT margins, even as ROEs remain stable. Risk-Love is quite high, just shy of euphoria. Technicals are neutral. The EPS revisions index has collapsed and EPS growth numbers are being taken down for 2012. Price and EPS mo, along with ROE have been rewarded this year. But value has been tepid. Philippines (neutral) The market is expensive compared with its history and versus other markets in the region. We like that the EBITs and ROEs move together, so there is no leverage or asset turnover-driven “ROE illusion”. Also, years of under-investment imply many years of strong EBIT margins (unlike say in China, or maybe even Indonesia). Sentiment has come off from the euphoria of the summer to neutral now. The leading economic indicator is rising, and we expect EPS revisions to do the same. This is a requirement in order to maintain its premium valuations. Value, a perennial king in Philippine alpha generation, continues to do well, as do EPS revision strategies. Singapore (neutral) The market is cheap compared with history, but fairly valued compared with other regional markets. EBIT margins are in secular decline, and maintaining ROEs will rely on continued improvements in asset turnover and leverage. Sentiment is in mild euphoria. Technicals are super-strong, with close to a record percentage of stocks making 52- week highs. EPS growth projections for both 2012 and 2013 remain lackluster. Earnings revisions also look weak. The good news is that the terms of trade are now picking up nicely, so margins are likely to get a boost. Only stability and low risk factors are generating alpha. Value strategies are mixed, but momentum strategies have destroyed alpha this year. Taiwan (underweight) The market is a serial underperformer versus the region. EBIT margins are in secular decline, and the high asset turnover is running into gravity now. Risk-love is in the tank. EPS revisions are worsening, but there is hope. The terms of trade have gone vertical and project rising EPS momentum. Given poor sentiment, and an impending improvement in EPS growth projections, we need to keep an eye on the underweighted Deutsche Bank AG/Hong Kong Page 11
  • 12.
    17 October 2012 TheInvestigator market. This tech-heavy market is respecting price momentum and stocks supported by analysts. Thailand (overweight) The market is fairly valued versus history and the region. The exception is PB – where the market is at record premiums to the region. Could that be a reward for the solid ROEs (driven not by EBIT margins but asset turns)? Sentiment is neutral. Technicals are super-strong. About a quarter are making 52-week highs. Growth-leading indicators are still strong, even as incoming data have been weak. Analysts have dropped projected 2012 EPS growth forecasts from 23% earlier his year to about 15% now. Also, we are comforted with the rise in the terms of trade that should be supportive of margins and EPS growth going forward. Value has been a disaster this year, while price and EPS momentum strategies have been huge winners. Page 12 Deutsche Bank AG/Hong Kong
  • 13.
    17 October 2012 TheInvestigator Figure 7: Model portfolio performance since inception (13 September 2010) 22 Model portfolio absolute returns (After T/C): 19.0% 1-week relative returns 0.1% 22 20 MSCI Asia ex Japan absolute returns: 4.8% 1-month relative returns 2.5% 20 18 Model portfolio relative returns (After T/C): 14.2% YTD relative returns 9.8% 18 16 12-month relative returns 12.1% 16 14 After Transaction Cost 14 12 12 10 10 8 8 6 6 4 4 2 2 0 0 -2 -2 9/10 11/10 1/11 3/11 5/11 7/11 9/11 11/11 1/12 3/12 5/12 7/12 9/12 Source: Deutsche Bank, MSCI, FactSet Note: Performance is measured in local currency. Stock changes are effective as of close one day after they are officially published (i.e. Changes published on 4th May 2011 will be effective as of close 5th May 2011). *New additions. Assume 50bps on both buying and selling as proxy for transaction cost. Note: Past performance does not guarantee future results Figure 8: Model portfolio country and sector overweights/underweights -12% -9% -6% -3% 0% 3% 6% 9% 12% Sector (MSCI Wgt) -12% -9% -6% -3% 0% 3% 6% 9% 12% Country (MSCI Wgt) Retailing (1.5%) THAILAND (3.0%) Materials (7.0%) Energy (7.2%) INDIA (9.5%) Telecom (6.7%) Cons Svc (1.7%) Div Financials (2.4%) INDONESIA (3.7%) Cap Gds (7.6%) Health Care Equip (0.3%) PHILIPPINES (1.2%) Media (0.3%) Real Estate (7.0%) CHINA (23.9%) Comm Svc (0.0%) Pharma/Biotech (0.7%) Underweight Neutral Overweight Overweight Software (3.2%) Underweight SINGAPORE (7.3%) Cons Dur/App (0.8%) Food/Staples Retail (0.8%) MALAYSIA (4.9%) Food Beverages (3.6%) Hhold Products (1.2%) Utilities (3.9%) HONG KONG (11.9%) Insurance (4.3%) Transport (1.9%) TAIWAN (14.4%) Current O/U wgt Tech Hardware (4.5%) Current O/U wgt (17 October 2012) (17 October 2012) Autos (5.0%) Previous O/U wgt Previous O/U wgt Semis (10.1%) SOUTH KOREA (20.1%) (07 August 2012) (07 August 2012) Banks (18.1%) -12% -9% -6% -3% 0% 3% 6% 9% 12% -12% -9% -6% -3% 0% 3% 6% 9% 12% Source: Deutsche Bank, MSCI. Note: Numbers in parenthesis are sector and country weights in MSCI AC Asia ex Japan index. The model portfolio is equal weighted; each stock has weighting of 2.5%. Deutsche Bank AG/Hong Kong Page 13
  • 14.
    17 October 2012 TheInvestigator Figure 9: Asia Model Portfolio Profitability FY 13 Cons Rec Valuation Price Mo Earnings Earnings Stability Growth Quality DB Date Close YTD Rtn Hldg Per Mcap 20D ADT PE (DB Risk Mo BB Ticker Mkt Rec Added 16Oct12 (%) Rtn (%) Beta (U$bn) (U$ m) est) Energy - MSCI wgt: 7.2%, portfolio wgt: 12.5% CNOOC Ltd. 883 HK CN H 11Dec10 15.94 20.5 -6.7 1.40 91.8 111.5 8.9 o + ++ o o ++ o o o Oil & Natural Gas Corp. Ltd. ONGC IN IN B 14Sep10 278.95 12.4 -14.7 0.65 45.2 20.3 8.7 ++ ++ + o o ++ o o o Oil India Ltd. OINL IN IN B 30Sep11 485.85 5.9 -6.2 0.29 5.5 1.7 9.1 ++ + + o + ++ o o o PTT PCL PTT TB TH NR 14Sep10 311.00 1.6 1.27 29.0 38.7 SK Innovation Co. Ltd. 096770 KS KR B 7Aug12 154000 8.5 -6.9 1.47 13.5 55.8 6.6 ++ ++ + o - - ++ - - o o Materials - MSCI wgt: 7.0%, portfolio wgt: 12.5% Grasim Industries Ltd. GRASIM IN IN B 27Jun12 3464.85 39.0 36.1 0.75 6.0 6.0 11.0 + + ++ ++ ++ o o + o Shree Cement Ltd. SRCM IN IN B 17Oct12 4048.80 87.7 NA 0.70 2.7 6.3 17.7 - ++ ++ ++ o - -- o ++ Indocement Tunggal Prakarsa INTP IJ ID B 14Sep10 21450 27.5 19.6 1.34 8.2 5.5 15.9 - ++ ++ ++ ++ ++ o o o Korea Zinc Co. Ltd. 010130 KS KR B 17Oct12 461000 51.6 NA 1.13 7.9 31.9 8.2 o ++ ++ ++ - + o + o LG Chem Ltd. 051910 KS KR B 14Sep10 316500 -0.3 -5.3 1.53 19.3 73.6 11.9 o ++ + o o ++ o o -- Capital Goods - MSCI wgt: 7.6%, portfolio wgt: 10.0% China Communications Construction Co. Ltd. 1800 HK CN B 5May11 6.94 18.0 5.5 1.41 12.1 19.3 7.0 + + o ++ o o o o ++ Sino-Thai Engineering & Construction PCL STEC TB TH B 7Aug12 20.70 72.8 36.2 0.82 0.8 3.9 19.3 o + ++ ++ o ++ o o ++ SembCorp Industries Ltd. SCI SP SG B 14Sep10 5.47 39.3 30.0 1.36 8.0 9.3 11.4 o ++ o ++ o + o o + SembCorp Marine Ltd. SMM SP SG B 11Dec10 4.92 35.3 8.0 1.66 8.4 14.5 13.2 o ++ o + o ++ - - o + Commercial Services & Supplies - MSCI wgt: 0.0%, portfolio wgt: 0.0% Transportation - MSCI wgt: 1.9%, portfolio wgt: 0.0% Automobiles & Components - MSCI wgt: 5.0%, portfolio wgt: 0.0% Consumer Durables & Apparel - MSCI wgt: 0.8%, portfolio wgt: 0.0% Consumer Services - MSCI wgt: 1.7%, portfolio wgt: 5.0% SJM Holdings Ltd. 880 HK HK B 9Mar12 16.30 34.5 10.1 1.34 11.7 9.7 12.7 + ++ ++ ++ o ++ ++ o Minor International PCL MINT TB TH B 27Jun12 17.80 76.2 26.2 1.06 2.1 6.5 20.4 o ++ ++ ++ o - - ++ o Media - MSCI wgt: 0.3%, portfolio wgt: 2.5% BEC World PCL BEC TB TH H 11Nov11 57.25 31.7 59.1 0.73 3.7 3.4 20.8 - ++ ++ o o ++ o o -- Retailing - MSCI wgt: 1.5%, portfolio wgt: 7.5% Belle International Holdings Ltd. 1880 HK CN B 5May11 13.62 2.0 -6.9 0.93 14.8 25.5 15.7 - ++ ++ ++ o ++ ++ o Giordano International Ltd. 709 HK HK H 14Sep10 6.40 20.4 61.0 0.88 1.3 2.5 12.3 + ++ + + o ++ ++ ++ Ace Hardware Indonesia ACES IJ ID B 17Oct12 6650.00 62.8 NA 0.41 1.2 0.6 23.7 - - + ++ ++ o + ++ o Food & Staples Retailing - MSCI wgt: 0.8%, portfolio wgt: 0.0% Food Beverage & Tobacco - MSCI wgt: 3.6%, portfolio wgt: 2.5% Uni-President Enterprises Corp. 1216 TT TW B 7Aug12 52.00 28.0 4.7 0.63 8.7 14.3 19.9 - + ++ ++ - + o o Household & Personal Products - MSCI wgt: 1.2%, portfolio wgt: 0.0% Health Care Equipment & Services - MSCI wgt: 0.3%, portfolio wgt: 2.5% Top Glove Corp. Bhd TOPG MK MY B 17Oct12 5.31 8.8 NA 0.99 1.1 2.2 14.1 ++ o + ++ o ++ - - o o Pharmaceuticals & Biotechnology - MSCI wgt: 0.7%, portfolio wgt: 0.0% Banks - MSCI wgt: 18.1%, portfolio wgt: 7.5% ICICI Bank Ltd. ICICIBC IN IN B 7Aug12 1042.05 54.6 7.0 1.44 22.7 78.4 12.7 - - o o o o -- o o ++ BOC Hong Kong (Holdings) Ltd. 2388 HK HK B 5May11 24.10 37.0 9.3 1.02 32.9 32.2 11.7 ++ o o + o o o o + Industrial & Commercial Bank of China Ltd. 1398 HK CN B 5May11 4.88 11.2 -16.7 1.41 214.7 165.4 6.2 ++ ++ o -- o o o o ++ Diversified Financials - MSCI wgt: 2.4%, portfolio wgt: 5.0% IDFC Ltd. IDFC IN IN B 15May12 149.90 65.9 30.7 1.58 4.3 24.5 10.2 - ++ o o ++ o o Haitong Securities Co. Ltd-H share 6837 HK CN B 27Jun12 10.70 NA -0.2 NA 14.5 7.0 15.0 + + + + o o ++ Insurance - MSCI wgt: 4.3%, portfolio wgt: 2.5% Dongbu Insurance Co. Ltd. 005830 KS KR NR 9Mar12 49550 -5.0 5.7 0.53 3.2 5.5 NA + ++ o o - o Real Estate - MSCI wgt: 7.0%, portfolio wgt: 7.5% Sun Hung Kai Properties Ltd. 16 HK HK B 11Dec10 109.00 12.9 -12.7 1.08 36.8 82.2 13.1 + o ++ o o o o o -- Keppel Land Ltd. KPLD SP SG B 15May12 3.47 65.3 18.0 1.69 4.4 5.3 13.3 + ++ ++ - - - ++ -- o Megaworld Corp. MEG PM PH B 7Aug12 2.40 43.1 7.1 1.28 1.5 4.4 9.1 ++ o ++ o + o o o o Software & Services - MSCI wgt: 3.2%, portfolio wgt: 2.5% SouFun Holdings Ltd. ADS SFUN US CN B 30Aug11 17.71 28.0 10.5 1.64 1.4 3.8 8.0 ++ ++ ++ ++ -- -- + o o Technology Hardware & Equipment - MSCI wgt: 4.5%, portfolio wgt: 0.0% Semiconductors & Semiconductor Equipment - MSCI wgt: 10.1%, portfolio wgt: 5.0% Samsung Electronics Co. Ltd. 005930 KS KR B 7Aug12 1330000 25.8 2.8 1.14 178.8 337.8 8.6 + ++ o o + + o o ++ Novatek Microelectronics Corp. 3034 TT TW B 28Jan11 104.50 43.7 18.9 1.23 2.2 18.6 12.6 o ++ o o ++ + o o ++ Telecommunication Services - MSCI wgt: 6.7%, portfolio wgt: 10.0% China Mobile Ltd. 941 HK CN H 14Sep10 83.70 14.7 15.9 0.46 217.0 196.8 10.8 ++ ++ + -- + ++ o o o China Communications Services Corp. Ltd. 552 HK CN B 30Sep11 4.39 32.6 28.9 0.63 3.9 2.7 9.2 ++ o ++ ++ ++ ++ o -- ++ Far EasTone Telecommunications Co. Ltd. 4904 TT TW B 30Sep11 72.40 32.5 65.7 0.12 8.1 13.9 17.4 - + ++ ++ - - ++ o o ++ Telekom Malaysia Bhd T MK MY H 15May12 6.23 35.6 23.6 0.76 7.3 16.6 26.3 o o ++ ++ ++ - -- o o Utilities - MSCI wgt: 3.9%, portfolio wgt: 2.5% Guangdong Investment Ltd. 270 HK CN B 30Sep11 6.20 35.5 32.4 0.38 5.0 4.5 12.6 o o o o o o o Db X-Trackers Csi300 Trn Index Et 3049 HK CN 15May12 5.62 -7.2 -11.1 1.00 0.3 3.7 Asia Model Portfolio (eq-wgt)** 23.1 19.0 1.03 26.6 36.7 13.1 MSCI Asia ex-Japan, LC 13.3 4.8 Source: Deutsche Bank, FactSet, Bloomberg Finance LP. Note: Stocks are sorted by names in alphabetical order within each sector. Factor scores are given on a country and sector relative basis. Very Favorable (++), Favorable (+), Neutral (0), Unfavorable (-), Very Unfavorable (--), Not Applicable (Blank). For a detailed explanation please see appendix A. Performance is measured in local currency. Stock changes are effective as of close one day after they are officially published (i.e. Changes published on 4th May 2011 will be effective as of close 5th May 2011). *New additions. **Assume 50bps on both buying and selling as proxy for transaction cost. Page 14 Deutsche Bank AG/Hong Kong
  • 15.
    17 October 2012 TheInvestigator Country selection Figure 10: Equity markets and their key drivers Current Account Balance/GDP Sentiment (Risk-Love) Real Exchange Rate Total Score Technicals Valuation Liquidity Growth Policy China (Latest) 8 China (Last) -2 Hong Kong (Latest) -2 Hong Kong (Last) -2 Indonesia (Latest) 1 Indonesia (Last) 0 India (Latest) 4 India (Last) 3 Korea (Latest) 6 Korea (Last) -3 Malaysia (Latest) 2 Malaysia (Last) 3 Philippines (Latest) 5 Philippines (Last) 0 Singapore (Latest) -2 Singapore (Last) 4 Thailand (Latest) 4 Thailand (Last) 6 Taiwan (Latest) 1 Taiwan (Last) 0 Asia ex-Japan (Latest 4 Asia ex-Japan (Last) -2 Japan (Latest) 2 Japan (Last) -4 Source: Deutsche Bank. Blank cell represents factor not used in the model for that country. Most Favorable, Favorable, O Neutral, Less Favorable and Least Favorable. Liquidity is based on yoy change in M2/Market Cap ratio, valuation is based on composite valuation index (based on trailing P/E, 12m fwd P/E, P/cash earnings, P/book, dividend yield, EV/EBIDTA and EV/Sales), sentiment is based on Risk-Love indicator, technicals are based on several price based indicators like percentage of stocks above 200-d moving average, number of 52-Weeks new lows and new highs, indices above/below their 200-d moving average etc., growth is based on leading economic indicators and earnings revision index, current account balance/GDP is based on deviation from 3-year moving average trend, real exchange rate is based on deviation from 2-year moving average trend and policy is based on policy indicator. Deutsche Bank AG/Hong Kong Page 15
  • 16.
    17 October 2012 TheInvestigator Country-sector selection Figure 11: We prefer sectors with value, high earnings and price momentum, and better profitability 0.90 JP Banks HK Real Estate JP Telecom 0.80 KO Autos ID Hhold Products 0.70 TH Banks ID Banks Most preferred sectors CH Banks TH Food Bev 0.60 TH Telecom JP Energy IN Software 0.50 High earnings revisions & IN Hhold Products JP HCare Equip/Svc price momentum, better MY Utilities MY Telecom CH Real Estate 0.40 KO Insurance profitability KO Tech Hard/Equip IN Div Fin SG Banks CH Utilities 0.30 JP Autos TA Banks PH Real Estate TH Energy SG Real Estate SG Retailing JP Transport ID Utilities JP Div Fin ID Autos HK Telecom JP Food Bev KO Utilities JP Fd/Staples Retail 0.20 ID Pharma/ Biotech JP Comm Svc IN Energy HK Utilities PH Div Fin PH Cap Gds MY Energy JP Pharma/ Biotech HK Banks Software JP HK Cons Svc IN Banks ID Food Bev 0.10 TH Media IN Pharma/ Biotech JP Materials MY Banks MY Food Bev ID Telecom HK Cap Gds CH Telecom Materials ID CH Software TA Real Estate CH Transport SG Media Materials IN Autos JP Real Estate TH Materials KO TA Div Fin 0.00 TA Telecom JP Cap Gds CH Cap GdsJP Insurance TA Cons Durables SG Div Fin KO Retailing KO Cap Gds Transport JP Tech Hard/Equip HK KO Cons Svc KO Telecom KO Energy JP Hhold Products KO Food Bev JP Retailing JP Media KO Hhold Products IN Materials SG Food Bev -0.10 MY Autos CH Tech Hard/Equip CH HCare Equip/Svc HK Semis KO Transport CH Energy TA Materials -0.20 TA Semis PH Fd/Staples Retail HK Tech Hard/Equip JP Semis SG Cap Gds TA Retailing TA Cap Gds TA Insurance HK Retailing CH Autos KO Fd/Staples Retail -0.30 IN Food Bev MY Materials HK Cons Durables SG Cons Svc SG Fd/Staples Retail CH Materials KO Cons Durables Cheaper JP Cons Svc TA Tech Hard/Equip MY Cons Svc ID Energy MY Transport MY Cap Gds PH Telecom CH Retailing -0.40 CH Insurance MY Div Fin SG Telecom TA Fd/Staples Retail CH Food Bev IN Cap Gds IN Utilities IN Telecom IN Real Estate TA Transport Least preferred sectors IN Media HK Div Fin KO Pharma/ Biotech KO Div Fin Cap Gds ID -0.50 TA Autos KO Semis SG Transport CH Fd/Staples Retail KO Software -0.60 JP Utilities -0.70 -0.40 -0.30 -0.20 -0.10 0.00 0.10 0.20 0.30 0.40 0.50 0.60 0.70 Source: Deutsche Bank, FactSet Page 16 Deutsche Bank AG/Hong Kong
  • 17.
    17 October 2012 TheInvestigator Figure 12: Our most-preferred 20 country-sectors; most-preferred have cheaper valuations, better EPS momentum, higher ROE and better technicals (all metrics refer to MEDIAN data) Earnings Valuation Revisions Profitability Technicals Earnings Revisions FY1 EPS Revisions FY2 EPS Revisions (U$ bn) 12m fwd P/E Profitability Technicals Valuation ROE (%) Mkt Cap EV/EBIT P/B RSI Country Sector 1 Philippines Utilities 3,637 2.9 11.6 11.7 1.0 1.0 22.5 1.10 O ++ ++ ++ 2 Thailand Telecommunication Services 5,930 4.9 16.6 18.6 0.9 0.5 21.4 1.22 -- ++ ++ ++ 3 Thailand Banks 32,450 1.7 10.6 0.6 0.5 12.4 1.11 O ++ O ++ 4 Indonesia Banks 31,482 2.0 9.7 0.7 0.5 18.8 1.01 + ++ + O 5 Thailand Food & Staples Retailing 5,559 12.2 25.5 22.4 0.6 0.8 38.7 1.13 -- ++ ++ ++ 6 India Software & Services 37,853 3.2 12.7 11.0 0.6 0.6 21.7 1.10 - ++ ++ ++ 7 China Utilities 17,175 1.2 9.5 18.1 0.5 0.6 5.6 1.10 + ++ -- ++ 8 China Real estate 34,144 0.9 5.7 5.9 0.0 -0.2 14.4 1.06 ++ + + + 9 Hong Kong Real estate 112,266 0.6 12.6 7.2 0.3 0.2 8.8 1.06 ++ ++ - + 10 Malaysia Utilities 13,877 1.3 12.7 12.5 0.4 0.4 9.9 1.10 O ++ O ++ 11 India Banks 60,156 0.8 5.2 -0.4 -0.4 18.3 0.97 ++ O + - 12 Korea Insurance 17,335 1.4 6.5 -0.2 -0.1 15.1 0.99 ++ + + - 13 Korea Banks 43,648 0.6 5.8 -0.7 -0.7 12.8 0.96 ++ - O - 14 Singapore Retailing 4,270 3.2 11.6 8.8 0.1 0.1 24.8 1.09 O ++ ++ ++ 15 Korea Automobiles & Components 76,862 1.2 6.4 6.6 -0.2 -0.2 16.5 0.98 ++ O + - 16 Singapore Banks 60,279 1.4 11.4 0.2 -0.2 11.3 1.07 + + O + 17 India Household & Personal Products 11,909 11.6 27.0 29.1 0.4 0.3 35.0 1.14 -- ++ ++ ++ 18 India Diversified Financials 11,120 1.7 10.9 -0.1 0.0 18.6 1.07 + + + + 19 Malaysia Telecommunication Services 18,375 2.9 22.2 18.1 0.2 0.0 20.8 1.14 -- + ++ ++ 20 Korea Technology Hardware & Equipment 15,766 1.4 10.0 13.0 0.1 -0.1 10.8 1.04 O + O + Median 17,855 1.6 11.2 12.5 0.29 0.16 17.4 1.08 Average 30,705 2.9 12.2 14.1 0.25 0.19 17.9 1.07 Source: Deutsche Bank, DataStream. FactSet. EPS revisions is calculated for each stock as the number of analysts revising up the FY1 EPS estimate less number of analysts revising down the FY1 EPS estimate divided by total number of changes in the past three months. We then take the median of these EPS revisions scores for all individual stocks in the country- sector. RSI is the ratio of 65-day to 260-day moving average in stock price. All the metrics shown above except market cap are median data for the sector. Changes: Removed Thailand energy, Hong Kong telecommunications and utilities and Singapore capital goods and have added India Household & Personal Products, Malaysia telecommunications, Indonesia banks and Korea tech hardware. Deutsche Bank AG/Hong Kong Page 17
  • 18.
    17 October 2012 TheInvestigator Figure 13: Our least-preferred 20 country-sectors; least-preferred have expensive valuations, poor EPS momentum, higher ROE and bad technicals (all metrics refer to MEDIAN data) Earnings Valuation Revisions Profitability Technicals Earnings Revisions FY1 EPS Revisions FY2 EPS Revisions (U$ bn) 12m fwd P/E Profitability Technicals Valuation ROE (%) Mkt Cap EV/EBIT P/B RSI Country Sector 1 China Household & Personal Products 6,925 2.4 39.2 (4.8) -1.0 -1.0 (22.3) 0.88 -- -- -- -- 2 China Food & Staples Retailing 7,180 2.3 12.1 13.3 -1.0 -1.0 18.1 0.86 - -- + -- 3 Singapore Hotels Restaurants & Leisure 6,535 0.9 19.6 21.9 -0.9 -1.0 6.6 1.01 - -- - O 4 Korea Software & Services 15,154 2.7 12.9 17.6 -0.9 -0.4 11.4 0.89 -- - O -- 5 Taiwan Materials 50,916 1.4 14.2 16.2 -1.0 -1.0 7.1 1.00 O -- - - 6 China Retailing 15,723 1.4 12.6 8.2 -0.9 -0.9 13.4 0.83 O -- O -- 7 China Food Beverage & Tobacco 22,286 1.5 14.2 17.6 -0.7 -0.9 9.3 0.97 - - - - 8 Taiwan Capital Goods 9,400 1.5 12.6 11.1 -1.0 -1.0 10.3 0.97 O -- O - 9 India Telecommunication Services 4,516 2.0 18.0 21.4 -0.6 -0.6 4.1 0.87 - - -- -- 10 Taiwan Automobiles & Components 7,681 1.4 14.2 21.1 -0.7 -1.0 7.1 1.04 - -- - + 11 China Materials 29,268 0.9 7.7 11.7 -1.0 -1.0 8.9 0.87 ++ -- - -- 12 Korea Semiconductors & Semiconductor Equipment 153,775 1.6 10.5 11.8 -0.9 -0.6 8.3 0.91 O - - -- 13 Korea Diversified Financials 10,246 0.7 10.7 -0.7 -1.0 4.5 0.95 O -- -- - 14 Indonesia Materials 8,406 3.2 13.1 14.4 -0.7 -0.5 10.4 1.00 - - O O 15 Korea Household & Personal Products 10,032 3.9 23.4 19.0 -0.8 -0.3 8.4 1.05 -- - - + 16 India Capital Goods 13,851 2.5 13.4 11.9 -0.6 -0.6 13.4 0.99 O - O - 17 Taiwan Technology Hardware & Equipment 97,160 1.4 10.7 11.4 -0.5 -0.7 10.7 0.97 + - O - 18 India Real Estate 2,388 0.9 13.0 16.0 -0.5 0.0 3.5 0.95 O O -- - 19 Malaysia Transportation 3,823 1.7 17.1 14.9 -0.3 -0.2 11.8 0.97 - O O - 20 Singapore Transportation 12,117 1.7 15.7 16.4 -0.3 -0.3 10.7 1.03 - O O O Median 10,139 1.6 13.3 14.9 -0.73 -0.79 9.1 0.97 Average 24,369 1.8 15.2 14.3 -0.75 -0.70 7.8 0.95 Source: Deutsche Bank, DataStream. FactSet. EPS revisions is calculated for each stock as the number of analysts revising up the FY1 EPS less number of analysts revising down the FY1 divided by total number of changes in the past three months. We then take the median of these EPS revisions scores for all individual stocks in the country-sector. RSI is the ratio of 65-day to 260-day moving average in stock price. All the metrics shown above except market cap are median data for the sector. Changes: Removed India utilities and food beverage & tobacco, Indonesia telecommunications and Taiwan semis and added Taiwan capital goods, Korea diversified financials, China materials and Indonesia materials Page 18 Deutsche Bank AG/Hong Kong
  • 19.
    17 October 2012 TheInvestigator Figure 14: Asian country sector heat-map for all covered sectors Hong Kong Philippines Singapore Indonesia Malaysia Thailand Taiwan Japan Korea China India Energy 102 -10 40 124 51 95 -10 -10 104 -10 72 Materials 134 -10 62 128 83 92 -10 -10 109 143 85 Capital Goods 115 116 117 111 78 66 87 71 -10 137 63 Commercial Services & Supplies -10 -10 -10 -10 -10 -10 -10 -10 -10 -10 29 Transportation 125 100 -10 -10 91 90 -10 79 -10 140 48 Automobiles & Components 122 -10 82 58 32 38 -10 -10 -10 135 43 Consumer Durables & Apparel -10 77 -10 -10 107 -10 -10 -10 -10 41 45 Hotels Restaurants & Leisure -10 97 -10 -10 37 61 -10 145 -10 -10 126 Media -10 -10 98 -10 -10 -10 -10 88 75 -10 20 Retailing 141 123 -10 -10 114 -10 -10 31 -10 139 17 Food & Staples Retailing 146 -10 -10 -10 120 -10 47 113 10 119 21 Food Beverage & Tobacco 138 -10 73 53 67 81 -10 130 129 -10 54 Household & Personal Products 147 -10 39 9 127 -10 -10 -10 -10 -10 86 Health Care Equipment & Services 93 -10 -10 -10 -10 -10 -10 -10 -10 -10 23 Pharmaceuticals & Biotechnology -10 -10 55 14 106 -10 -10 -10 -10 -10 26 Banks 19 36 22 8 25 30 7 33 6 46 2 Diversified Financials -10 105 42 -10 132 49 16 84 -10 89 28 Insurance 110 -10 -10 -10 24 -10 -10 -10 -10 59 68 Real Estate 13 15 96 -10 -10 -10 34 27 -10 131 60 Software & Services 57 -10 11 -10 144 -10 -10 -10 -10 -10 35 Technology Hardware & Equipment 108 70 -10 -10 52 -10 -10 -10 -10 103 101 Semiconductors & Semiconductor Equipment -10 118 -10 -10 133 -10 -10 -10 -10 74 142 Telecommunication Services 64 76 136 56 112 50 80 99 3 65 5 Utilities 12 94 69 4 44 18 1 -10 -10 -10 121 O ver a ll (bot t om -up r a nking) - Cur r ent 7 9 3 2 10 4 5 8 1 11 6 Overall (bottom-up ranking) - Previous 8 3 6 7 9 10 1 5 2 11 4 Overall (bottom-up ranking) - Avg of above 8 6 5 5 10 7 3 7 2 11 5 V a lua t ion - Cur r ent 1 5 2 10 3 8 11 7 9 6 4 Valuation - Previous 1 5 4 9 3 10 11 8 6 7 2 E a r nings Revis ions - Cur r ent 11 6 5 2 10 3 1 7 4 9 8 Earnings Revisions - Previous 11 6 8 4 9 7 1 3 2 10 5 P r of it a bilit y - Cur r ent 4 8 2 1 9 5 3 7 6 10 11 Profitability - Previous 4 8 2 1 9 6 5 7 3 10 11 Tec hnic a ls - Cur r ent 10 6 5 8 11 4 1 2 3 7 9 Technicals - Previous 10 6 5 9 11 3 1 4 2 7 8 Source: Deutsche Bank. Numbers are ranks, smaller is better. Green color = Most attractive country sectors, Red color=Least attractive country sectors. Yellow color = Neutral country sectors. White space = sector market cap too low or data unavailable. Figure 15: Bottom-up sector model backtest 16,384 16,384 512 512 2,048 Most attractive sectors 2,048 Most attractive sectors Least attractive sectors (bottom quintile) vs least attractive sectors (top quintile) 1,024 1,024 4,096 4,096 relative performance 256 256 512 512 1,024 1,024 256 256 128 128 256 256 128 128 Backtest Backtest Backtest 64 64 64 64 64 64 01/92 01/97 01/02 01/07 01/12 01/92 01/97 01/02 01/07 01/12 01/92 01/97 01/02 01/07 01/12 Source: Deutsche Bank, Real time is from 30 September 2010. Note: Past performance does not guarantee future results. Last updated in May 2012 Deutsche Bank AG/Hong Kong Page 19
  • 20.
    17 October 2012 TheInvestigator Asia Model Portfolio Figure 16: Deletions from model portfolio since inception (13 September 2010) Date Date DB Close Date Date Close Company BB Ticker Added Removed Rec 16Oct12 Company BB Ticker Added Removed DB Rec 16Oct12 Deletions as of 2 Nov 2010 Deletions as of 30 Sep 2011 Agri. Bank of China 1288 HK 13Sep10 2Nov10 H 3.18 DSME 042660 KS 22Jul11 30Sep11 H 23600 Anta Sports 2020 HK 13Sep10 2Nov10 H 6.90 OCI Company 010060 KS 14Sep10 30Sep11 NR 161500 Fraser & Neave FNN SP 13Sep10 2Nov10 B 8.90 BRI BBRI IJ 30Aug11 30Sep11 B 7550.00 Deletions as of 10Dec2010 Samsung Eng. 028050 KS 14Sep10 30Sep11 H 170000 China Shineway 2877 HK 13Sep10 10Dec10 H 10.86 Siam Cement SCC TB 22Jul11 30Sep11 B 355.00 Chunghwa Tel 2412 TT 13Sep10 10Dec10 H 92.30 KWG Property 1813 HK 11Dec10 30Sep11 B 4.50 Far EasTone Telecom 4904 TT 13Sep10 10Dec10 B 72.40 SOHO China 410 HK 3Nov10 30Sep11 B 5.16 First Philippine Hldgs FPH PM 13Sep10 10Dec10 B 80.70 Deletions as of 11 Nov 2011 LIG Insurance 002550 KS 13Sep10 10Dec10 NR 26500 Hyundai Dept Store 069960 KS 14Sep10 11Nov11 B 144000 Perusahaan Gas Negara PGAS IJ 13Sep10 10Dec10 B 4325.00 SJM 880 HK 14Sep10 11Nov11 B 16.30 PLUS Expressways PLUS MK 13Sep10 10Dec10 NR NA Taiwan Cement 1101 TT 30Aug11 11Nov11 H 36.65 SATS SATS SP 13Sep10 10Dec10 B 2.75 Deletions as of 19 Jan 2012 Top Glove TOPG MK 13Sep10 10Dec10 B 5.31 Powertech Technology 6239 TT 5May11 19Jan12 S 51.80 Wynn Macau 1128 HK 13Sep10 10Dec10 B 20.55 Deletions as of 9 March 2012 Deletions as of 24 Jan 2011 Amorepacific Corp. 090430 KS 30Sep11 9Mar12 H 1231000 Dongfeng Motor 489 HK 2Nov10 24Jan11 B 9.90 Hong Leong Bank Bhd. HLBK MK 11Nov11 9Mar12 H 13.98 Hang Lung Properties 101 HK 13Sep10 24Jan11 B 26.50 Industrial Bank of Korea 024110 KS 22Jul11 9Mar12 H 11800 Deletions as of 4 May 2011 KT&G Corp. 033780 KS 14Oct10 9Mar12 H 92000 Delta Electronics 2308 TT 13Sep10 4May11 B 105.00 Deletions as of 15 May 2012 Franshion 817 HK 10Dec10 4May11 B 2.39 Aboitiz Power Corp. AP PM 14Sep10 15May12 H 33.45 Genting Bhd GENT MK 10Dec10 4May11 H 8.81 Krung Thai Bank Public Co., Ltd. KTB TB 12Dec10 15May12 B 18.60 Kasikornbank KBANK TB 10Dec10 4May11 B 176.00 PT Charoen Pokphand Indonesia Tbk CPIN IJ 11Nov11 15May12 B 3050.00 Nexen Tire 002350 KS 13Sep10 4May11 H 18100 PT Perusahaan Gas Negara (Persero) Tbk PGAS IJ 8Mar12 15May12 B 4325.00 Orise Technology 3545 TT 27Jan11 4May11 B 34.90 Yangzijiang Shipbuilding (Holdings) Ltd. YZJ SP 14Sep10 15May12 H 0.94 Shanghai Electric 2727 HK 13Sep10 4May11 B 3.09 Deletions as of 26 June 2012 Deletions as of 6 Jun 2011 Formosa Chemicals & Fibre 1326 TT 14Sep10 26Jun12 H 74.20 DiGi.Com DIGI MK 13Sep10 6Jun11 H 5.44 China Construction Bank-H 939 HK 14Sep10 26Jun12 H 5.68 Bank of Baroda BOB IN 10Dec10 6Jun11 B 766.80 Wharf Holdings ltd 4 HK 14Sep10 26Jun12 H 51.90 Deletions as of 21 Jul 2011 Deletions as of 7 August 2012 China CITIC 998 HK 4May11 21Jul11 H 4.05 Wipro Ltd WPRO IN 20Jan12 6Aug12 B 352.10 Asian Paints APNT IN 13Sep10 21Jul11 H 3882.15 United Tractors Tbk Pt UNTR IJ 9Mar12 6Aug12 B 19600 Hyundai Heavy 009540 KS 10Dec10 21Jul11 B 235000 Public Bank PBKF MK 15May12 6Aug12 H 14.56 Korean Reinsurance 003690 KS 2Nov10 21Jul11 NR 11600 Mstar Semiconductor Inc 3697 TT 30Sep12 6Aug12 B 244.50 Deletions as of 29 Aug 2011 Bank of China Ltd-H 3988 HK 14Sep10 6Aug12 B 3.07 Sinopec-H 386 HK 11Dec10 29Aug11 B 7.82 Hyundai Marine & Fire Ins Co 001450 KS 22Jul11 6Aug12 NR 37000 Cathay Pacific 293 HK 14Sep10 29Aug11 S 13.46 Deletions as of 17 October 2012 Maanshan-H 323 HK 7Jun11 29Aug11 S 1.94 HYUNDAI MOTOR CO 005380 KS 14Sep10 17Oct12 B 227500 Siliconware Precision 2325 TT 7Jun11 29Aug11 H 32.40 HYUNDAI MOBIS 012330 KS 31Aug11 17Oct12 B 300000 SIMPLO TECHNOLOGY CO LTD 6121 TT 5May11 17Oct12 B 177.00 STARHUB LTD STH SP 30Sep11 17Oct12 H 3.66 Source: Deutsche Bank, FactSet, Bloomberg Finance LP Page 20 Deutsche Bank AG/Hong Kong
  • 21.
    17 October 2012 TheInvestigator Global – valuation High policy uncertainty, and the attendant flight from junior tranches of the capital structure, along with a dismal prior decade of equity returns keeps them “cheap”. Reduced policy uncertainty and losses from bond portfolios are likely to be required as catalysts to unlock value in equities. Figure 17: Composite valuation index Figure 18: Price-to-book value 3.0 MSCI AC World 12m fd rtn (RS) 60% 4.5 4.5 World P/BV World Composite Valuation Index (S.D., LS) 4.0 4.0 2.0 40% Expensive 3.5 3.5 1.0 20% 3.0 3.0 0.0 0% 2.5 2.5 2.0 2.0 -1.0 -20% 1.5 1.5 -2.0 Cheap -40% 1.0 1.0 -3.0 -60% 0.5 0.5 1/75 1/80 1/85 1/90 1/95 1/00 1/05 1/10 1/75 1/80 1/85 1/90 1/95 1/00 1/05 1/10 Source: Deutsche Bank, IBES, MSCI. Note: Composite valuation index is the average of trailing P/E, 12m Source: Deutsche Bank, MSCI, DataStream forward P/E, P/Cash Earnings, P/BV, Dividend Yield, EV/EBITDA and EV/Sales, normalized over entire history Figure 19: 12m forward P/E Figure 20: 12m trailing P/E 25 25 40 40 World 12m Forward P/E World Trailing P/E 23 23 35 35 21 21 19 19 30 30 17 17 25 25 15 15 13 13 20 20 11 11 15 15 9 9 10 10 7 7 5 5 5 5 1/87 1/90 1/93 1/96 1/99 1/02 1/05 1/08 1/11 1/73 1/78 1/83 1/88 1/93 1/98 1/03 1/08 1/13 Source: Deutsche Bank, MSCI, I/B/E/S Source: Deutsche Bank, MSCI, DataStream Figure 21: EV multiples Figure 22: ROE and EBIT margin 16 World EV/EBITDA (LS) 2.5 18% World ROE (LS) World EBIT/Sales (RS) 14% World EV/SALES (RS) 2.3 16% 13% 14 2.1 14% 12% 12 1.9 12% 1.7 11% 10% 10 1.5 10% 8% 1.3 9% 8 1.1 6% 4% 8% 6 0.9 0.7 2% 7% 4 0.5 0% 6% 1/87 1/90 1/93 1/96 1/99 1/02 1/05 1/08 1/11 1/73 1/78 1/83 1/88 1/93 1/98 1/03 1/08 1/13 Source: Deutsche Bank, MSCI, FactSet Source: Deutsche Bank, MSCI, FactSet Deutsche Bank AG/Hong Kong Page 21
  • 22.
    17 October 2012 TheInvestigator Global metrics Despite all the despair about global growth, our own mother of all leading indicators (MOMLI) is looking up, as are asset-price-based opinions on global growth. Meanwhile, analysts have lost confidence and are looking for just 5% EPS growth globally in 2012, and 12% for 2013. Global Risk-Love (sentiment) has now entered euphoria, a slight concern. The global Tape is very strong, and the Marshallian K is rising. Figure 23: Market – implied global growth leading Figure 24: Global long leading indicator (MOMLI) indicators 120 Global long leading indicator (pushed 12% % S.D. S.D. fwd by 5m, LS) 3 3 80 OECD G7 composite leading indicator 8% Style-Based Leading Economic Indicator, LS (YoY%, RS) 2 Asset-Price-Based Global Growth Indicator, RS 2 40 4% 1 1 0 0% 0 0 -40 -4% -1 -1 -80 -8% -2 -2 -120 OECD Composite Leading Indicator as of June2012 -12% 1/89 1/95 1/01 1/07 1/13 -3 -3 1/89 1/92 1/95 1/98 1/01 1/04 1/07 1/10 1/13 Source: Deutsche Bank Source: Deutsche Bank, OECD Figure 25: Earnings growth forecast (%) Figure 26: Global equity Risk-Love indicator 25 12/2011F 25 1.2 MSCI AC World 6m fd rtn (RS) 40% 23 12/2012F 23 Global Risk-Love, SD (LS) 21 21 0.8 12/2013F Euphoria 20% 19 19 0.4 17 17 15 15 0.0 0% 13 13 11 11 -0.4 9 9 -20% 7 MSCI AC World 7 -0.8 Panic 5 5 -1.2 -40% 1/09 7/09 1/10 7/10 1/11 7/11 1/12 7/12 1/00 1/02 1/04 1/06 1/08 1/10 1/12 Source: Deutsche Bank, I/B/E/S, MSCI Source: Deutsche Bank, MSCI Page 22 Deutsche Bank AG/Hong Kong
  • 23.
    17 October 2012 TheInvestigator Global metrics (continued) Figure 27: Percentage of countries above their 10-WMA Figure 28: Global free liquidity 120% % of countries trading above 10- 120% 15 % 15 % Global Free Liquidity 100% week moving average 100% 10 10 80% 80% 5 5 60% 60% 40% 40% 0 0 20% 20% -5 G7 M2 Growth (MZM for US, M4 for UK) less G7 -5 0% 0% Consumer Price Inflation less G7 Leading Economic Indicator Growth 1/09 1/10 1/11 1/12 1/13 -10 -10 1/85 1/88 1/91 1/94 1/97 1/00 1/03 1/06 1/09 1/12 Source: Deutsche Bank. Includes 49 Markets. Source: Deutsche Bank Figure 29: Commodity Risk-Love indicator Figure 30: Energy Risk-Love indicator 2.0 Energy Risk-Love (S.D.) 2.0 3 Commodities Risk-Love 3 1.5 Euphoria (S.D.) 2 2 1.0 Euphoria 1.0 1 1 0.5 0.0 0.0 0 0 -0.5 -1 -1 -1.0 -1.0 -2 Panic -2 Panic -1.5 -3 -3 -2.0 -2.0 1/00 1/02 1/04 1/06 1/08 1/10 1/12 1/00 1/02 1/04 1/06 1/08 1/10 1/12 Source: Deutsche Bank Source: Deutsche Bank Figure 31: 6m total equity offerings* as percentage of Figure 32: Composite policy indicator total market cap 1.6% 1.6% 2.5 S.D. S.D. 2.5 6m total IPOs & addl offerings as of Sep 2012: 1.4% US=U$128.8bn, EU=U$23.5bn, JP=U$15.5bn 1.4% 2.0 2.0 Easy Monetary/Fiscal Policy 1.2% 1.2% 1.5 1.5 1.0% 1.0% 1.0 1.0 0.8% 0.8% 0.5 0.5 0.6% 0.6% 0.0 0.0 0.4% 0.4% -0.5 -0.5 0.2% 0.2% -1.0 Tight Monetary/Fiscal Policy -1.0 US Japan Europe 0.0% 0.0% -1.5 Europe US Japan -1.5 1/99 1/01 1/03 1/05 1/07 1/09 1/11 1/81 1/85 1/89 1/93 1/97 1/01 1/05 1/09 1/13 Source: Deutsche Bank, Bloomberg Finance LP, DataStream Source: Deutsche Bank, DataStream, CEIC, IMF. Note: Composite policy indicator is an equal weighted Note: *Equity offerings include IPO and additional equity offerings of primary and secondary shares. index of real effective exchange rate yoy growth, real broad money (M2) yoy growth, yield curve (long Data as of close 25 Aug, 2011. minus short term interest rate) and government fiscal deficit/surplus as % of GDP. Deutsche Bank AG/Hong Kong Page 23
  • 24.
    17 October 2012 TheInvestigator Global – market intelligence Figure 33: Market intelligence by country 11Oct12 Mcap LC Perf P/E (x) P/B (x) Div Yld (%) EPSg (%) ROE (%) Region/Country (#Co) U$m 1m YTD CY11 CY12 CY13 CY11 CY12 CY13 CY11 CY12 CY13 CY11 CY12 CY13 CY11 CY12 CY13 North America (704) 14,701,320 -0.1 12.9 15.0 14.1 12.6 2.2 2.0 1.8 1.9 2.2 2.4 16.4 5.7 11.4 14.7 14.3 14.6 Canada (101) 1,255,992 0.1 2.4 14.2 14.1 12.4 1.8 1.6 1.5 2.6 2.9 3.1 18.8 -1.0 12.2 13.0 11.5 12.5 US (603) 13,445,328 -0.1 13.9 15.0 14.1 12.6 2.3 2.0 1.9 1.9 2.1 2.3 16.2 6.3 11.3 14.9 14.7 14.9 Europe (447) 6,791,499 -0.3 8.2 11.5 11.8 10.6 1.5 1.5 1.4 3.7 3.8 4.1 0.8 -3.5 12.7 13.0 12.2 12.6 Austria (9) 28,469 2.1 8.8 12.8 10.5 9.0 0.9 0.9 0.8 3.0 3.5 4.0 -24.7 22.0 16.5 7.0 8.3 9.2 Belgium (12) 120,098 0.5 30.7 19.1 14.7 14.1 1.8 1.7 1.6 2.4 2.7 3.0 -6.6 30.5 10.8 9.7 11.6 12.0 Denmark (11) 123,858 0.2 28.0 24.4 19.3 15.6 2.7 2.6 2.4 1.3 1.6 2.1 -7.0 26.6 23.4 11.1 13.4 15.3 Finland (14) 78,085 -0.5 -0.3 11.8 12.6 11.7 1.3 1.4 1.4 5.0 4.8 5.1 -19.3 -41.3 46.3 11.3 12.1 12.3 France (73) 963,374 -2.9 9.1 11.0 11.1 10.1 1.2 1.2 1.1 3.7 4.0 4.3 -0.6 -4.4 11.4 11.0 10.5 10.6 Germany (52) 893,699 0.0 19.5 12.2 11.2 10.3 1.5 1.4 1.3 3.5 3.6 3.8 -8.4 8.9 9.9 12.2 12.1 12.4 Greece (2) 5,309 -2.9 -16.1 17.2 18.9 11.3 1.9 1.7 1.6 0.0 1.5 2.3 -15.1 -14.4 -24.2 25.3 19.8 14.3 Ireland (4) 27,673 -1.6 -0.9 16.8 17.1 15.3 1.3 1.3 1.3 3.1 3.1 3.1 11.7 -1.8 na 8.0 7.4 8.2 Italy (27) 235,169 -3.6 3.7 9.4 9.9 8.7 1.0 0.9 0.9 4.2 4.2 4.7 -14.9 8.4 13.1 9.2 7.7 8.2 Netherlands (22) 259,827 -1.0 10.4 12.4 11.8 10.4 1.4 1.4 1.3 2.6 3.1 3.6 -7.2 7.5 12.5 11.7 12.0 12.7 Norway (10) 101,921 0.3 9.4 11.4 10.7 9.9 1.6 1.5 1.4 4.3 4.7 4.4 21.4 6.8 7.5 14.3 13.9 13.8 Portugal (5) 17,942 -0.3 -6.0 12.1 12.4 11.6 1.7 1.5 1.4 4.1 4.3 4.6 -22.3 -2.7 7.2 9.5 9.3 9.6 Spain (24) 298,942 -3.3 -9.8 8.5 12.4 9.4 1.0 1.1 1.0 6.7 5.0 5.9 -10.2 -40.7 50.7 11.4 8.5 10.6 Sweden (35) 323,474 -0.8 7.5 13.6 13.5 12.0 1.9 1.8 1.6 3.8 4.0 4.3 -5.2 0.7 11.8 14.0 14.0 13.7 Switzerland (40) 909,221 2.1 11.7 14.9 13.9 12.3 2.2 2.1 1.9 3.3 3.5 3.8 -9.5 7.2 12.7 12.9 14.8 15.7 UK (107) 2,404,439 0.5 4.6 10.4 11.3 10.3 1.7 1.6 1.5 3.8 4.0 4.3 15.3 -7.7 9.9 16.1 13.9 14.1 Japan (316) 1,944,263 -2.6 -1.8 13.2 12.2 10.4 0.9 0.9 0.8 2.6 2.8 3.0 -15.9 33.7 29.6 6.8 7.4 8.2 Asia Pac ex Japan (690) 3,608,175 3.0 10.2 13.1 12.5 11.3 1.7 1.6 1.4 3.1 3.2 3.5 0.2 6.8 11.5 12.6 12.8 13.0 Asia ex Japan (616) 2,671,032 2.8 9.9 13.1 12.2 10.9 1.7 1.5 1.4 2.6 2.7 2.9 -1.4 9.7 13.0 12.4 12.8 12.9 Australia (69) 924,116 3.7 10.8 13.2 13.3 12.4 1.7 1.7 1.6 4.6 4.8 5.1 5.0 -1.1 6.9 13.3 12.8 13.2 China (141) 639,567 6.7 7.4 10.1 9.9 9.1 1.6 1.5 1.3 3.3 3.3 3.5 10.2 2.5 9.1 16.5 15.2 14.7 Hong Kong (42) 319,157 3.9 16.9 13.9 15.7 14.3 1.4 1.4 1.2 3.0 2.9 3.1 19.9 -11.4 10.2 10.1 8.3 8.4 India (73) 253,910 5.8 22.7 16.6 15.4 13.6 2.8 2.5 2.0 1.3 1.5 1.7 11.0 9.8 12.8 16.4 16.1 15.6 Indonesia (25) 98,073 4.1 9.2 16.2 15.1 13.4 3.8 3.3 2.8 2.0 2.7 2.9 18.8 7.3 12.7 24.2 22.3 21.7 Korea (105) 537,727 -0.1 6.5 12.6 9.8 8.3 1.3 1.2 1.1 1.1 1.2 1.4 -16.3 34.7 17.5 8.6 12.4 12.9 Malaysia (44) 131,170 2.6 5.0 16.4 15.4 14.0 2.1 2.0 1.8 2.8 3.3 3.5 8.4 9.4 10.2 13.1 13.1 13.3 New Zealand (5) 13,027 1.2 11.5 16.1 16.3 14.4 1.6 1.7 1.6 5.5 5.4 5.5 -3.5 -1.5 13.0 10.1 10.2 11.4 Philippines (19) 32,409 4.0 23.0 19.7 17.6 15.7 3.0 2.7 2.4 2.3 2.3 2.5 5.4 11.9 12.4 15.4 15.4 15.5 Singapore (32) 193,776 -0.2 14.9 14.3 13.9 13.0 1.5 1.4 1.4 3.6 3.6 3.8 -3.4 7.4 5.6 10.8 10.5 10.5 Taiwan (114) 385,794 -0.5 4.1 16.1 15.1 13.1 1.7 1.7 1.6 3.3 3.2 3.7 -29.1 9.3 21.5 12.5 11.4 12.5 Thailand (21) 79,447 2.0 18.5 14.5 12.6 10.6 2.6 2.2 1.9 3.1 3.6 4.2 16.2 13.7 18.7 17.9 16.4 17.4 EM EU/M East/Africa (139) 645,810 0.4 11.1 11.0 11.1 9.9 1.4 1.3 1.2 3.2 3.6 4.0 26.1 -3.7 6.5 16.6 13.6 13.1 Czech Republic (3) 11,756 2.0 2.5 10.9 10.7 10.9 1.8 1.7 1.7 6.3 6.0 6.1 -12.4 1.4 -1.4 16.8 16.3 15.4 Egypt (8) 13,176 0.5 61.0 10.6 12.0 9.8 1.1 1.8 1.8 2.3 3.4 4.0 20.9 45.9 9.2 7.3 11.4 11.4 Hungary (4) 11,383 3.6 14.4 8.2 9.8 8.0 1.0 0.9 0.9 1.3 3.1 3.9 13.9 -16.3 21.6 12.4 9.6 10.8 Israel (10) 62,534 0.1 -1.3 8.4 8.5 7.9 1.6 1.4 1.2 2.5 2.3 2.9 12.4 1.1 7.6 20.2 16.6 16.2 Morocco (3) 2,981 -8.0 -19.9 11.6 10.6 9.6 2.6 2.6 2.4 4.9 4.7 3.4 -1.4 9.3 10.7 22.0 24.6 25.5 Poland (21) 54,896 1.4 11.2 11.8 10.5 10.9 1.3 1.2 1.2 4.1 4.0 4.6 25.5 -13.1 -3.0 14.3 11.9 10.9 Russia (26) 219,329 -2.2 4.9 7.2 8.5 7.9 0.8 0.8 0.7 2.1 3.7 3.8 37.2 -11.8 1.2 17.8 12.7 11.6 South Africa (50) 268,550 1.6 11.2 14.9 12.9 11.1 2.4 2.2 2.0 3.4 3.7 4.1 19.1 14.9 16.9 15.7 16.9 17.4 Turkey (24) 63,739 3.0 36.0 12.4 11.4 10.1 1.9 1.7 1.5 na 2.7 2.9 -6.7 9.3 12.6 15.4 15.0 15.0 Latin America (137) 777,498 1.3 5.7 14.7 14.2 11.7 1.7 1.7 1.6 3.5 2.9 3.1 -1.4 -1.7 17.9 12.3 12.4 13.7 Brazil (78) 463,391 0.0 3.6 12.9 12.4 10.3 1.4 1.4 1.3 3.8 3.4 3.6 -2.8 -9.0 18.5 12.2 11.8 12.7 Chile (20) 68,354 0.7 -2.9 17.4 17.0 15.0 2.1 2.0 1.9 3.5 3.1 3.2 -8.4 2.0 13.8 11.8 12.1 12.8 Colombia (14) 44,576 2.3 10.4 18.2 16.0 13.1 1.6 1.3 1.2 2.2 3.1 3.4 36.6 22.6 22.1 8.0 7.4 7.9 Mexico (21) 177,223 4.3 13.2 20.3 19.5 15.3 3.0 2.9 2.6 3.3 1.8 1.9 -2.2 34.1 17.7 11.6 14.7 19.6 Peru (4) 23,953 3.2 9.0 12.4 12.8 11.6 3.6 3.0 2.6 2.3 2.7 2.7 31.0 -3.1 10.2 28.2 23.7 21.7 Developed Markets (1625) 24,949,691 -0.2 10.2 13.6 13.2 11.8 1.8 1.6 1.5 2.6 2.8 3.0 8.0 3.8 12.9 12.8 12.5 12.9 Emerging Markets (818) 3,581,406 2.1 8.3 12.8 12.0 10.5 1.6 1.5 1.4 2.8 2.8 3.1 3.2 5.7 12.8 13.6 13.5 13.7 World (2443) 28,531,097 0.1 9.9 13.5 13.1 11.6 1.7 1.6 1.5 2.6 2.8 3.0 7.3 4.0 12.9 12.9 12.6 13.0 Source: Deutsche Bank, I/B/E/S, MSCI. Note: Data in the table are compiled based on MSCI AC World index universe. P/E, P/B, dividend yield, EPS growth and ROE are aggregated using I/B/E/S consensus estimates (calendarized to December year end) with current prices. All numbers are free-float adjusted. Page 24 Deutsche Bank AG/Hong Kong
  • 25.
    17 October 2012 TheInvestigator Global – market intelligence (continued) Figure 34: Market intelligence by sector 11Oct12 Mcap LC Perf P/E (x) P/B (x) Div Yld (%) EPSg (%) ROE (%) Sector (#Co) U$m 1m YTD CY11 CY12 CY13 CY11 CY12 CY13 CY11 CY12 CY13 CY11 CY12 CY13 CY11 CY12 CY13 Energy (172) 3,186,599 -0.7 1.3 10.3 11.3 10.4 1.6 1.4 1.3 2.8 3.0 3.1 26.6 -9.6 7.9 16.2 12.9 12.8 Materials (272) 2,137,281 0.5 2.1 11.9 13.4 11.0 1.5 1.5 1.4 2.6 2.6 2.8 14.6 -15.1 21.4 13.2 11.1 13.0 Capital Goods (247) 2,116,557 -0.4 7.2 12.6 12.7 11.3 2.0 1.8 1.6 2.6 2.9 3.1 15.6 5.9 11.3 15.1 14.6 14.9 Comm Svc (36) 209,582 -0.8 8.6 18.6 17.1 15.1 2.7 2.9 2.4 2.4 2.6 2.7 5.0 8.8 13.2 12.9 13.3 14.2 Transportation (97) 544,596 -1.0 5.8 18.0 16.2 13.6 2.0 1.8 1.7 2.1 2.3 2.6 -15.1 19.2 21.5 10.1 10.8 12.3 Autos (72) 678,531 -2.8 8.6 11.0 9.0 7.7 1.2 1.1 1.0 2.0 2.4 2.8 4 25 20.6 11.1 12.6 13.0 Cons Durables (59) 382,697 -2.4 6.9 18.7 15.3 13.4 1.9 1.8 1.7 1.8 2.0 2.2 -78.6 415.4 68.3 8.7 11.7 12.4 Cons Svc (48) 411,077 -0.5 3.9 19.3 18.3 15.9 3.5 3.3 3.0 2.2 2.4 2.6 17.2 4.7 12.1 18.4 17.9 19.2 Media (56) 690,559 1.5 26.9 18.0 15.3 13.6 2.4 2.3 2.1 1.7 2.0 2.1 17.5 21.0 8.7 13.1 14.8 14.8 Retailing (84) 787,901 -0.8 18.5 21.0 18.7 16.0 3.5 3.2 3.0 1.5 1.6 1.8 10.6 11.8 15.0 16.1 16.8 18.2 Food/Staples Retail (52) 657,452 -0.2 9.2 16.1 14.9 13.5 2.2 2.1 1.9 2.4 2.6 2.9 7.3 8.0 10.4 13.9 14.0 14.4 Food Beverage (114) 1,853,657 1.5 11.4 18.1 17.2 15.5 3.4 3.2 2.9 2.8 3.0 3.3 8.0 5.2 10.8 18.3 17.6 18.1 Household Products (29) 500,048 0.9 10.4 19.2 18.6 17.2 3.4 3.2 3.1 2.7 2.9 3.0 1.0 3.1 7.8 18.3 18.2 18.3 Health Care Equip/Svc (64) 657,781 2.9 15.4 15.5 14.2 12.8 2.6 2.2 2.0 1.1 1.2 1.4 9.8 9.6 11.0 17.2 15.7 15.4 Pharma & Biotech (71) 2,071,230 1.7 14.9 13.6 13.5 12.6 3.0 2.8 2.6 2.8 3.0 3.2 3.6 0.8 6.7 21.5 20.8 19.3 Banks (189) 2,617,624 1.9 13.9 10.0 10.0 9.1 1.1 1.1 1.0 3.7 3.9 4.1 11.8 -1.3 10.8 11.1 10.6 10.8 Div Financials (106) 1,202,940 2.9 21.6 13.3 11.8 9.6 0.9 0.8 0.8 1.8 2.0 2.5 -17.4 14.6 21.8 6.6 7.2 8.3 Insurance (98) 1,120,007 1.9 16.5 15.4 10.6 9.8 1.1 1.0 0.9 3.0 3.3 3.5 1.3 47.5 8.0 6.7 9.3 9.4 Real Estate (126) 839,462 0.3 19.9 19.8 20.8 18.8 1.5 1.3 1.2 3.1 3.2 3.4 4.0 -2.6 8.5 7.5 6.3 6.7 Software (79) 1,575,178 0.1 17.3 17.2 15.4 13.6 4.3 3.7 3.2 1.1 1.2 1.3 14.3 11.7 12.6 21.7 23.8 23.3 Tech Hard/Equip (94) 1,378,568 -5.2 12.2 14.6 12.9 11.0 2.2 2.0 1.8 1.1 1.5 2.2 12.0 10.5 17.1 16.4 16.8 17.1 Semis (52) 602,030 -3.1 2.7 13.2 12.6 11.0 2.2 2.1 1.8 2.1 2.3 2.4 -12.2 3.3 18.5 16.6 16.5 16.3 Telecom (89) 1,285,795 -1.3 5.7 12.8 12.7 11.8 1.9 1.8 1.7 4.9 4.6 5.1 -0.8 -0.1 9.2 14.3 13.8 14.3 Utilities (137) 1,023,944 0.6 0.0 13.5 13.2 12.8 1.3 1.3 1.3 4.6 4.5 4.6 -21.7 8.3 15.7 9.0 9.3 9.9 World (2443) 28,531,097 0.1 9.9 13.5 13.1 11.6 1.7 1.6 1.5 2.6 2.8 3.0 7.3 4.0 12.9 12.9 12.6 13.0 Source: Deutsche Bank, I/B/E/S, MSCI. Note: Data in the table are compiled based on MSCI AC World index universe. P/E, P/B, dividend yield, EPS growth and ROE are aggregated using I/B/E/S consensus estimates (calendarized to December year end) with current prices. All numbers are free-float adjusted. Figure 35: Equity market performance 450 450 500 500 MSCI AC World LC Index (LS) 400 MSCI AC World LC Index (LS) 400 450 450 350 350 400 400 300 300 350 350 250 250 300 300 200 200 150 150 250 250 100 100 200 200 50 50 150 150 0 0 100 100 1/73 1/76 1/79 1/82 1/85 1/88 1/91 1/94 1/97 1/00 1/02 1/04 1/06 1/08 1/10 1/12 Source: Deutsche Bank, MSCI Deutsche Bank AG/Hong Kong Page 25
  • 26.
    17 October 2012 TheInvestigator Asia – valuation Asian valuations are moderately below historical averages. The problem is margins – in China they seem to be in a secular decline, while in India they seem to be at a cyclical low. The region cannot rely on asset turns and leverage – both at global levels – to boost relative ROEs compared with the world. It is probably going to have to be EBIT margin expansion that gets the PB up. We don’t see any substantial decline in the cost of equity to boost PB multiples. Figure 36: Composite valuation index Figure 37: Price-to-book value 3 80% 4.0 3.0 Asia ex Japan P/BV (LS) 60% 3.5 2 Rel to World (RS) 2.5 Expensive 40% 3.0 1 2.0 20% 2.5 0 0% 1.5 2.0 Cheap -20% -1 1.0 MSCI Asia ex Japan 12m fd rtn (RS) -40% 1.5 -2 1.0 0.5 Asia ex Japan Composite Valuation Index -60% -3 (S.D., LS) -80% 0.5 0.0 1/73 1/78 1/83 1/88 1/93 1/98 1/03 1/08 1/13 1/73 1/78 1/83 1/88 1/93 1/98 1/03 1/08 1/13 Source: Deutsche Bank, IBES, MSCI. Note: Composite valuation index is the average of trailing P/E, 12m Source: Deutsche Bank, MSCI, DataStream forward P/E, P/Cash Earnings, P/BV, Dividend Yield, EV/EBITDA and EV/Sales, normalized over entire history Figure 38: 12m forward P/E Figure 39: 12m trailing P/E 25 1.6 40 2.0 Asia ex Japan 12m Forward P/E (LS) Asia ex Japan Trailing P/E (LS) 23 1.8 Rel to World (RS) 1.4 35 Rel to World (RS) 21 30 1.6 19 1.2 17 1.4 25 15 1.0 1.2 13 20 1.0 11 0.8 15 0.8 9 0.6 10 0.6 7 5 0.4 5 0.4 1/87 1/92 1/97 1/02 1/07 1/12 1/73 1/78 1/83 1/88 1/93 1/98 1/03 1/08 1/13 Source: Deutsche Bank, MSCI, I/B/E/S Source: Deutsche Bank, MSCI, DataStream Figure 40: EV multiples Figure 41: ROE and EBIT margin 18 3.5 20% 16% Asia ex Japan EV/EBITDA (LS) 18% 15% 16 Asia ex Japan EV/SALES (RS) 3.0 16% 14% 14 14% 13% 2.5 12 12% 12% 2.0 10% 11% 10 8% 10% 1.5 6% 9% 8 4% Asia ex Japan ROE (LS) 8% 6 1.0 2% Asia ex Japan EBIT/Sales (RS) 7% 4 0.5 0% 6% 1/87 1/92 1/97 1/02 1/07 1/12 1/73 1/78 1/83 1/88 1/93 1/98 1/03 1/08 1/13 Source: Deutsche Bank, MSCI, FactSet Source: Deutsche Bank, MSCI, FactSet Page 26 Deutsche Bank AG/Hong Kong
  • 27.
    17 October 2012 TheInvestigator Asia – investor sentiment Risk-love in Asia is at neutral. Figure 42: Asia Risk-Love indicator Figure 43: China and Hong Kong Risk-Love indicator 3.0 100% 3.0 3.0 MSCI AC Asia ex Jp 12m fd rtn (RS) China Risk-Love (SD) 80% 2.0 Asia ex Japan Risk-Love, SD 2.0 Hong Kong Risk-Love (SD) 2.0 Euphoria 60% Euphoria 1.0 40% 1.0 1.0 20% 0.0 0% 0.0 0.0 -20% -1.0 -40% -1.0 -1.0 -2.0 -60% -2.0 -2.0 Panic -80% -3.0 -100% -3.0 Panic -3.0 1/921/941/961/981/001/021/041/061/081/101/12 1/00 1/02 1/04 1/06 1/08 1/10 1/12 Source: Deutsche Bank Source: Deutsche Bank Figure 44: India and Indonesia Risk-Love indicator Figure 45: Korea and Malaysia Risk-Love indicator 3.0 3.0 3.0 3.0 Indonesia Risk-Love (SD ) Korea Risk-Love (SD) 2.0 India Risk-Love (SD) 2.0 2.0 Malaysia Risk-Love (SD) 2.0 Euphoria Euphoria 1.0 1.0 1.0 1.0 0.0 0.0 0.0 0.0 -1.0 -1.0 -1.0 -1.0 -2.0 -2.0 -2.0 -2.0 -3.0 Panic -3.0 -3.0 Panic -3.0 1/00 1/02 1/04 1/06 1/08 1/10 1/12 1/00 1/02 1/04 1/06 1/08 1/10 1/12 Source: Deutsche Bank Source: Deutsche Bank Figure 46: Philippines and Singapore Risk-Love indicator Figure 47: Taiwan and Thailand Risk-Love indicator 3.0 3.0 3.0 3.0 Singapore Risk-Love (SD) Taiwan Risk-Love (SD) 2.0 Philippines Risk-Love (SD) 2.0 2.0 Thailand Risk-Love (SD) 2.0 Euphoria Euphoria 1.0 1.0 1.0 1.0 0.0 0.0 0.0 0.0 -1.0 -1.0 -1.0 -1.0 -2.0 -2.0 -2.0 -2.0 Panic -3.0 Panic -3.0 -3.0 -3.0 1/00 1/02 1/04 1/06 1/08 1/10 1/12 1/00 1/02 1/04 1/06 1/08 1/10 1/12 Source: Deutsche Bank Source: Deutsche Bank Deutsche Bank AG/Hong Kong Page 27
  • 28.
    17 October 2012 TheInvestigator Asia – technicals Technicals are improving – new highs are rising, and new lows have almost vanished. Figure 48: Advance/decline ratio Figure 49: Percentage of stocks above their 200DMA 2.0 2.0 100% 100% 50dma 1.8 1.8 % of stocks above their 200DMA 1.6 Bullish 1.6 80% 80% 1.4 1.4 1.2 1.2 60% 60% 1.0 1.0 0.8 0.8 40% 40% 0.6 10d Advancing 0.6 Issues/Declining Issues 0.4 0.4 20% 20% Bearish 25d Advancing 0.2 Issues/Declining Issues 0.2 0.0 0.0 0% 0% 1/06 1/07 1/08 1/09 1/10 1/11 1/12 1/06 1/07 1/08 1/09 1/10 1/11 1/12 Source: Deutsche Bank, DataStream, FactSet Source: Deutsche Bank, DataStream, FactSet Figure 50: Relative Strength Index Figure 51: Market breadth 40 40 100% 100% 22-day RSI 30 Bullish 30 20 20 50% 50% 10 10 0% 0% 0 0 1/06 1/07 1/08 1/09 1/10 1/11 1/12 -10 -10 -50% -50% -20 -20 Bearish Market breadth -30 -30 Asia ex-Japan -100% -100% 1/06 1/08 1/10 1/12 -40 -40 Source: Deutsche Bank, DataStream, FactSet Source: Deutsche Bank, DataStream, FactSet. Market breadth is defined as (# of sub-sectors up on 6 months basis minus # of sub-sectors down on 6 months basis) / total sub-sectors available. Figure 52: Percentage of stocks at 52w Highs Figure 53: Percentage of stocks at 52w Lows 30% 30% 50% 50% % of stocks at 52W Highs % of stocks at 52W Lows 25% 25% 40% 40% 20% 20% 30% 30% 15% 15% Bearish 20% Bearish 20% 10% 10% 5% 5% 10% 10% 0% 0% 0% 0% 1/06 1/07 1/08 1/09 1/10 1/11 1/12 1/06 1/07 1/08 1/09 1/10 1/11 1/12 Source: Deutsche Bank, DataStream, FactSet Source: Deutsche Bank, DataStream, FactSet Page 28 Deutsche Bank AG/Hong Kong
  • 29.
    17 October 2012 TheInvestigator Asia – growth and earnings Asia’s leading economic indicators are bottoming, and policy is no longer being tightened. Analysts have taken the knife to this year’s EPS growth forecasts from around 13% at the start of the year to 5% now. We think that EPS revisions and economic surprises are about bottoming now. Figure 54: Leading economic and composite policy Figure 55: Economic surprises indicators 30% S.D. 1.2 40% Asia ex-Japan Easy Monetary/Fiscal 60 25% Policy 0.8 30% 45 20% 20% 30 0.4 10% 15 15% 0 0% 0 10% -15 -0.4 -10% 5% -20% -30 Tight Monetary/ -0.8 -45 0% Fiscal Policy -30% -60 -5% Asia Composite Leading Indicator* YoY% (LS) -1.2 -40% -75 Asia Composite Policy Indicator** (S.D., RS) 12m forward earnings revisions index, LS -10% -1.6 -50% -90 Economic Surprise Index, RS 1/70 1/75 1/80 1/85 1/90 1/95 1/00 1/05 1/10 -60% -105 1/03 1/04 1/05 1/06 1/07 1/08 1/09 1/10 1/11 1/12 Source: Deutsche Bank, CEIC, DataStream, Bloomberg Finance LP. Note: *Market cap weighted Source: Deutsche Bank, Citigroup, Bloomberg Finance LP average of composite leading economic indicators growth for China, India, Korea and Taiwan. **GDP weighed average of composite policy indicators for China, HK, India, Indonesia, Korea, Malaysia, Philippines, Spore, Taiwan & Thailand. Figure 56: Earnings growth forecast (%) Figure 57: 12m forward growth forecast by sector 25 25 30 12m fwd EPS growth (%) 30 12/2011F 23 12/2012F 23 Latest 1m Ago 24 24 21 12/2013F 21 19 19 18 18 17 17 12 12 15 15 6 6 13 13 11 11 0 0 Materials Health Care Cons Staples Financials Telecom Industrials Energy Info Tech Asia ex Jp Utilities Cons Disc 9 9 7 MSCI AC World 7 5 5 1/09 7/09 1/10 7/10 1/11 7/11 1/12 7/12 Source: Deutsche Bank, I/B/E/S, MSCI Source: Deutsche Bank, I/B/E/S, MSCI Figure 58: 12m forward EPS revisions by sector Figure 59: 12m forward EPS revisions by country 30 30 0 0 15 15 0 0 -20 -20 -15 -15 -30 -30 -40 -40 -45 -45 1m EPS revisions (%) -60 1m EPS revisions (%) -60 -60 -60 -75 -75 -90 -90 -80 -80 Taiwan Singapore Materials Malaysia Asia Ex Jp Telecom Thailand Health Care Financials Cons Staples Indonesia Industrials Info Tech Asia ex Jp Energy India China Utilities Korea Philippines Cons Disc Hong Kong Source: Deutsche Bank, I/B/E/S, MSCI Source: Deutsche Bank, I/B/E/S, MSCI Deutsche Bank AG/Hong Kong Page 29
  • 30.
    17 October 2012 TheInvestigator Asia – liquidity New issuance and secondaries have been paltry – a good positive contrarian indicator. Foreign fund flows have resumed in earnest as markets have rallied. Figure 60: M2/market cap Figure 61: Free liquidity 145% 145% 20% 20% Asia ex-Japan 120% 120% 95% 95% 10% 10% 70% 70% 0% 0% 45% 45% 20% 20% -10% -10% -5% -5% Aggregate Asia ex Japan (China, India, -30% -30% Korea & Taiwan) Narrow Money -20% -20% Growth less CPI Inflation less Leading -55% M2 / Market Cap, YoY% -55% Economic Indicator Growth -80% -80% -30% -30% 1/87 1/90 1/93 1/96 1/99 1/02 1/05 1/08 1/11 1/14 1/96 1/98 1/00 1/02 1/04 1/06 1/08 1/10 1/12 Source: Deutsche Bank, DataStream, Bloomberg Finance LP Source: Deutsche Bank, DataStream, Bloomberg Finance LP Figure 62: Asia-focused hedge fund exposure estimates Figure 63: 6m total equity offerings* as percentage of total market cap in Asia ex Japan 100% 100% 1.0% 6m total IPOs & addl offerings as of Sep 2012 2.5% Asia ex Japan Long Short Equities 0.9% = U$38.6bn (excl China A); U$47.9bn (incl Hedge Fund Exposure Proxy 0.8% China A) 2.0% 80% 80% 0.7% 61% 0.6% 1.5% 60% 60% 0.5% 0.4% 6m total IPOs & additional offerings as 1.0% 40% 40% 0.3% % of M2 (excl A shs), LS 0.2% 0.5% 6m total IPOs & addl offerings as % of 20% 20% 0.1% market cap (excl A shs), RS Based on 6 month rolling beta on MSCI AXJ returns 0.0% 0.0% 0% 0% 1/99 1/01 1/03 1/05 1/07 1/09 1/11 1/00 1/02 1/04 1/06 1/08 1/10 1/12 Source: Deutsche Bank, Bloomberg Finance LP Source: Deutsche Bank, Bloomberg Finance LP, DataStream. Note: *Equity offerings includes IPO and additional equity offerings of primary and secondary shares. Figure 64: Foreign fund flows Figure 65: Foreign fund flows 4 4 4 Korea Taiwan Philippines 4 Indonesia 3 India 3 2 Thailand 2 2 2 1 1 0 0 0 0 -1 -1 -2 -2 -3 Deviation from 3-yr average -3 -2 -2 3m net inflows (S.D.) -4 3m net inflows (S.D.) -4 Deviation from 3-yr average -5 -5 -4 -4 1/05 1/07 1/09 1/11 1/05 1/07 1/09 1/11 Source: Deutsche Bank, Bloomberg Finance LP Source: Deutsche Bank, Bloomberg Finance LP Page 30 Deutsche Bank AG/Hong Kong
  • 31.
    17 October 2012 TheInvestigator Asia – factor performance Value strategies and high profitability have done well this year, while high projected growth stocks have been punished. Figure 66: Best- and worst-performing factors (1-mth) Figure 67: Best- and worst-performing factors (YTD) 2.5 % 8 % 2.0 1.5 4 1.0 0.5 0 0.0 -0.5 Best quintile vs market Best quintile vs market -1.0 -4 1-mth performance spread YTD performance spread -1.5 -2.0 -8 Low P/Op Inc High FY1 EPS Rev Low P/BV Low Price/Sales High 6m Price Low FY2 EPS Disp Low P/FCF Low 12m Fd P/E High Price Up/Dn High LT Gth Est Low P/Op Inc Low EV/Sales Low Capex/Sales Low Price/Sales High 5yr Sales Gth High 6m Price High Cash ROC, High 3m chg in High 5yr EPS Gth High FY2 Gth Est Price Mom yoy chg Mom Mom Days AXJ AXJ Source: Deutsche Bank Source: Deutsche Bank Deutsche Bank AG/Hong Kong Page 31
  • 32.
    17 October 2012 TheInvestigator Figure 68: Factor performance (sector neutral**) Bes t quint ile vs m a r ket r ela t ive per f or m a nc e (%) As ia ex J a pa n Returns Ann. Rtn. Returns Ann. Rtn. S ep 30, 12 YTD 1m 3m 6m 12m 5y 10y 15y YTD 1m 3m 6m 12m 5y 10y 15y Valuation Profitability Low 12m Fd P/E 1.2 2.1 -0.1 -0.4 3.3 5.6 7.8 5.7 High Cash ROC 3.2 -0.5 -0.1 0.3 3.7 6.0 4.4 6.8 Low Trailing P/E 3.6 1.3 0.4 0.2 4.0 8.6 8.4 7.8 High Cash ROC, yoy chg 4.6 -0.5 -0.2 2.1 6.4 3.5 3.3 3.6 Low P/Op Inc 4.4 1.6 -0.2 1.8 6.3 7.6 8.0 6.8 High ROE 4.1 -0.3 1.3 2.5 4.7 3.2 3.3 3.7 Low P/BV -1.4 2.2 0.0 -1.9 -0.7 3.0 3.6 1.1 High ROE, yoy chg 3.1 -0.3 0.8 1.5 4.6 3.8 3.5 3.5 Low Price/Sales 5.5 2.1 2.2 4.2 4.6 2.1 3.7 1.9 Aver a ge 3.8 -0.4 0.5 1.6 4.8 4.1 3.6 4.4 Low P/FCF 1.5 -1.2 0.4 2.8 1.7 3.9 3.0 5.3 Growth Low EV/EBIT 4.3 -0.8 0.9 3.4 6.3 8.4 7.4 7.8 High 3yr Sales Gth -2.0 0.5 -1.0 -1.8 -0.2 -2.5 -1.7 -3.4 Low EV/EBITDA 1.1 -0.1 0.9 1.4 3.0 7.0 6.3 7.6 High 5yr Sales Gth -2.5 0.6 -2.3 -4.0 0.1 -2.7 -0.9 -1.6 Low EV/Cap Emp 0.3 1.2 2.0 0.7 2.6 3.5 3.3 2.3 High 3yr EPS Gth 2.7 -0.8 0.4 1.5 3.5 -0.7 0.8 -1.2 Low EV/Sales 5.5 0.6 1.3 3.6 6.7 6.0 5.5 5.9 High 5yr EPS Gth -3.7 -0.6 -1.5 -4.2 -2.9 -2.3 -0.6 -0.1 Low EV/Op CF 2.4 -0.2 1.1 2.3 2.8 6.6 6.2 8.8 High LT Gth Est 0.3 1.9 -0.3 -1.5 -0.2 -2.4 1.8 1.0 Low EV/FCF 2.5 -0.9 0.8 2.6 2.9 4.5 3.5 6.3 High FY1 Gth Est -2.2 0.5 -0.5 -3.1 -0.3 -1.6 1.0 -1.2 High Dividend Yield 3.4 1.1 2.0 3.4 2.4 8.2 7.4 10.0 High FY2 Gth Est -2.6 1.6 -2.1 -5.3 -1.0 -4.1 -0.1 -1.7 Aver a ge 2.6 0.7 0.9 1.9 3.5 5.8 5.7 6.0 Aver a ge -1.4 0.5 -1.1 -2.6 -0.2 -2.3 0.0 -1.2 Price Momentum Stability High 6m Price Mom -4.2 -1.3 -1.0 0.4 -8.5 -4.7 -0.3 -0.5 Low EPS Vola 1.8 0.1 0.9 3.9 0.1 2.2 0.6 2.3 High 9m Price Mom 0.3 -0.3 0.2 3.0 -3.0 -5.2 1.1 1.5 Low Op Inc Vola 3.7 0.0 0.2 4.2 3.6 2.9 1.5 3.1 High 12m Price Mom 1.9 -0.8 0.6 3.6 -1.1 -4.3 1.2 1.1 Low Book Value Vola 0.4 -0.9 -0.1 0.7 0.7 0.3 0.7 0.6 High Price Rel Strg -0.4 -0.8 0.9 2.7 -2.0 -4.1 1.1 2.4 Low Sales Vola 0.7 -0.7 0.1 0.8 -1.7 -0.8 -0.9 1.5 High 3m chg in Price Mom -2.8 -0.4 -2.1 -1.9 -7.3 -4.0 0.0 -1.3 Low EPS Est Vola 3.6 -0.1 1.3 4.2 1.6 2.6 -1.8 0.7 High Price Up/Dn Days -0.1 -1.5 -0.2 2.1 -2.0 0.7 1.8 1.7 Aver a ge 2.1 -0.3 0.5 2.7 0.9 1.4 0.0 1.6 Aver a ge -0.9 -0.8 -0.3 1.7 -4.0 -3.6 0.8 0.8 Risk Earnings Momentum Low FY1 EPS Disp 1.1 0.0 1.6 3.3 -2.7 1.1 0.9 4.5 High FY1 EPS Mom -0.6 -0.5 -1.5 0.1 0.0 -0.1 3.0 1.4 Low FY2 EPS Disp 2.8 -1.4 1.3 4.2 -0.6 0.7 0.5 3.3 High FY2 EPS Mom 1.0 0.3 1.1 2.1 1.2 0.8 4.9 4.8 High EBIT/Int Exp 3.2 -1.0 0.4 2.7 1.9 3.7 2.7 5.2 High 12m Fd EPS Mom -0.7 -0.7 0.2 0.5 0.0 -0.4 4.6 3.9 Low Debt/Equity 0.8 -0.6 1.4 2.1 0.7 3.1 1.1 2.6 High FY1 EPS Rev 2.3 -1.5 1.6 3.2 0.5 0.2 4.5 3.9 High Altman Z Score 0.6 -0.8 1.2 1.5 -3.3 -1.0 -1.6 -0.7 High FY2 EPS Rev 1.4 -0.8 2.0 3.2 -1.2 0.2 4.7 3.5 High Market Cap -2.3 -0.4 -0.9 -0.3 -0.3 -0.5 0.6 1.7 Aver a ge 0.7 -0.7 0.7 1.8 0.1 0.1 4.3 3.5 Aver a ge 1.0 -0.7 0.8 2.3 -0.7 1.2 0.7 2.8 Capex Deployment & Earnings Accruals Consensus Ratings Low Capex/Depr 3.4 -0.7 0.7 2.1 3.9 0.4 -1.5 -1.7 High Analyst Rec 1.3 -0.2 0.0 0.9 2.3 2.7 3.3 6.9 Low Capex/Sales 6.0 -0.3 3.5 5.9 5.0 4.3 2.1 1.8 High Analyst Rec 1m chg 2.2 -0.4 0.5 0.0 3.4 3.3 4.8 4.7 Low Capex/FA 1.5 0.5 1.7 2.7 3.5 -2.7 -2.8 -3.7 Aver a ge 1.7 -0.3 0.2 0.4 2.8 3.0 4.1 5.8 High Receivables yoy chg 0.9 -0.3 0.1 0.1 1.4 0.4 0.1 1.1 Low Inventory yoy chg -1.0 -0.4 -0.6 0.6 -0.8 -0.7 0.6 1.9 Low Payables yoy chg -2.0 0.4 0.5 -2.1 -1.4 -2.3 -1.9 -0.7 Aver a ge 1.5 -0.1 1.0 1.6 1.9 -0.1 -0.6 -0.2 Source: Deutsche Bank, FactSet, I/B/E/S. Note: *1m, 3m, 6m, 12m, 5yr, 10yr and 15yr returns are as of month ended Sep 2012. **Quintile baskets are formed on a regional sector relative basis. Relative performance is based on equal weighted average returns of the best quintile basket and the market. For description on factors please see appendix A. Page 32 Deutsche Bank AG/Hong Kong
  • 33.
    17 October 2012 TheInvestigator Asia – market intelligence Figure 69: Equity market performance 500 220 800 170 MSCI Asia ex Japan LC Index (LS) MSCI Asia ex Japan LC Index (LS) 450 200 Rel to World (RS) 700 Rel to World (RS) 150 400 180 350 160 600 130 300 140 250 500 110 120 200 100 400 90 150 100 80 300 70 50 60 0 40 200 50 1/73 1/78 1/83 1/88 1/93 1/98 1/00 1/02 1/04 1/06 1/08 1/10 1/12 Source: Deutsche Bank, MSCI. Figure 70: Market intelligence by sector 11Oct12 Mcap LC Perf P/E (x) P/B (x) Div Yld (%) EPSg (%) ROE (%) Sector (#Co) U$m 1m YTD CY11 CY12 CY13 CY11 CY12 CY13 CY11 CY12 CY13 CY11 CY12 CY13 CY11 CY12 CY13 Energy (30) 193,608 4.5 4.1 9.4 10.3 9.4 1.6 1.5 1.4 3.3 3.1 3.3 18.7 -8.0 10.1 17.6 14.4 14.5 Materials (69) 186,673 2.5 0.3 11.4 13.1 10.9 1.4 1.3 1.2 2.9 2.3 2.7 -10.3 -17.2 24.5 11.8 10.3 11.6 Capital Goods (79) 203,519 1.3 8.3 11.2 11.8 10.5 1.4 1.3 1.2 2.4 2.5 2.6 9.2 -5.8 11.5 13.2 11.1 11.4 Comm Svc (1) 1,039 2.6 16.9 19.5 18.2 16.3 3.2 3.2 3.2 1.8 1.9 2.0 7.1 7.1 11.4 16.4 17.5 19.8 Transportation (32) 51,603 3.6 5.5 17.5 19.1 14.2 1.3 1.2 1.1 2.7 2.6 2.9 nm 51.0 48.1 7.6 6.0 7.7 Autos (25) 133,869 2.8 10.3 12.7 8.7 7.8 2.2 1.8 1.5 1.0 1.4 1.5 -1.4 53.7 10.3 16.5 20.8 19.1 Cons Durables (12) 20,901 0.8 4.5 31.9 12.9 10.6 2.7 1.5 1.3 2.1 2.6 2.9 -61.7 147.9 21.7 0.6 11.0 12.7 Cons Svc (13) 45,955 -0.4 5.2 17.6 16.4 14.3 3.0 2.6 2.3 2.5 2.4 2.7 22.1 7.1 15.1 15.6 14.7 14.9 Media (3) 8,871 4.8 20.6 20.7 19.4 18.1 3.9 3.8 3.7 4.4 4.5 4.8 -11.7 6.6 7.1 19.0 19.7 20.6 Retailing (18) 39,949 -0.1 -10.4 15.7 14.9 12.5 2.1 1.9 1.7 2.7 2.5 2.9 -16.2 5.2 19.5 13.0 12.6 13.6 Food/Staples Retail (7) 22,630 2.5 0.6 25.1 19.3 17.1 3.4 2.3 2.1 2.0 1.9 2.2 11.5 12.3 12.9 13.6 11.7 12.2 Food Beverage (29) 95,862 3.6 7.9 20.1 19.6 16.6 2.8 2.5 2.3 2.1 2.2 2.5 -4.8 2.3 18.3 14.5 12.9 14.1 Household Products (8) 32,998 2.0 26.8 40.8 31.3 26.4 6.6 5.1 4.6 1.3 1.5 1.8 12.9 30.4 18.5 23.4 26.8 21.4 Health Care Equip/Svc (4) 8,037 10.1 37.0 30.4 27.9 23.1 2.8 2.3 2.1 0.9 0.7 0.9 21.5 22.1 20.8 9.2 8.1 9.0 Pharma & Biotech (10) 18,318 -0.7 22.1 25.7 21.6 18.2 3.2 2.9 2.8 1.1 0.9 0.9 14.8 19.3 14.0 13.0 13.9 17.7 Banks (66) 483,438 5.1 11.7 9.3 8.9 8.4 1.4 1.3 1.1 3.4 3.7 3.9 23.9 8.4 3.3 15.3 14.8 13.8 Div Financials (24) 63,029 6.2 7.8 14.6 15.2 14.1 1.7 1.7 1.5 2.8 2.7 2.9 2.5 -4.1 8.9 11.5 10.6 10.9 Insurance (14) 114,962 6.0 14.3 20.0 16.1 14.0 2.0 1.8 1.6 1.3 1.4 1.7 -10.3 24.4 14.8 10.1 11.2 11.5 Real Estate (45) 187,422 3.7 29.6 12.9 13.6 12.5 1.0 0.9 0.9 3.0 2.8 3.0 15.5 -4.9 9.1 8.0 7.1 7.1 Software (9) 86,665 0.0 19.0 24.6 20.7 17.4 6.7 5.4 4.3 0.9 1.0 1.1 21.9 18.8 18.8 27.3 26.0 24.7 Tech Hard/Equip (39) 121,519 -3.5 0.3 16.2 13.2 10.8 1.4 1.4 1.3 2.7 2.8 3.4 -46.7 35.8 41.0 12.0 11.3 13.0 Semis (24) 268,958 1.7 15.7 16.4 11.6 9.6 2.0 2.0 1.7 1.8 1.9 2.0 -30.2 41.3 21.5 12.5 16.9 17.6 Telecom (26) 178,368 2.0 10.1 14.8 14.4 13.3 2.2 2.0 1.9 3.9 4.1 4.3 1.2 2.7 8.1 14.7 13.8 13.9 Utilities (29) 102,839 4.0 14.3 17.8 15.2 13.9 2.1 1.9 1.7 2.3 2.6 2.9 -21.4 43.9 26.3 5.6 8.2 9.9 Asia ex Japan (616) 2,671,032 2.8 9.9 13.1 12.2 10.9 1.7 1.5 1.4 2.6 2.7 2.9 -1.4 9.7 13.0 12.4 12.8 12.9 Source: Deutsche Bank, I/B/E/S, MSCI. Note: Data in the table are compiled based on MSCI AC Asia ex Japan index universe. P/E, P/B, dividend yield, EPS growth and ROE are aggregated using I/B/E/S consensus estimates (calendarized to December year end) with current prices. All numbers are free-float adjusted. Figure 71: Market Expected Return Indicator for Asia ex-Japan 8 Market Expected Return Indicator, LS 800 6 Asia ex-Japan MSCI AXJ , RS 700 4 600 2 Bullish 500 0 400 -2 -4 300 -6 Bearish 200 -8 100 1/92 1/93 1/94 1/95 1/96 1/97 1/98 1/99 1/00 1/01 1/02 1/03 1/04 1/05 1/06 1/07 1/08 1/09 1/10 1/11 1/12 Source: Deutsche Bank, MSCI, Bloomberg Finance LP Deutsche Bank AG/Hong Kong Page 33
  • 34.
    17 October 2012 TheInvestigator Japan – valuations Japanese stocks continue to look undervalued versus history. A return to credible inflation and higher nominal GDP growth globally is required to unlock value. Recent tensions with China are unhelpful for risk assets in Japan. Figure 72: Composite valuation index Figure 73: Price-to-book value 3 60% 6.0 2.5 MSCI Japan 12m fd rtn (RS) Japan P/BV (LS) 2 Japan Composite Valuation Index (S.D., LS) 40% 5.0 Rel to World (RS) 2.0 Expensive 1 20% 4.0 1.5 0 0% 3.0 1.0 -1 -20% 2.0 Cheap 0.5 -2 -40% 1.0 -3 -60% 0.0 0.0 1/73 1/79 1/85 1/91 1/97 1/03 1/09 1/73 1/78 1/83 1/88 1/93 1/98 1/03 1/08 1/13 Source: Deutsche Bank, IBES, MSCI. Note: Composite valuation index is the average of trailing P/E, 12m Source: Deutsche Bank, MSCI, DataStream. Note: Market relative = relative to MSCI AC Asia ex Japan. forward P/E, P/Cash Earnings, P/BV, Dividend Yield, EV/EBITDA and EV/Sales, normalized over entire history. Figure 74: 12m forward P/E Figure 75: 12m trailing earnings yield 85 4.1 10 1.2 Japan 12m Forward P/E (LS) Japan Trailing Earnings Yield (LS, %) 75 9 Rel to World (RS) 3.6 Rel to World (RS) 1.0 8 65 3.1 7 0.8 55 6 2.6 45 5 0.6 2.1 4 35 3 0.4 25 1.6 2 0.2 15 1.1 1 5 0.6 0 0.0 1/87 1/92 1/97 1/02 1/07 1/12 1/73 1/78 1/83 1/88 1/93 1/98 1/03 1/08 1/13 Source: Deutsche Bank, MSCI, I/B/E/S. Note: Market relative = relative to MSCI AC Asia ex Japan. Source: Deutsche Bank, MSCI, DataStream. Note: Market relative = relative to MSCI AC Asia ex Japan. Figure 76: EV multiples Figure 77: ROE and EBIT margin 1.7 14% 9% 19 Japan EV/EBITDA (LS) 12% 8% Japan EV/SALES (RS) 1.5 17 10% 7% 15 1.3 8% 6% 6% 13 5% 1.1 4% 4% 11 2% 0.9 0% 3% 9 -2% Japan ROE (LS) 2% 7 0.7 -4% Japan EBIT/Sales (RS) 1% 5 0.5 -6% 0% 1/87 1/92 1/97 1/02 1/07 1/12 1/73 1/78 1/83 1/88 1/93 1/98 1/03 1/08 1/13 Source: Deutsche Bank, MSCI, FactSet Source: Deutsche Bank, MSCI, FactSet Page 34 Deutsche Bank AG/Hong Kong
  • 35.
    17 October 2012 TheInvestigator Japan – investor sentiment Sentiment is at neutral levels. Figure 78: Equity Risk-Love indicator Figure 79: Market volatility (inverted scale) 1.5 TOPIX 6m fwd rtn (RS) 30% 0.6 0.6 Nikkei 225 Options Put/Call Volume Ratio JP Risk-Love, SD (LS) (4w Rolling, Inverted Scale) 1.0 20% 0.8 0.8 Euphoria 0.5 10% 1 Euphoria 1 0.0 0% 1.2 1.2 -0.5 -10% 1.4 1.4 Panic -1.0 -20% 1.6 1.6 Panic -1.5 -30% 1.8 1.8 1/00 1/02 1/04 1/06 1/08 1/10 1/12 1/04 1/05 1/06 1/07 1/08 1/09 1/10 1/11 1/12 1/13 Source: Deutsche Bank, Bloomberg Finance LP Source: Deutsche Bank, DataStream Figure 80: Asset allocation to stocks for publicly offered Figure 81: Percentage premium to NAV of closed-end investment trusts of contractual type equity funds 35 % of assets in stocks for publicly offered 35 20 30 % premium to NAV of closed-end equity funds investment trusts of contractual type (%) 15 25 30 12m mov avg 30 20 10 15 5 Euphoria 25 25 10 Euphoria 0 5 20 20 -5 0 -5 -10 Panic 15 15 -10 Panic -15 Japan Equity Fund (RS) -15 10 10 -20 Japan Smaller Capitalization Fund (LS) -20 1/95 1/97 1/99 1/01 1/03 1/05 1/07 1/09 1/11 1/13 1/04 1/05 1/06 1/07 1/08 1/09 1/10 1/11 1/12 1/13 Source: Deutsche Bank, SENTIX Capital Markets Survey. Source: Deutsche Bank, Cabinet Office, Shoko Chukin Bank. Figure 82: Market volatility Figure 83: Margin ratio 8.0 8.0 0 0 Tokyo Stock Exchange Long/Short Margin S.D. Euphoria S.D. 7.0 7.0 0.5 0.5 Ratio 1 1 6.0 6.0 1.5 1.5 5.0 Euphoria 5.0 2 2 4.0 4.0 2.5 2.5 3.0 3.0 3 3 2.0 2.0 Panic 3.5 3.5 Nikkei 225 100-Day Price Volatility 1.0 Panic 1.0 4 4 (Inverted Scale) 0.0 0.0 4.5 4.5 1/95 1/98 1/01 1/04 1/07 1/10 1/13 1/95 1/97 1/99 1/01 1/03 1/05 1/07 1/09 1/11 1/13 Source: Deutsche Bank, DataStream Source: Deutsche Bank, Tokyo Stock Exchange. Deutsche Bank AG/Hong Kong Page 35
  • 36.
    17 October 2012 TheInvestigator Japan – technicals Technicals are mixed. Figure 84: Advance/decline ratio Figure 85: Percentage of stocks above their 200dma 2.0 2.0 100% 100% 10d Advancing Issues/Declining Issues % of stocks above their 200dma 1.8 1.8 1.6 25d Advancing Issues/Declining Issues 1.6 80% 80% 1.4 Bullish 1.4 1.2 1.2 60% 60% 1.0 1.0 0.8 0.8 40% 40% 0.6 0.6 0.4 0.4 20% 20% 0.2 Bearish 0.2 0.0 0.0 0% 0% 1/06 1/07 1/08 1/09 1/10 1/11 1/12 1/06 1/07 1/08 1/09 1/10 1/11 1/12 Source: Deutsche Bank, DataStream, FactSet Source: Deutsche Bank, DataStream, FactSet Figure 86: Relative Strength Index Figure 87: Market breadth 40 40 100% 100% 22-day RSI Japan 30 30 75% 75% Bullish 20 20 50% 50% 10 10 25% 25% 0% 0% 0 0 1/06 1/07 1/08 1/09 1/10 1/11 1/12 -25% -25% -10 -10 -50% -50% -20 -20 -75% -75% -30 Bearish -30 Market breadth -100% -100% 1/06 1/07 1/08 1/09 1/10 1/11 1/12 1/13 -40 -40 Source: Deutsche Bank, DataStream, FactSet Source: Deutsche Bank, DataStream, FactSet. Market breadth is defined as (# of sub-sectors up on 6 months basis minus # of sub-sectors down on 6 months basis) / total sub-sectors available. Figure 88: Percentage of stocks at 52w Highs Figure 89: Percentage of stocks at 52w Lows 30% 30% 14% % of stocks at their 52W Highs 14% 25% % of stocks at their 52W Lows 25% 12% 12% 10% 10% 20% 20% 8% 8% 15% 15% 6% Bearish 6% 10% 10% 4% 4% 2% 2% 5% 5% 0% 0% 0% 0% 1/06 1/07 1/08 1/09 1/10 1/11 1/12 1/13 1/06 1/07 1/08 1/09 1/10 1/11 1/12 1/13 Source: Deutsche Bank, DataStream, FactSet Source: Deutsche Bank, DataStream, FactSet Page 36 Deutsche Bank AG/Hong Kong
  • 37.
    17 October 2012 TheInvestigator Japan – growth and earnings Economic surprises are nasty and mean-reverting. They are probably going to get less bad. EPS revisions continue to slide. Figure 90: Leading economic indicators Figure 91: Earnings revisions and economic surprises 15% 55 40% Japan 100 10% 50 20% 50 5% 45 0% 0 0% 40 -20% -50 -5% 35 -40% OECD Japan Leading Economic Indicator -10% (LS, YoY%) - Aug 2012 30 12m forward earnings revisions index, LS -100 -60% Small & Med Enterprise Survey Expectation Economic surprise index, RS -15% Index (RS) - Sep 2012 25 -80% -150 1/90 1/93 1/96 1/99 1/02 1/05 1/08 1/11 1/03 1/04 1/05 1/06 1/07 1/08 1/09 1/10 1/11 1/12 1/13 Source: Deutsche Bank, OECD, DataStream Source: Citigroup, I/B/E/S, Factset Figure 92: Composite policy indicator Figure 93: Earnings growth forecast (%) 100 100 1.0 S.D. S.D. 1.0 Easy Monetary/Fiscal Policy 80 80 0.5 0.5 60 60 0.0 0.0 40 03/2012F 40 03/2013F 20 20 -0.5 -0.5 03/2014F 0 0 -1.0 -1.0 -20 -20 Tight Monetary/Fiscal Policy Japan MSCI Japan -1.5 -1.5 -40 -40 1/81 1/85 1/89 1/93 1/97 1/01 1/05 1/09 1/13 1/09 7/09 1/10 7/10 1/11 7/11 1/12 7/12 Source: Deutsche Bank, CEIC, DataStream, Bloomberg Finance LP, IMF. Note: Composite policy indicator Source: Deutsche Bank, MSCI, I/B/E/S is a normalized average of real effective exchange rate yoy growth, real broad money (M2) y-o-y growth, short term real interest rate and government fiscal deficit/surplus as a % of GDP. Figure 94: 12m forward EPS revisions by sector Figure 95: 12m forward EPS growth forecast by sector 40 40 180 12m fwd EPS growth (%) 180 20 1m EPS revisions (%) 20 150 Latest 150 0 0 120 1m Ago 120 90 90 -20 -20 60 60 -40 -40 30 30 -60 -60 0 0 -80 -80 -30 -30 Japan Japan Materials Materials Financials Cons Staples Health Care Telecom Health Care Telecom Industrials Cons Staples Financials Industrials Info Tech Energy Info Tech Energy Utilities Cons Disc Cons Disc Source: Deutsche Bank, MSCI, I/B/E/S. Note: EPS revisions = number of upward less downward revisions Source: Deutsche Bank, MSCI, I/B/E/S as % of total number of revisions in one month. Deutsche Bank AG/Hong Kong Page 37
  • 38.
    17 October 2012 TheInvestigator Japan – liquidity Fund flows are weak and the market continues to underperform the world as US 10- year bond yields remain suppressed. Figure 96: M2/market cap Figure 97: Free liquidity 100% 100% 40% 40% Japan Japan Narrow Money Growth less CPI 80% 80% 35% Inflation less Leading Economic Indicator 35% 60% 60% 30% 30% 40% 40% 25% 25% 20% 20% 20% 20% 0% 0% 15% 15% -20% -20% 10% 10% -40% -40% 5% 5% -60% -60% 0% 0% M2 / Market Cap, YoY% -5% -5% -80% -80% 1/73 1/78 1/83 1/88 1/93 1/98 1/03 1/08 1/13 -10% -10% 1/85 1/89 1/93 1/97 1/01 1/05 1/09 1/13 Source: Deutsche Bank, DataStream Source: Deutsche Bank, DataStream Figure 98: Foreign fund flows into equities Figure 99: IPOs and additional equity offerings (6m rolling) as % of total market cap 4 4 1.8% 1.8% 3m net inflows (S.D.) 6m total IPOs & addl offerings as of Jul 12* = 3 3 1.6% U$9.5bn 1.6% 1.4% 1.4% 2 2 6m total IPOs & addl offerings as % of 1.2% 1.2% 1 1 total market cap, Japan 1.0% 1.0% 0 0 0.8% 0.8% 1/03 1/05 1/07 1/09 1/11 0.6% 0.6% -1 -1 0.4% 0.4% -2 -2 0.2% 0.2% -3 Japan -3 0.0% 0.0% Deviation from 1-yr average 1/99 1/01 1/03 1/05 1/07 1/09 1/11 -4 -4 Source: Deutsche Bank, Bloomberg Finance LP Source: Deutsche Bank, Bloomberg Finance LP, DataStream. Note: *Equity offerings includes IPO and additional equity offerings of primary and secondary shares. Figure 100: US 10-year bond yield and Nikkei 225 Figure 101: Japan yield curve 10.2 % US 10Yr Bond Yield, LS 35000 3.5 110 Japan yield curve (10yr yield 100 9.2 Nikkei 225, RS 30000 3.0 less 3m yield), LS 8.2 90 7.2 25000 2.5 Topix banks/ Topix Index, RS 80 6.2 70 20000 2.0 5.2 60 4.2 15000 1.5 50 3.2 40 10000 1.0 2.2 30 1.2 5000 0.5 20 1/90 1/93 1/96 1/99 1/02 1/05 1/08 1/11 1/94 1/98 1/02 1/06 1/10 Source: Deutsche Bank, DataStream Source: Deutsche Bank, DataStream Page 38 Deutsche Bank AG/Hong Kong
  • 39.
    17 October 2012 TheInvestigator Japan – factor performance Value remains the long-term winner. Figure 102: Best- and worst-performing factors (1-mth) Figure 103: Best- and worst-performing factors (YTD) 2.0 % Best quintile vs market 12 % Best quintile vs market 1.5 1-mth performance spread 8 YTD performance spread 1.0 4 0.5 0.0 0 -0.5 -4 -1.0 -8 -1.5 -12 Low Capex/Depr High FY2 EPS Rev High 5yr Sales Gth Low Capex/Sales Low P/BV Low Price/Sales Low EV/Cap Emp High Cash ROC High FY2 EPS High Price Up/Dn High 12m Price Low Capex/Depr Low Capex/FA High 5yr EPS Gth Low Price/Sales High Receivables Low EPS Est Vola High Altman Z High FY2 EPS High FY2 Gth Est Mom Mom Score yoy chg Mom JP Days JP Source: Deutsche Bank Source: Deutsche Bank Figure 104: Factor performance (sector neutral**) Bes t quint ile vs m a r ket r ela t ive per f or m a nc e (%) J a pa n Returns Ann. Rtn. Returns Ann. Rtn. S ep 30, 12 YTD 1m 3m 6m 12m 5y 10y 15y YTD 1m 3m 6m 12m 5y 10y 15y Valuation Profitability Low 12m Fd P/E -1.9 -0.5 -2.2 -3.1 -1.0 -1.6 3.0 5.5 High Cash ROC 3.9 -0.8 2.1 6.3 5.4 1.3 1.9 2.5 Low Trailing P/E 0.8 0.2 1.0 0.7 2.4 2.5 4.4 7.4 High Cash ROC, yoy chg 3.1 0.1 0.5 3.3 6.3 2.1 3.1 2.4 Low P/Op Inc -1.2 0.4 -1.7 -2.2 0.3 4.1 6.4 6.4 High ROE 6.3 -0.4 4.1 7.1 7.9 -1.1 0.2 1.7 Low P/BV -3.2 1.0 -1.7 -4.5 -2.7 6.7 4.9 6.2 High ROE, yoy chg 2.9 -0.1 1.0 2.2 6.1 -1.5 0.9 2.0 Low Price/Sales -7.5 -1.1 -9.1 -8.0 -5.7 2.3 2.5 3.6 Aver a ge 4.1 ### 1.9 4.7 6.4 0.2 1.5 2.2 Low P/FCF 2.1 0.3 -1.1 1.1 3.8 5.1 5.9 7.2 Growth Low EV/EBIT 6.4 0.4 6.3 6.6 5.4 3.3 4.3 6.1 High 3yr Sales Gth -0.3 -0.4 3.9 3.5 -2.2 -3.5 -0.3 -0.6 Low EV/EBITDA 6.9 0.5 4.6 5.6 5.9 6.0 6.0 5.2 High 5yr Sales Gth 1.6 1.1 5.2 4.7 0.9 -2.0 -0.4 0.1 Low EV/Cap Emp 0.7 1.0 1.5 -0.7 0.8 6.2 4.1 5.5 High 3yr EPS Gth -2.7 -0.5 -2.1 0.1 -4.0 -2.6 0.3 1.2 Low EV/Sales 4.7 0.0 0.8 3.4 3.9 5.5 3.5 4.1 High 5yr EPS Gth -3.3 -0.4 -0.4 -1.1 -4.1 -1.4 -0.1 0.6 Low EV/Op CF 4.4 0.6 4.2 4.0 4.5 7.4 6.4 7.0 High LT Gth Est 1.8 -0.8 -0.4 1.0 1.1 0.3 1.0 0.2 Low EV/FCF 4.6 -0.4 3.5 3.7 5.0 4.5 5.1 6.2 High FY1 Gth Est -0.2 -0.2 -1.8 0.9 0.4 -3.6 -0.2 0.0 High Dividend Yield -0.9 0.2 -1.3 -2.4 -1.0 6.2 6.5 7.7 High FY2 Gth Est -5.6 0.1 -7.3 -6.9 -5.2 -0.8 1.4 0.6 Aver a ge 1.2 0.2 0.4 0.3 1.7 4.5 4.8 6.0 Aver a ge -1.2 ### -0.4 0.3 -1.9 -2.0 0.2 0.3 Price Momentum Stability High 6m Price Mom 5.1 -0.6 2.9 6.9 1.9 -6.0 -1.8 -1.2 Low EPS Vola 1.2 0.1 3.0 4.2 0.6 0.8 -0.4 -0.9 High 9m Price Mom 7.0 0.5 5.1 9.3 4.0 -5.8 -1.8 -0.8 Low Op Inc Vola 4.8 1.0 5.5 6.8 4.7 2.7 -0.4 0.8 High 12m Price Mom 8.1 0.3 6.2 10.8 6.6 -4.4 0.0 -0.1 Low Book Value Vola 3.8 0.9 3.6 3.3 2.7 3.7 0.3 -0.1 High Price Rel Strg 6.8 0.4 4.7 9.2 4.3 -6.0 -0.9 0.4 Low Sales Vola -2.1 -0.3 -1.2 -0.1 -3.9 0.4 -1.6 -0.6 High 3m chg in Price Mom 7.1 0.0 3.4 6.4 4.1 -1.2 0.8 1.0 Low EPS Est Vola 7.3 0.8 6.3 9.3 4.9 1.0 -0.5 0.5 High Price Up/Dn Days -1.3 -0.9 -0.1 0.3 -2.4 -3.4 -1.1 -0.9 Aver a ge 3.0 0.5 3.4 4.7 1.8 1.7 -0.5 -0.1 Aver a ge 5.5 -0.1 3.7 7.2 3.1 -4.5 -0.8 -0.2 Risk Earnings Momentum Low FY1 EPS Disp 1.9 0.9 3.7 4.4 -0.1 -0.3 -0.9 -0.2 High FY1 EPS Mom 1.1 0.5 0.4 1.0 0.0 -4.6 -0.7 1.8 Low FY2 EPS Disp -0.9 0.2 2.8 2.1 -3.4 -2.9 -2.9 -0.7 High FY2 EPS Mom -4.6 -0.9 -5.7 -4.3 -6.5 -5.4 -0.4 -0.1 High EBIT/Int Exp 6.9 0.6 6.8 8.1 5.7 1.5 -0.6 0.5 High 12m Fd EPS Mom 1.1 0.3 0.3 1.3 0.5 -3.5 0.4 2.2 Low Debt/Equity 5.7 0.6 7.6 7.4 4.0 2.7 -0.7 1.5 High FY1 EPS Rev 4.2 -0.3 3.9 6.1 1.6 -3.9 0.7 3.5 High Altman Z Score 7.9 0.4 8.0 9.4 5.6 0.3 -1.0 -1.0 High FY2 EPS Rev 4.4 1.2 2.6 6.6 1.0 -3.8 2.5 2.6 High Market Cap 3.6 0.2 2.5 2.5 5.4 -2.5 -1.7 -2.2 Aver a ge 1.2 0.2 0.3 2.1 -0.7 -4.2 0.5 2.0 Aver a ge 4.2 0.5 5.2 5.7 2.9 -0.2 -1.3 -0.4 Capex Deployment & Earnings Accruals Consensus Ratings Low Capex/Depr 7.6 1.6 2.5 4.8 8.2 4.6 3.7 2.8 High Analyst Rec 5.3 0.1 3.5 5.9 4.2 -3.7 -1.8 0.3 Low Capex/Sales 7.2 -0.9 3.3 5.7 7.1 2.8 1.8 1.8 High Analyst Rec 1m chg 0.2 -0.1 -0.9 -0.3 0.7 -0.7 0.1 2.3 Low Capex/FA -3.3 -0.1 -3.1 -3.6 -2.8 0.5 0.7 0.9 Aver a ge 2.7 0.0 1.3 2.8 2.4 -2.2 -0.8 1.3 High Receivables yoy chg 8.4 0.4 3.7 7.7 10.5 3.5 3.5 2.7 Low Inventory yoy chg 2.3 0.5 2.5 2.8 2.1 0.1 -0.3 -1.3 Low Payables yoy chg 1.0 -0.5 0.8 1.7 0.9 0.4 -0.9 -0.9 Aver a ge 3.9 0.2 1.6 3.2 4.3 2.0 1.4 1.0 Source: Deutsche Bank, FactSet, I/B/E/S. Note: *1m, 3m, 6m, 12m, 5yr, 10yr and 15yr returns are as of month ended September 2012. **Quintile baskets are formed on a regional sector relative basis. Relative performance is based on equal weighted average returns of the best quintile basket and the market. For description on factors please see appendix A. Deutsche Bank AG/Hong Kong Page 39
  • 40.
    17 October 2012 TheInvestigator Japan – market intelligence Figure 105: Equity market performance 1800 250 1200 50 MSCI Japan LC Index (LS) MSCI Japan LC Index (LS) 1600 1100 Rel to World (RS) Rel to World (RS) 45 1400 200 1000 1200 40 150 900 1000 800 35 800 100 700 600 30 400 600 50 25 200 500 0 0 400 20 1/73 1/78 1/83 1/88 1/93 1/98 1/00 1/02 1/04 1/06 1/08 1/10 1/12 Source: Deutsche Bank, Bloomberg Finance LP, DataStream. Figure 106: Market intelligence by sector 11Oct12 Mcap LC Perf P/E (x) P/B (x) Div Yld (%) EPSg (%) ROE (%) Sector (#Co) U$m 1m YTD CY11 CY12 CY13 CY11 CY12 CY13 CY11 CY12 CY13 CY11 CY12 CY13 CY11 CY12 CY13 Energy (7) 33,124 6.8 -7.9 7.2 9.8 9.2 0.7 0.6 0.6 2.9 2.9 2.9 39.1 -40.4 14.1 10.8 6.2 6.8 Materials (36) 126,581 -2.7 -14.3 14.1 14.6 10.2 0.8 0.8 0.8 2.7 2.7 2.9 -11.2 -4.6 50.9 5.1 5.1 7.0 Capital Goods (46) 280,126 -3.3 -6.7 9.1 11.1 9.2 1.0 0.9 0.8 3.0 3.2 3.3 20.7 7.0 8.6 10.7 10.7 10.7 Comm Svc (3) 16,960 -4.4 -9.8 33.6 19.2 13.5 0.8 1.3 0.8 3.5 3.6 3.7 -54.5 74.4 42.5 2.0 3.4 4.7 Transportation (19) 92,059 -0.2 0.3 22.6 17.7 13.7 1.1 1.1 1.0 1.8 1.8 2.0 -31.8 60.3 33.7 3.4 5.3 6.8 Autos (22) 251,250 -8.2 3.5 15.8 10.3 8.2 0.9 0.9 0.8 1.9 2.5 3.0 nm 69.7 30.6 5.8 8.4 9.8 Cons Durables (14) 64,251 -6.8 -19.3 16.3 12.9 11.7 0.7 0.7 0.7 2.4 2.4 2.5 na na na 6.3 2.6 6.2 Cons Svc (3) 11,560 -1.1 13.9 24.9 19.2 16.6 2.1 1.9 1.8 1.5 1.5 1.6 14.9 29.6 15.9 8.3 10.0 10.7 Media (4) 9,546 -4.0 -11.4 17.8 15.2 13.9 1.0 0.9 0.9 1.8 2.0 2.2 11.8 17.0 9.6 5.5 6.1 6.3 Retailing (12) 41,943 -4.6 -2.4 15.6 13.4 12.9 1.4 1.3 1.2 1.4 1.6 1.6 34.9 15.9 3.9 9.1 9.5 9.1 Food/Staples Retail (4) 35,562 -2.5 2.6 15.1 13.1 11.7 1.1 1.1 1.0 2.7 2.9 3.1 20.6 15.2 12.3 7.5 8.0 8.5 Food Beverage (13) 76,356 1.6 16.5 20.5 15.7 14.2 1.4 1.4 1.3 1.9 2.2 2.5 28.7 30.6 10.6 7.1 8.7 9.1 Household Products (3) 25,719 -5.8 -1.4 28.0 23.1 19.9 2.1 2.1 2.0 2.6 2.6 2.6 -14.2 20.8 16.5 7.6 8.9 9.9 Health Care Equip/Svc (7) 22,012 -3.3 13.3 58.8 23.4 16.2 1.5 1.5 1.4 1.4 1.3 1.5 -60.8 151.7 44.1 5.5 7.1 8.6 Pharma & Biotech (15) 122,063 -2.2 5.8 19.0 17.2 15.5 1.4 1.3 1.3 3.8 3.9 4.0 -23.2 10.7 10.4 7.3 7.8 8.2 Banks (21) 193,115 -2.6 6.9 6.8 7.1 7.7 0.6 0.6 0.5 3.6 3.6 3.7 25.8 -7.5 -8.2 9.3 8.1 7.1 Div Financials (7) 36,324 -1.1 17.7 31.3 14.9 10.4 0.6 0.6 0.6 1.9 1.9 2.1 -21.4 110.7 42.7 1.9 3.8 5.4 Insurance (6) 52,325 0.5 8.7 374.0 26.6 14.4 0.8 0.8 0.7 3.0 3.1 3.1 nm na 84.5 -1.7 2.9 5.2 Real Estate (15) 92,102 5.3 32.2 22.3 20.2 18.1 1.5 1.4 1.4 1.4 1.5 1.6 -12.8 47.3 11.7 6.7 7.1 7.5 Software (13) 41,854 4.5 -3.9 24.1 19.3 14.4 1.5 1.4 1.3 2.0 1.8 2.2 -41.0 24.4 34.1 6.3 7.4 9.3 Tech Hard/Equip (25) 169,808 -4.4 -14.3 12.2 12.6 10.3 1.0 0.9 0.9 2.9 3.0 3.2 -1.8 8.0 22.7 6.7 6.9 8.1 Semis (4) 12,854 -7.2 -15.4 27.8 43.7 18.5 0.8 0.8 0.8 2.4 1.9 2.1 nm na 136.6 2.7 1.8 4.1 Telecom (4) 77,770 -5.1 3.4 10.8 9.3 8.6 1.1 1.1 1.0 2.8 3.1 3.4 16.6 15.6 8.6 10.6 11.3 11.2 Utilities (13) 58,998 8.4 -22.5 43.4 14.6 12.9 0.7 0.7 0.7 4.0 2.8 2.4 na na na -0.9 2.1 7.5 Japan (316) 1,944,263 -2.6 -1.8 13.2 12.2 10.4 0.9 0.9 0.8 2.6 2.8 3.0 -15.9 33.7 29.6 6.8 7.4 8.2 Source: Deutsche Bank, I/B/E/S, MSCI. Note: Data in the table are compiled based on MSCI country index universe. P/E, P/B, dividend yield, EPS growth and ROE are aggregated using I/B/E/S consensus estimates (calendarized to December year end) with current prices. All numbers are free-float adjusted. Figure 107: Market Expected Return Indicator for Japan 10 Market Expected Return Indicator, LS 1,300 Japan Bullish MSCI JAPAN, RS 1,100 5 900 0 700 -5 500 -10 300 Bearish -15 100 1/93 1/94 1/95 1/96 1/97 1/98 1/99 1/00 1/01 1/02 1/03 1/04 1/05 1/06 1/07 1/08 1/09 1/10 1/11 1/12 Source: Deutsche Bank, MSCI, Bloomberg Finance LP Page 40 Deutsche Bank AG/Hong Kong
  • 41.
    17 October 2012 TheInvestigator Companies Mentioned Figure 108: Companies Mentioned DB  Bloomberg  Price        DB  Bloomberg  Price        S.No Country Company Rating Ticker (15 Oct) S.No Country Company Rating Ticker (15 Oct) 1 CN Belle Int'l Holding Buy 1880 HK 13.5 54 CN Dongfeng Motor Buy 489 HK 9.9 2 CN China Comm Services Buy 552 HK 4.5 55 HK Hang Lung Properties Buy 101 HK 26.2 3 CN China Comms Construct Buy 1800 HK 7.0 56 TW Delta Electronics Buy 2308 TT 101.0 4 CN Haitong Securities Buy 6837 HK 10.6 57 CN Franshion Buy 817 HK 2.4 5 CN China Mobile Hold 941 HK 84.1 58 MY Genting Bhd Hold GENT MK 8.8 6 CN CNOOC Ltd Hold 883 HK 15.8 59 TH Kasikornbank Buy KBANK TB 176.5 7 CN Guangdong Investment Buy 270 HK 6.1 60 KR Nexen Tire Hold 002350 KS 18800.0 8 CN ICBC Buy 1398 HK 4.9 61 TW Orise Technology Buy 3545 TT 34.9 9 CN SouFun Buy SFUN US 17.9 62 CN Shanghai Electric Buy 2727 HK 3.0 10 CN Db X-Trackers Csi300 Trn Index Et NA 3049 HK NA 63 MY DiGi.Com NA DIGI MK NA 11 HK SJM Buy 880 HK 16.4 64 IN Bank of Baroda Buy BOB IN 779.8 12 HK BOC Hong Kong Holdings Buy 2388 HK 24.1 65 CN China CITIC Hold 998 HK 4.1 13 HK Giordano Hold 709 HK 6.3 66 IN Asian Paints Hold APNT IN 3865.8 14 HK SHK Properties Ltd Buy 16 HK 109.0 67 KR Hyundai Heavy Buy 009540 KS 236000.0 15 ID Indocement Buy INTP IJ 21150.0 68 KR Korean Reinsurance NA 003690 KS 11750.0 16 ID Ace Hardware Indonesia Buy ACES IJ 6600.0 69 CN Sinopec-H Buy 386 HK 7.9 17 IN ICICI Bank Buy ICICIBC IN 1053.1 70 HK Cathay Pacific Sell 293 HK 13.4 18 IN Oil India Limited Buy OINL IN 489.3 71 CN Maanshan-H Sell 323 HK 1.9 19 IN ONGC Buy ONGC IN 279.9 72 TW Siliconware Precision Hold 2325 TT 31.6 20 IN IDFC Buy IDFC IN 150.6 73 KR DSME Hold 042660 KS 23900.0 21 IN Shree Cement Buy SRCM IN 4080.2 74 KR OCI Company NA 010060 KS 159500.0 22 IN Grasim Buy GRASIM IN 3422.1 75 ID BRI Buy BBRI IJ 7650.0 23 KR Korea Zinc Buy 010130 KS 445000.0 76 KR Samsung Eng. Hold 028050 KS 163500.0 24 KR Dongbu Insurance Co. Ltd. NR 005830 KS 51300.0 77 TH Siam Cement Buy SCC TB 349.0 25 KR SEC Buy 005930 KS 1300000.0 78 CN KWG Property Buy 1813 HK 4.2 26 KR SK Innovation Buy 096770 KS 151000.0 79 CN SOHO China Buy 410 HK 5.1 27 KR LG Chem Buy 051910 KS 314000.0 80 KR Hyundai Dept Store Buy 069960 KS 148500.0 28 MY Top Glove Buy TOPG MK 5.3 81 HK SJM Buy 880 HK 16.4 29 MY Telekom Malaysia Hold T MK 6.3 82 TW Taiwan Cement Hold 1101 TT 36.2 30 PH Megaworld Buy MEG PM 2.4 83 TW Powertech Technology Sell 6239 TT 51.0 31 SG Keppel Land Buy KPLD SP 3.5 84 KR Amorepacific Corp. Hold 090430 KS 1249000.0 32 SG Sembcorp Industries Ltd Buy SCI SP 5.5 85 MY Hong Leong Bank Bhd. Hold HLBK MK 14.0 33 SG Sembcorp Marine Buy SMM SP 4.9 86 KR Industrial Bank of Korea Hold 024110 KS 11700.0 34 TH BEC World PLC Hold BEC TB 57.3 87 KR KT&G Corp. Hold 033780 KS 91200.0 35 TH Minor International PLC Buy MINT TB 18.2 88 PH Aboitiz Power Corp. Hold AP PM 33.4 36 TH Sino-Thai Engineering Buy STEC TB 21.2 89 TH Krung Thai Bank Public Co., Ltd Buy KTB TB 18.2 37 TH PTT PCL Hold PTT TB 313.0 90 ID PT Charoen Pokphand Indones Buy CPIN IJ 3100.0 38 TW Uni-President Buy 1216 TT 51.8 91 ID PT Perusahaan Gas Negara (P Buy PGAS IJ 4325.0 39 TW Far EasTone Telecom Buy 4904 TT 72.8 92 SG Yangzijiang Shipbuilding (Holdin Hold YZJ SP 0.9 40 TW Novatek Microelectronics Buy 3034 TT 104.0 93 TW Formosa Chemicals & Fibre Hold 1326 TT 75.3 41 CN Agri. Bank of China Hold 1288 HK 3.2 94 CN China Construction Bank-H Hold 939 HK 5.8 42 CN Anta Sports Hold 2020 HK 6.6 95 HK Wharf Holdings ltd Hold 4 HK 51.4 43 SG Fraser & Neave Buy FNN SP 8.9 96 IN Wipro Ltd Buy WPRO IN 353.0 44 CN China Shineway Hold 2877 HK 10.8 97 ID United Tractors Tbk Pt Buy UNTR IJ 19700.0 45 TW Chunghwa Tel Hold 2412 TT 92.1 98 MY Public Bank Hold PBKF MK 14.5 46 TW Far EasTone Telecom Buy 4904 TT 72.8 99 TW Mstar Semiconductor Inc Buy 3697 TT 240.0 47 PH First Philippine Hldgs Buy FPH PM 80.0 100 CN Bank of China Ltd-H Buy 3988 HK 3.1 48 KR LIG Insurance NA 002550 KS 26150.0 101 KR Hyundai Marine & Fire Ins Co NA 001450 KS 36200.0 49 ID Perusahaan Gas Negara Buy PGAS IJ 4325.0 102 KR HYUNDAI MOTOR CO Buy 005380 KS 225500.0 50 MY PLUS Expressways NA PLUS MK NA 103 KR HYUNDAI MOBIS Buy 012330 KS 297000.0 51 SG SATS NA SATS SP NA 104 TW SIMPLO TECHNOLOGY CO LT Buy 6121 TT 178.0 52 MY Top Glove Buy TOPG MK 5.3 105 SG STARHUB LTD Hold STH SP 3.7 53 HK Wynn Macau Buy 1128 HK 20.4 106 Deutsche Bank AG/Hong Kong Page 41
  • 42.
    17 October 2012 TheInvestigator Appendix A In the stock ranking model, optimized weights based on back-tests are given to various factors (see Figure 109) to form an aggregate score for each stock. Scores are given on a sector- and country-relative basis, and the weight matrix used in each industry group varies depending on back-test results. Figure 109: Definition of factors V a lua t ion Fa c t or s 12m Fd P/E: price to 12-month forward EPS Trailing P/E: price to 12m trailing EPS Dividend Yield: 12m trailing dividend yield P/Op Inc: Price to operating income P/BV: Price to book value Price/Sales: Price to sales P/FCF: Price to free cash flow EV/EBIT: Enterprise value to EBIT EV/EBITDA: Enterprise value to EBITDA EV/Cap Emp: Enterprise value to capital employed EV/Sales: Enterprise value to sales EV/Op CF: Enterprise value to operating cash flow EV/FCF: Enterprise value to free cash flow P r ic e Mom ent um Fa c t or s 6m Price Mom: 6-month price momentum 9m Price Mom: 9-month price momentum 12m Price Mom: 12-month price momentum Price Rel Strength: 65-day to 260-day moving average in stock price Price Mom, 3mΔ: 3-month change in 12-month price momentum Price ↑ / ↓ Days: Number of up less down days in stock price in 130 days E a r nings Mom ent um Fa c t or s FY1 EPS Mom: Weighted average on 1-, 2- and 3-month change in FY1 eps mean estimate FY2 EPS Mom: Weighted average on 1-, 2- and 3-month change in FY2 eps mean estimate 12m Fd EPS Mom: Weighted average on 1-, 2- and 3-month change in 12-month forward eps mean estimate FY1 EPS Rev: % of upward less downward revisions in FY1 eps estimates in 3 months FY2 EPS Rev: % of upward less downward revisions in FY2 eps estimates in 3 months E a r nings Q ua lit y (E a r nings Ac c r ua ls a nd Ca pex Deploy m ent Fa c t or s ) Capex/Depr: Capital expenditure to depreciation expense Capex/Sales: Capital expenditure to sales Capex/FA: Capital expenditure to fixed assets Receivables/Ttl Assets, YoYΔ: YoY change in account receivables to total assets ratio Inventory/Ttl Assets, YoYΔ: YoY change in inventory to total assets ratio Payables/Ttl Assets, YoYΔ: YoY change in account payable to total assets ratio P r of it a bilit y Fa c t or s Rtn of Capital Employed: Cash return on capital employed Rtn of Capital Employed, YoYΔ: YoY change in cash return on capital employed ROE: Return on equity ROE, YoYΔ: YoY change in return on equity Gr owt h Fa c t or s 3yr Sales Gth: 3-year growth in sales (actual) 5yr Sales Gth: 5-year growth in sales (actual) 3yr EPS Gth: 3-year growth in eps (actual) 5yr EPS Gth: 5-year growth in eps (actual) LT Gth Est: Consensus estimate on long term eps growth FY1 Gth Est: Consensus estimate on FY1 eps growth FY2 Gth Est: Consensus estimate on FY2 eps growth S t a bilit y Fa c t or s EPS Vola: 3-year volatility in trailing eps Op Inc Vola: 3-year volatility in trailing operating income per share Book Value Vola: 3-year volatility in historical book value per share Sales Vola: 3-year volatility in trailing sales per share EPS Est Vola: 3-year volatility in 12-month forward eps estimate Ris k Fa c t or s FY1 EPS Dispersion: Dispersion of FY1 eps estimates FY2 EPS Dispersion: Dispersion of all the FY2 eps estimates EBIT/Int Exp: EBIT to interest expense Debt/Equity: Debt to equity Altman Z Score: (1.2 x working capital + 1.4 x retained earnings + 3.3 x EBIT + sales) / total assets + 0.6 x market value of equity / total liabilities Market Cap: Company market capitalisation Cons ens us Ra t ing Fa c t or s Analyst Rating: Consensus rating Analyst Rating, 1mΔ: 1-month change on consensus rating Source: Deutsche Bank Page 42 Deutsche Bank AG/Hong Kong
  • 43.
    17 October 2012 TheInvestigator Figure 110: Bottom-up sector ranking (Rank 1 = Best) 12 month Forward EPS FY1 EPS Revisions FY2 EPS Revisions Earnings Revisions Mkt Cap (U$ mn) 12m fwd P/E expectation Profitability Technicals Valuation ROE (%) EV/EBIT P/B RSI Rank Country Sector 1 Philippines Utilities 3,637 2.9 11.6 11.7 1.00 1.00 22.5 1.10 22% O ++ ++ ++ 2 Japan Banks 193,115 0.5 9.5 0.23 -0.15 4.5 0.98 -2% ++ + -- - 3 Thailand Telecommunication Services 5,930 4.9 16.6 18.6 0.89 0.51 21.4 1.22 15% -- ++ ++ ++ 4 Indonesia Utilities 4,952 6.5 13.8 12.0 0.75 0.43 48.5 1.09 12% - ++ ++ ++ 5 Japan Telecommunication Services 77,770 1.0 8.7 7.5 0.18 0.19 9.9 1.03 12% ++ ++ - O 6 Thailand Banks 32,450 1.7 10.6 0.65 0.50 12.4 1.11 18% O ++ O ++ 7 Philippines Banks 3,961 1.7 11.9 0.60 0.67 14.8 1.11 10% O ++ + ++ 8 Indonesia Banks 31,482 2.0 9.7 0.65 0.50 18.8 1.01 14% + ++ + O 9 Indonesia Household & Personal Products 4,133 52.7 37.2 33.0 0.43 0.71 122.3 1.22 16% -- ++ ++ ++ 10 Thailand Food & Staples Retailing 5,559 12.2 25.5 22.4 0.63 0.83 38.7 1.13 23% -- ++ ++ ++ 11 India Software & Services 37,853 3.2 12.7 11.0 0.58 0.63 21.7 1.10 15% - ++ ++ ++ 12 China Utilities 17,175 1.2 9.5 18.1 0.50 0.64 5.6 1.10 27% + ++ - - ++ 13 China Real Estate 34,144 0.9 5.7 5.9 0.00 -0.17 14.4 1.06 13% ++ + + + 14 Indonesia Pharmaceuticals & Biotechnology 467 5.3 18.7 16.2 0.71 0.71 24.5 1.08 20% -- ++ ++ ++ 15 Hong Kong Real Estate 112,266 0.6 12.6 7.2 0.33 0.20 8.8 1.06 3% ++ ++ - + 16 Philippines Diversified Financials 1,773 2.1 15.7 0.83 0.80 9.1 1.10 20% -- ++ - ++ 17 Japan Retailing 41,943 0.9 11.1 6.5 0.17 0.06 10.2 1.00 9% ++ ++ O O 18 Malaysia Utilities 13,877 1.3 12.7 12.5 0.35 0.43 9.9 1.10 5% O ++ O ++ 19 China Banks 153,529 1.0 5.5 -0.25 -0.52 21.3 0.92 1% ++ O ++ - - 20 Japan Media 9,546 0.8 12.6 5.6 0.00 0.20 6.2 0.98 10% ++ ++ -- - 21 Japan Food & Staples Retailing 35,562 1.3 11.4 6.5 0.05 -0.08 10.6 1.09 12% ++ + O ++ 22 India Banks 60,156 0.8 5.2 -0.37 -0.35 18.3 0.97 16% ++ O + - 23 Japan Health Care Equipment & Services 22,012 0.9 13.2 7.1 -0.20 0.27 6.6 1.11 17% ++ + - ++ 24 Korea Insurance 17,335 1.4 6.5 -0.22 -0.09 15.1 0.99 14% ++ + + - 25 Korea Banks 43,648 0.6 5.8 -0.67 -0.71 12.8 0.96 0% ++ - O - 26 Japan Pharmaceuticals & Biotechnology 122,063 1.5 14.7 9.5 0.50 0.14 8.7 1.06 8% O ++ - + 27 Singapore Real Estate 29,308 0.9 15.9 13.6 0.49 0.20 10.2 1.12 4% - ++ O ++ 28 Japan Diversified Financials 36,324 0.7 11.1 -0.17 0.42 3.8 1.01 19% ++ ++ -- O 29 Japan Commercial Services & Supplies 16,960 0.9 13.7 7.1 0.00 0.00 5.3 1.04 17% ++ + -- + 30 Malaysia Banks 33,575 1.9 12.2 0.32 0.00 16.5 1.05 10% + ++ + + 31 Singapore Retailing 4,270 3.2 11.6 8.8 0.14 0.11 24.8 1.09 16% O ++ ++ ++ 32 Korea Automobiles & Components 76,862 1.2 6.4 6.6 -0.20 -0.20 16.5 0.98 17% ++ O + - 33 Singapore Banks 60,279 1.4 11.4 0.24 -0.17 11.3 1.07 5% + + O + 34 Philippines Real Estate 5,457 1.6 10.7 16.4 0.67 0.10 8.6 1.09 15% - ++ - ++ 35 Japan Software & Services 41,854 1.2 11.4 7.0 0.00 0.17 8.9 1.01 18% ++ + - O 36 Hong Kong Banks 29,986 1.1 12.0 0.45 -0.17 9.2 1.00 4% + ++ - O Source: Deutsche Bank, EPS momentum is the number of upward less downward revisions in respective financial year EPS estimate in last 3 months. RSI is the ratio of 65-day to 260-day moving average in stock price. All the metrics shown above except market cap are median data for the sector. ++ Very favorable, + Favorable, O Neutral, - Unfavorable, Very unfavorable Deutsche Bank AG/Hong Kong Page 43
  • 44.
    17 October 2012 TheInvestigator Figure 110: Bottom-up sector ranking (Rank 1 = Best), continued 12 month Forward EPS FY1 EPS Revisions FY2 EPS Revisions Earnings Revisions Mkt Cap (U$ mn) 12m fwd P/E expectation Profitability Technicals Valuation ROE (%) EV/EBIT P/B RSI Rank Country Sector 37 Korea Hotels Restaurants & Leisure 2,095 2.8 12.9 12.0 0.55 0.00 17.6 1.13 27% - ++ + ++ 38 Malaysia Automobiles & Components 1,718 1.1 10.5 7.9 0.00 0.00 14.9 1.06 18% + + + + 39 India Household & Personal Products 11,909 11.6 27.0 29.1 0.35 0.34 35.0 1.14 19% -- ++ ++ ++ 40 India Energy 30,512 1.4 8.6 10.2 -0.08 0.00 12.2 1.01 12% + + O O 41 Taiwan Consumer Durables & Apparel 5,653 2.3 13.8 15.3 0.17 0.33 14.0 1.05 12% - ++ O + 42 India Diversified Financials 11,120 1.7 10.9 -0.14 0.00 18.6 1.07 18% + + + + 43 Japan Automobiles & Components 251,250 0.9 7.5 5.8 -0.48 -0.44 8.2 0.94 25% ++ O - -- 44 Korea Utilities 7,708 0.3 17.5 11.0 -0.60 -0.14 2.8 1.05 11% ++ O -- + 45 Japan Consumer Durables & Apparel 64,251 0.7 11.0 9.8 -0.33 0.02 4.3 0.97 15% ++ + -- - 46 Taiwan Banks 34,373 1.0 11.3 -0.16 -0.07 8.2 1.03 7% + + - O 47 Philippines Food & Staples Retailing 0 2.0 12.3 9.9 0.00 0.00 12.7 1.06 11% O + O + 48 Japan Transportation 92,059 0.9 11.5 18.1 -0.12 -0.07 5.7 1.00 14% ++ + -- O 49 Malaysia Diversified Financials 3,438 1.1 12.2 0.08 -0.07 8.9 0.97 9% + + - - 50 Malaysia Telecommunication Services 18,375 2.9 22.2 18.1 0.16 0.00 20.8 1.14 12% -- + ++ ++ 51 Korea Energy 15,613 1.0 7.6 10.9 -0.64 -0.17 12.4 1.02 15% ++ O O O 52 Korea Technology Hardware & Equipment 15,766 1.4 10.0 13.0 0.05 -0.12 10.8 1.04 25% O + O + 53 Indonesia Food Beverage & Tobacco 8,432 2.7 12.8 13.0 -0.41 0.33 21.7 1.04 16% - + ++ + 54 Japan Food Beverage & Tobacco 76,356 1.0 14.5 12.7 -0.20 -0.33 5.2 1.01 13% + O -- O 55 India Pharmaceuticals & Biotechnology 13,343 4.7 18.2 19.4 0.00 0.11 20.4 1.06 18% -- + ++ + 56 Indonesia Telecommunication Services 12,307 1.8 18.1 27.1 -0.06 0.24 0.1 1.03 15% - ++ -- O 57 China Software & Services 33,658 2.3 11.0 7.3 -0.33 -0.13 18.7 0.97 17% O O + - 58 Indonesia Automobiles & Components 16,899 2.1 13.8 13.8 -0.08 0.00 21.2 0.96 15% - + ++ - 59 Taiwan Insurance 10,968 1.3 13.3 -0.69 0.00 7.0 1.00 11% + O - O 60 Japan Real Estate 92,102 1.0 12.5 -0.13 -0.50 5.0 1.06 10% + O -- + 61 Malaysia Hotels Restaurants & Leisure 10,261 1.6 13.0 9.2 -0.41 -0.10 11.3 1.02 10% O O O O 62 India Materials 21,862 2.2 9.3 10.9 -0.27 -0.29 14.2 1.01 14% O O + O 63 Japan Capital Goods 280,126 0.8 10.8 8.8 -0.55 -0.50 6.3 0.96 15% ++ - -- - 64 China Telecommunication Services 83,466 1.3 12.9 6.3 -0.48 -0.53 12.8 1.05 17% ++ - O + 65 Taiwan Telecommunication Services 22,664 3.6 18.8 18.3 -0.23 0.00 14.9 1.10 13% -- + + ++ 66 Malaysia Capital Goods 14,418 1.3 12.6 11.8 -0.23 -0.23 11.8 1.01 17% O O O O 67 Korea Food Beverage & Tobacco 15,228 1.3 10.8 12.6 -0.65 -0.10 9.3 1.07 15% + O - + 68 Japan Insurance 52,325 1.2 13.2 -0.08 -0.41 2.5 1.00 25% + O -- O 69 India Utilities 11,075 1.8 11.1 12.0 -0.36 -0.14 11.7 0.97 8% O O O - 70 Hong Kong Technology Hardware & Equipment 860 1.2 10.6 13.1 0.00 -0.20 6.0 0.86 21% + + -- -- 71 Singapore Capital Goods 38,292 1.2 11.8 12.3 -0.66 0.00 9.0 1.07 18% O O - + 72 Japan Energy 33,124 0.7 13.0 16.0 -0.56 -0.33 1.9 0.89 -6% ++ O -- -- Source: Deutsche Bank, EPS momentum is the number of upward less downward revisions in respective financial year EPS estimate in last 3 months. RSI is the ratio of 65-day to 260-day moving average in stock price. All the metrics shown above except market cap are median data for the sector. ++ Very favorable, + Favorable, O Neutral, - Unfavorable, Very unfavorable Page 44 Deutsche Bank AG/Hong Kong
  • 45.
    17 October 2012 TheInvestigator Figure 110: Bottom-up sector ranking (Rank 1 = Best), continued 12 month Forward EPS FY1 EPS Revisions FY2 EPS Revisions Earnings Revisions Mkt Cap (U$ mn) 12m fwd P/E expectation Profitability Technicals Valuation ROE (%) EV/EBIT P/B RSI Rank Country Sector 73 India Food Beverage & Tobacco 13,829 3.6 21.2 17.8 -0.25 0.00 19.2 1.05 20% -- + ++ + 74 Taiwan Semiconductors & Semiconductor Equipment 111,700 1.5 14.0 18.3 -0.20 -0.05 8.5 0.98 19% - + - - 75 Thailand Media 1,820 3.2 18.1 19.7 -0.25 -0.10 12.5 1.10 17% -- O O ++ 76 Hong Kong Telecommunication Services 1,584 1.5 11.8 11.5 -0.86 -0.28 15.7 1.06 6% + - + + 77 Hong Kong Consumer Durables & Apparel 2,556 1.2 8.1 6.5 -0.50 -0.89 13.8 0.93 10% ++ - O -- 78 Korea Capital Goods 62,600 1.0 9.7 14.3 -0.33 -0.33 7.0 0.95 26% + O - - 79 Singapore Transportation 12,117 1.7 15.7 16.4 -0.30 -0.26 10.7 1.03 7% - O O O 80 Philippines Telecommunication Services 3,698 3.5 14.2 14.0 -0.26 -0.55 21.8 1.04 3% - O ++ + 81 Malaysia Food Beverage & Tobacco 15,148 2.1 14.3 13.9 -0.50 -0.07 16.8 1.05 13% - O + + 82 India Automobiles & Components 17,730 2.9 13.3 12.0 -0.50 -0.33 21.6 1.05 20% O O ++ + 83 Korea Materials 59,183 0.9 8.9 11.1 -0.49 -0.52 7.8 0.90 16% ++ - - -- 84 Singapore Diversified Financials 4,742 1.9 15.5 -0.20 -0.39 7.3 1.04 6% - O - + 85 Japan Materials 126,581 0.7 9.5 10.6 -0.73 -0.58 5.0 0.89 17% ++ - -- -- 86 Japan Household & Personal Products 25,719 1.4 15.6 8.8 -0.71 -0.17 8.6 1.00 17% + O - O 87 Philippines Capital Goods 10,086 3.1 12.0 14.2 -0.50 -0.47 21.3 1.12 14% - - ++ ++ 88 Singapore Media 5,319 3.1 16.3 15.5 -0.43 -0.20 17.2 1.04 2% - O + + 89 Taiwan Diversified Financials 10,772 0.9 17.2 0.01 -0.56 3.2 0.98 -1% - O -- - 90 Malaysia Transportation 3,823 1.7 17.1 14.9 -0.32 -0.20 11.8 0.97 4% - O O - 91 Korea Transportation 5,194 1.3 18.1 #### 0.00 0.14 -15.9 1.02 21% -- + -- O 92 Malaysia Materials 7,080 1.4 9.6 14.4 -0.60 -0.33 10.9 1.00 15% O O O O 93 China Health Care Equipment & Services 5,936 4.4 26.5 10.4 -0.67 -0.50 51.3 1.11 26% -- - ++ ++ 94 Hong Kong Utilities 43,255 1.7 14.4 22.2 -0.06 -0.82 9.8 1.06 8% - O - + 95 Malaysia Energy 4,970 1.5 13.4 33.6 -0.17 -0.16 4.2 0.94 16% - + -- - 96 India Real Estate 2,388 0.9 13.0 16.0 -0.47 0.00 3.5 0.95 27% O O -- - 97 Hong Kong Hotels Restaurants & Leisure 25,672 1.0 14.1 14.8 -0.50 -0.45 14.9 1.02 15% O - + O 98 India Media 1,731 5.3 16.9 12.9 -0.33 -0.45 18.0 1.05 17% - O + + 99 Singapore Telecommunication Services 22,195 5.9 14.1 15.5 -0.67 -0.29 21.4 1.05 7% - - ++ + 100 Hong Kong Transportation 8,726 1.0 15.6 27.7 -0.04 -0.60 5.4 0.98 8% - O -- - 101 Japan Technology Hardware & Equipment 169,808 0.9 11.3 9.8 -0.65 -0.70 4.9 0.93 24% ++ - -- -- 102 China Energy 113,603 1.5 8.7 8.9 -0.67 -0.71 15.4 0.94 10% + - + -- 103 Taiwan Technology Hardware & Equipment 97,160 1.4 10.7 11.4 -0.50 -0.71 10.7 0.97 13% + - O - 104 Thailand Energy 19,189 1.6 8.8 15.2 -0.80 -0.54 8.2 0.99 13% + - - - 105 Hong Kong Diversified Financials 17,866 0.8 9.8 -0.66 -0.77 6.5 0.97 13% + - - - 106 Korea Pharmaceuticals & Biotechnology 3,823 2.4 20.1 78.4 -0.20 0.00 5.6 1.04 21% -- + -- + 107 Korea Consumer Durables & Apparel 8,108 1.5 9.6 12.1 -0.69 -0.69 11.2 0.97 19% + - O - 108 China Technology Hardware & Equipment 7,733 1.1 7.4 7.5 -0.83 -0.65 8.0 0.89 17% ++ - - -- Source: Deutsche Bank, EPS momentum is the number of upward less downward revisions in respective financial year EPS estimate in last 3 months. RSI is the ratio of 65-day to 260-day moving average in stock price. All the metrics shown above except market cap are median data for the sector. ++ Very favorable, + Favorable, O Neutral, - Unfavorable, Very unfavorable Deutsche Bank AG/Hong Kong Page 45
  • 46.
    17 October 2012 TheInvestigator Figure 110: Bottom-up sector ranking (Rank 1 = Best), continued 12 month Forward EPS FY1 EPS Revisions FY2 EPS Revisions Earnings Revisions Mkt Cap (U$ mn) 12m fwd P/E expectation Profitability Technicals Valuation ROE (%) EV/EBIT P/B RSI Rank Country Sector 109 Thailand Materials 9,958 1.4 10.3 11.1 -0.76 -0.63 13.0 1.01 15% + - O O 110 China Insurance 47,571 2.3 13.6 -0.71 -0.56 10.6 0.99 31% + - O - 111 Indonesia Capital Goods 3,416 3.2 15.6 9.1 -1.00 -0.50 19.1 1.01 10% O - ++ O 112 Korea Telecommunication Services 3,634 0.8 8.6 15.0 -1.00 -0.80 3.8 1.03 37% ++ -- -- O 113 Singapore Food & Staples Retailing 2,477 2.5 15.0 16.3 -1.00 -0.40 34.9 0.99 18% O - ++ - 114 Korea Retailing 6,249 1.2 8.4 8.1 -0.90 -0.70 10.2 0.94 16% ++ -- O -- 115 China Capital Goods 26,477 0.9 8.8 10.0 -0.75 -1.00 10.8 0.93 10% ++ -- O -- 116 Hong Kong Capital Goods 24,979 0.8 10.6 8.0 -1.00 -0.80 8.1 0.96 7% ++ -- - - 117 India Capital Goods 13,851 2.5 13.4 11.9 -0.60 -0.57 13.4 0.99 15% O - O - 118 Hong Kong Semiconductors & Semiconductor Equipment 2,285 2.0 7.8 6.9 -1.00 -1.00 28.0 0.93 21% ++ -- ++ - - 119 Taiwan Food & Staples Retailing 2,977 1.6 22.6 21.7 -0.40 -0.56 17.8 1.02 8% -- - + O 120 Korea Food & Staples Retailing 4,437 1.0 10.2 10.6 -0.60 -0.80 8.9 0.88 22% + - - -- 121 Japan Utilities 58,998 0.5 -15.1 53.9 0.07 -0.42 -0.4 0.76 30% O O -- -- 122 China Automobiles & Components 12,980 1.3 6.8 10.5 -0.83 -0.81 15.2 0.91 17% + -- + -- 123 Hong Kong Retailing 10,035 1.8 11.2 9.4 -0.64 -0.84 16.9 0.94 16% O - + -- 124 Indonesia Energy 6,341 2.4 9.2 10.0 -0.78 -0.94 20.2 0.84 -8% + -- ++ - - 125 China Transportation 13,464 0.8 9.1 10.0 -0.84 -0.94 8.7 0.91 8% ++ -- - -- 126 Japan Hotels Restaurants & Leisure 11,560 1.2 10.5 11.4 -1.00 -1.00 9.6 1.02 14% ++ -- - O 127 Korea Household & Personal Products 10,032 3.9 23.4 19.0 -0.75 -0.33 8.4 1.05 19% -- - - + 128 Indonesia Materials 8,406 3.2 13.1 14.4 -0.70 -0.50 10.4 1.00 12% - - O O 129 Thailand Food Beverage & Tobacco 3,381 2.6 12.6 17.2 -0.79 -1.00 16.7 1.17 14% - -- + ++ 130 Singapore Food Beverage & Tobacco 8,242 2.4 14.4 12.1 -0.95 -0.89 15.3 1.07 12% O -- + + 131 Taiwan Real Estate 2,399 1.3 10.9 33.2 -1.00 -0.57 11.8 1.04 4% - -- O + 132 Korea Diversified Financials 10,246 0.7 10.7 -0.68 -1.00 4.5 0.95 10% O -- -- - 133 Korea Semiconductors & Semiconductor Equipment 153,775 1.6 10.5 11.8 -0.94 -0.56 8.3 0.91 30% O - - -- 134 China Materials 29,268 0.9 7.7 11.7 -1.00 -1.00 8.9 0.87 16% ++ -- - -- 135 Taiwan Automobiles & Components 7,681 1.4 14.2 21.1 -0.67 -1.00 7.1 1.04 16% - -- - + 136 India Telecommunication Services 4,516 2.0 18.0 21.4 -0.60 -0.58 4.1 0.87 25% - - -- -- 137 Taiwan Capital Goods 9,400 1.5 12.6 11.1 -1.00 -1.00 10.3 0.97 10% O -- O - 138 China Food Beverage & Tobacco 22,286 1.5 14.2 17.6 -0.67 -0.88 9.3 0.97 21% - - - - 139 Taiwan Retailing 2,746 2.3 15.0 19.0 -1.00 -1.00 14.4 1.01 17% O -- + O 140 Taiwan Transportation 4,751 1.2 12.5 22.1 -0.33 -0.80 3.9 0.96 69% - - -- - 141 China Retailing 15,723 1.4 12.6 8.2 -0.92 -0.92 13.4 0.83 15% O -- O -- 142 Japan Semiconductors & Semiconductor Equipment 12,854 0.8 13.2 95.6 -0.43 -0.43 -2.2 0.83 82% O O -- -- 143 Taiwan Materials 50,916 1.4 14.2 16.2 -1.00 -1.00 7.1 1.00 19% O -- - - 144 Korea Software & Services 15,154 2.7 12.9 17.6 -0.93 -0.43 11.4 0.89 24% -- - O -- 145 Singapore Hotels Restaurants & Leisure 6,535 0.9 19.6 21.9 -0.87 -1.00 6.6 1.01 19% - -- - O 146 China Food & Staples Retailing 7,180 2.3 12.1 13.3 -1.00 -1.00 18.1 0.86 11% - -- + -- 147 China Household & Personal Products 6,925 2.4 39.2 (4.8) -1.00 -1.00 -22.3 0.88 31% -- -- -- -- Source: Deutsche Bank, EPS momentum is the number of upward less downward revisions in respective financial year EPS estimate in last 3 months. RSI is the ratio of 65-day to 260-day moving average in stock price. All the metrics shown above except market cap are median data for the sector. ++ Very favorable, + Favorable, O Neutral, - Unfavorable, Very unfavorable Page 46 Deutsche Bank AG/Hong Kong
  • 47.
    17 October 2012 TheInvestigator Appendix 1 Important Disclosures Additional information available upon request For disclosures pertaining to recommendations or estimates made on securities other than the primary subject of this research, please see the most recently published company report or visit our global disclosure look-up page on our website at http://gm.db.com/ger/disclosure/DisclosureDirectory.eqsr Analyst Certification The views expressed in this report accurately reflect the personal views of the undersigned lead analyst(s). In addition, the undersigned lead analyst(s) has not and will not receive any compensation for providing a specific recommendation or view in this report. Ajay Kapur/Ritesh Samadhiya Equity rating key Equity rating dispersion and banking relationships Buy: Based on a current 12- month view of total share- 450 holder return (TSR = percentage change in share price 400 56 % from current price to projected target price plus pro- 350 jected dividend yield ) , we recommend that investors 300 38 % 250 buy the stock. 200 Sell: Based on a current 12-month view of total share- 150 holder return, we recommend that investors sell the 100 11 % 16 % 5% 50 10 % stock 0 Hold: We take a neutral view on the stock 12-months Buy Hold Sell out and, based on this time horizon, do not recommend either a Buy or Sell. Companies Covered Cos. w/ Banking Relationship Notes: Asia-Pacific Universe 1. Newly issued research recommendations and target prices always supersede previously published research. 2. Ratings definitions prior to 27 January, 2007 were: Buy: Expected total return (including dividends) of 10% or more over a 12-month period Hold: Expected total return (including dividends) between -10% and 10% over a 12- month period Sell: Expected total return (including dividends) of -10% or worse over a 12-month period Deutsche Bank AG/Hong Kong Page47
  • 48.
    17 October 2012 TheInvestigator Regulatory Disclosures 1. Important Additional Conflict Disclosures Aside from within this report, important conflict disclosures can also be found at https://gm.db.com/equities under the "Disclosures Lookup" and "Legal" tabs. Investors are strongly encouraged to review this information before investing. 2. Short-Term Trade Ideas Deutsche Bank equity research analysts sometimes have shorter-term trade ideas (known as SOLAR ideas) that are consistent or inconsistent with Deutsche Bank's existing longer term ratings. These trade ideas can be found at the SOLAR link at http://gm.db.com. 3. Country-Specific Disclosures Australia and New Zealand: This research, and any access to it, is intended only for "wholesale clients" within the meaning of the Australian Corporations Act and New Zealand Financial Advisors Act respectively. Brazil: The views expressed above accurately reflect personal views of the authors about the subject company(ies) and its(their) securities, including in relation to Deutsche Bank. The compensation of the equity research analyst(s) is indirectly affected by revenues deriving from the business and financial transactions of Deutsche Bank. In cases where at least one Brazil based analyst (identified by a phone number starting with +55 country code) has taken part in the preparation of this research report, the Brazil based analyst whose name appears first assumes primary responsibility for its content from a Brazilian regulatory perspective and for its compliance with CVM Instruction # 483. EU countries: Disclosures relating to our obligations under MiFiD can be found at http://www.globalmarkets.db.com/riskdisclosures. Japan: Disclosures under the Financial Instruments and Exchange Law: Company name - Deutsche Securities Inc. Registration number - Registered as a financial instruments dealer by the Head of the Kanto Local Finance Bureau (Kinsho) No. 117. Member of associations: JSDA, Type II Financial Instruments Firms Association, The Financial Futures Association of Japan, Japan Investment Advisers Association. Commissions and risks involved in stock transactions - for stock transactions, we charge stock commissions and consumption tax by multiplying the transaction amount by the commission rate agreed with each customer. Stock transactions can lead to losses as a result of share price fluctuations and other factors. Transactions in foreign stocks can lead to additional losses stemming from foreign exchange fluctuations. "Moody's", "Standard & Poor's", and "Fitch" mentioned in this report are not registered credit rating agencies in Japan unless “Japan” or "Nippon" is specifically designated in the name of the entity. Russia: This information, interpretation and opinions submitted herein are not in the context of, and do not constitute, any appraisal or evaluation activity requiring a license in the Russian Federation. Page48 Deutsche Bank AG/Hong Kong
  • 49.
    Deutsche Bank AG/HongKong Asia-Pacific locations Deutsche Bank AG Deutsche Bank AG Deutsche Equities India Pte Ltd Deutsche Securities Inc. Deutsche Bank Place Filiale Hongkong 3rd Floor, Kodak House 2-11-1 Nagatacho Level 16 International Commerce Centre, 222, Dr D.N. Road Sanno Park Tower Corner of Hunter & Phillip Streets 1 Austin Road West,Kowloon, Fort, Mumbai 400 001 Chiyoda-ku, Tokyo 100-6171 Sydney, NSW 2000 Hong Kong SEBI Nos: INB231196834 Japan Australia tel: (852) 2203 8888 INB011196830, INF231196834 Tel: (81) 3 5156 6770 Tel: (61) 2 8258 1234 Tel: (91) 22 6658 4600 Deutsche Bank (Malaysia) In association with Deutsche Securities Korea Co. Deutsche Bank AG Berhad Deutsche Regis Partners, Inc. 17th Floor, YoungPoong Bldg., Singapore Level 18-20 Level 23, Tower One 33 SeoRin-Dong, One Raffles Quay Menara IMC Ayala Triangle, Ayala Avenue Chongro-Ku, Seoul (110-752) South Tower 8 Jalan Sultan Ismail Makati City, Philippines Republic of Korea Singapore 048583 Kuala Lumpur 50250 Tel: (63) 2 894 6600 Tel: (82) 2 316 8888 Tel: (65) 6423 8001 Malaysia Tel: (60) 3 2053 6760 Deutsche Securities Asia Ltd In association with In association with Taiwan Branch TISCO Securities Co., Ltd PT Deutsche Verdhana Indonesia Level 6 TISCO Tower Deutsche Bank Building, 296 Jen-Ai Road, Sec 4 48/8 North Sathorn Road 6th Floor, Jl. Imam Bonjol No.80, Taipei 106 Bangkok 10500 Central Jakarta, Taiwan Thailand Indonesia Tel: (886) 2 2192 2888 Tel: (66) 2 633 6470 Tel: (62 21) 318 9541 International locations Deutsche Bank Securities Inc. Deutsche Bank AG London Deutsche Bank AG Deutsche Bank AG 60 Wall Street 1 Great Winchester Street Große Gallusstraße 10-14 Deutsche Bank Place New York, NY 10005 London EC2N 2EQ 60272 Frankfurt am Main Level 16 United States of America United Kingdom Germany Corner of Hunter & Phillip Streets Tel: (1) 212 250 2500 Tel: (44) 20 7545 8000 Tel: (49) 69 910 00 Sydney, NSW 2000 Australia Tel: (61) 2 8258 1234 Deutsche Bank AG Deutsche Securities Inc. Filiale Hongkong 2-11-1 Nagatacho International Commerce Centre, Sanno Park Tower 1 Austin Road West,Kowloon, Chiyoda-ku, Tokyo 100-6171 Hong Kong Japan Tel: (852) 2203 8888 Tel: (81) 3 5156 6770 Global Disclaimer The information and opinions in this report were prepared by Deutsche Bank AG or one of its affiliates (collectively "Deutsche Bank"). The information herein is believed to be reliable and has been obtained from public sources believed to be reliable. Deutsche Bank makes no representation as to the accuracy or completeness of such information. Deutsche Bank may engage in securities transactions, on a proprietary basis or otherwise, in a manner inconsistent with the view taken in this research report. In addition, others within Deutsche Bank, including strategists and sales staff, may take a view that is inconsistent with that taken in this research report. Opinions, estimates and projections in this report constitute the current judgement of the author as of the date of this report. They do not necessarily reflect the opinions of Deutsche Bank and are subject to change without notice. Deutsche Bank has no obligation to update, modify or amend this report or to otherwise notify a recipient thereof in the event that any opinion, forecast or estimate set forth herein, changes or subsequently becomes inaccurate. Prices and availability of financial instruments are subject to change without notice. This report is provided for informational purposes only. It is not an offer or a solicitation of an offer to buy or sell any financial instruments or to participate in any particular trading strategy. Target prices are inherently imprecise and a product of the analyst judgement. As a result of Deutsche Bank’s March 2010 acquisition of BHF-Bank AG, a security may be covered by more than one analyst within the Deutsche Bank group. Each of these analysts may use differing methodologies to value the security; as a result, the recommendations may differ and the price targets and estimates of each may vary widely. In August 2009, Deutsche Bank instituted a new policy whereby analysts may choose not to set or maintain a target price of certain issuers under coverage with a Hold rating. In particular, this will typically occur for "Hold" rated stocks having a market cap smaller than most other companies in its sector or region. We believe that such policy will allow us to make best use of our resources. Please visit our website at http://gm.db.com to determine the target price of any stock. The financial instruments discussed in this report may not be suitable for all investors and investors must make their own informed investment decisions. Stock transactions can lead to losses as a result of price fluctuations and other factors. If a financial instrument is denominated in a currency other than an investor's currency, a change in exchange rates may adversely affect the investment. Past performance is not necessarily indicative of future results. Deutsche Bank may with respect to securities covered by this report, sell to or buy from customers on a principal basis, and consider this report in deciding to trade on a proprietary basis. Unless governing law provides otherwise, all transactions should be executed through the Deutsche Bank entity in the investor's home jurisdiction. In the U.S. this report is approved and/or distributed by Deutsche Bank Securities Inc., a member of the NYSE, the NASD, NFA and SIPC. In Germany this report is approved and/or communicated by Deutsche Bank AG Frankfurt authorized by the BaFin. In the United Kingdom this report is approved and/or communicated by Deutsche Bank AG London, a member of the London Stock Exchange and regulated by the Financial Services Authority for the conduct of investment business in the UK and authorized by the BaFin. This report is distributed in Hong Kong by Deutsche Bank AG, Hong Kong Branch, in Korea by Deutsche Securities Korea Co. This report is distributed in Singapore by Deutsche Bank AG, Singapore Branch, and recipients in Singapore of this report are to contact Deutsche Bank AG, Singapore Branch in respect of any matters arising from, or in connection with, this report. Where this report is issued or promulgated in Singapore to a person who is not an accredited investor, expert investor or institutional investor (as defined in the applicable Singapore laws and regulations), Deutsche Bank AG, Singapore Branch accepts legal responsibility to such person for the contents of this report. In Japan this report is approved and/or distributed by Deutsche Securities Inc. The information contained in this report does not constitute the provision of investment advice. In Australia, retail clients should obtain a copy of a Product Disclosure Statement (PDS) relating to any financial product referred to in this report and consider the PDS before making any decision about whether to acquire the product. Deutsche Bank AG Johannesburg is incorporated in the Federal Republic of Germany (Branch Register Number in South Africa: 1998/003298/10). Additional information relative to securities, other financial products or issuers discussed in this report is available upon request. This report may not be reproduced, distributed or published by any person for any purpose without Deutsche Bank's prior written consent. Please cite source when quoting. Copyright © 2012 Deutsche Bank AG GRCM2012PROD027185