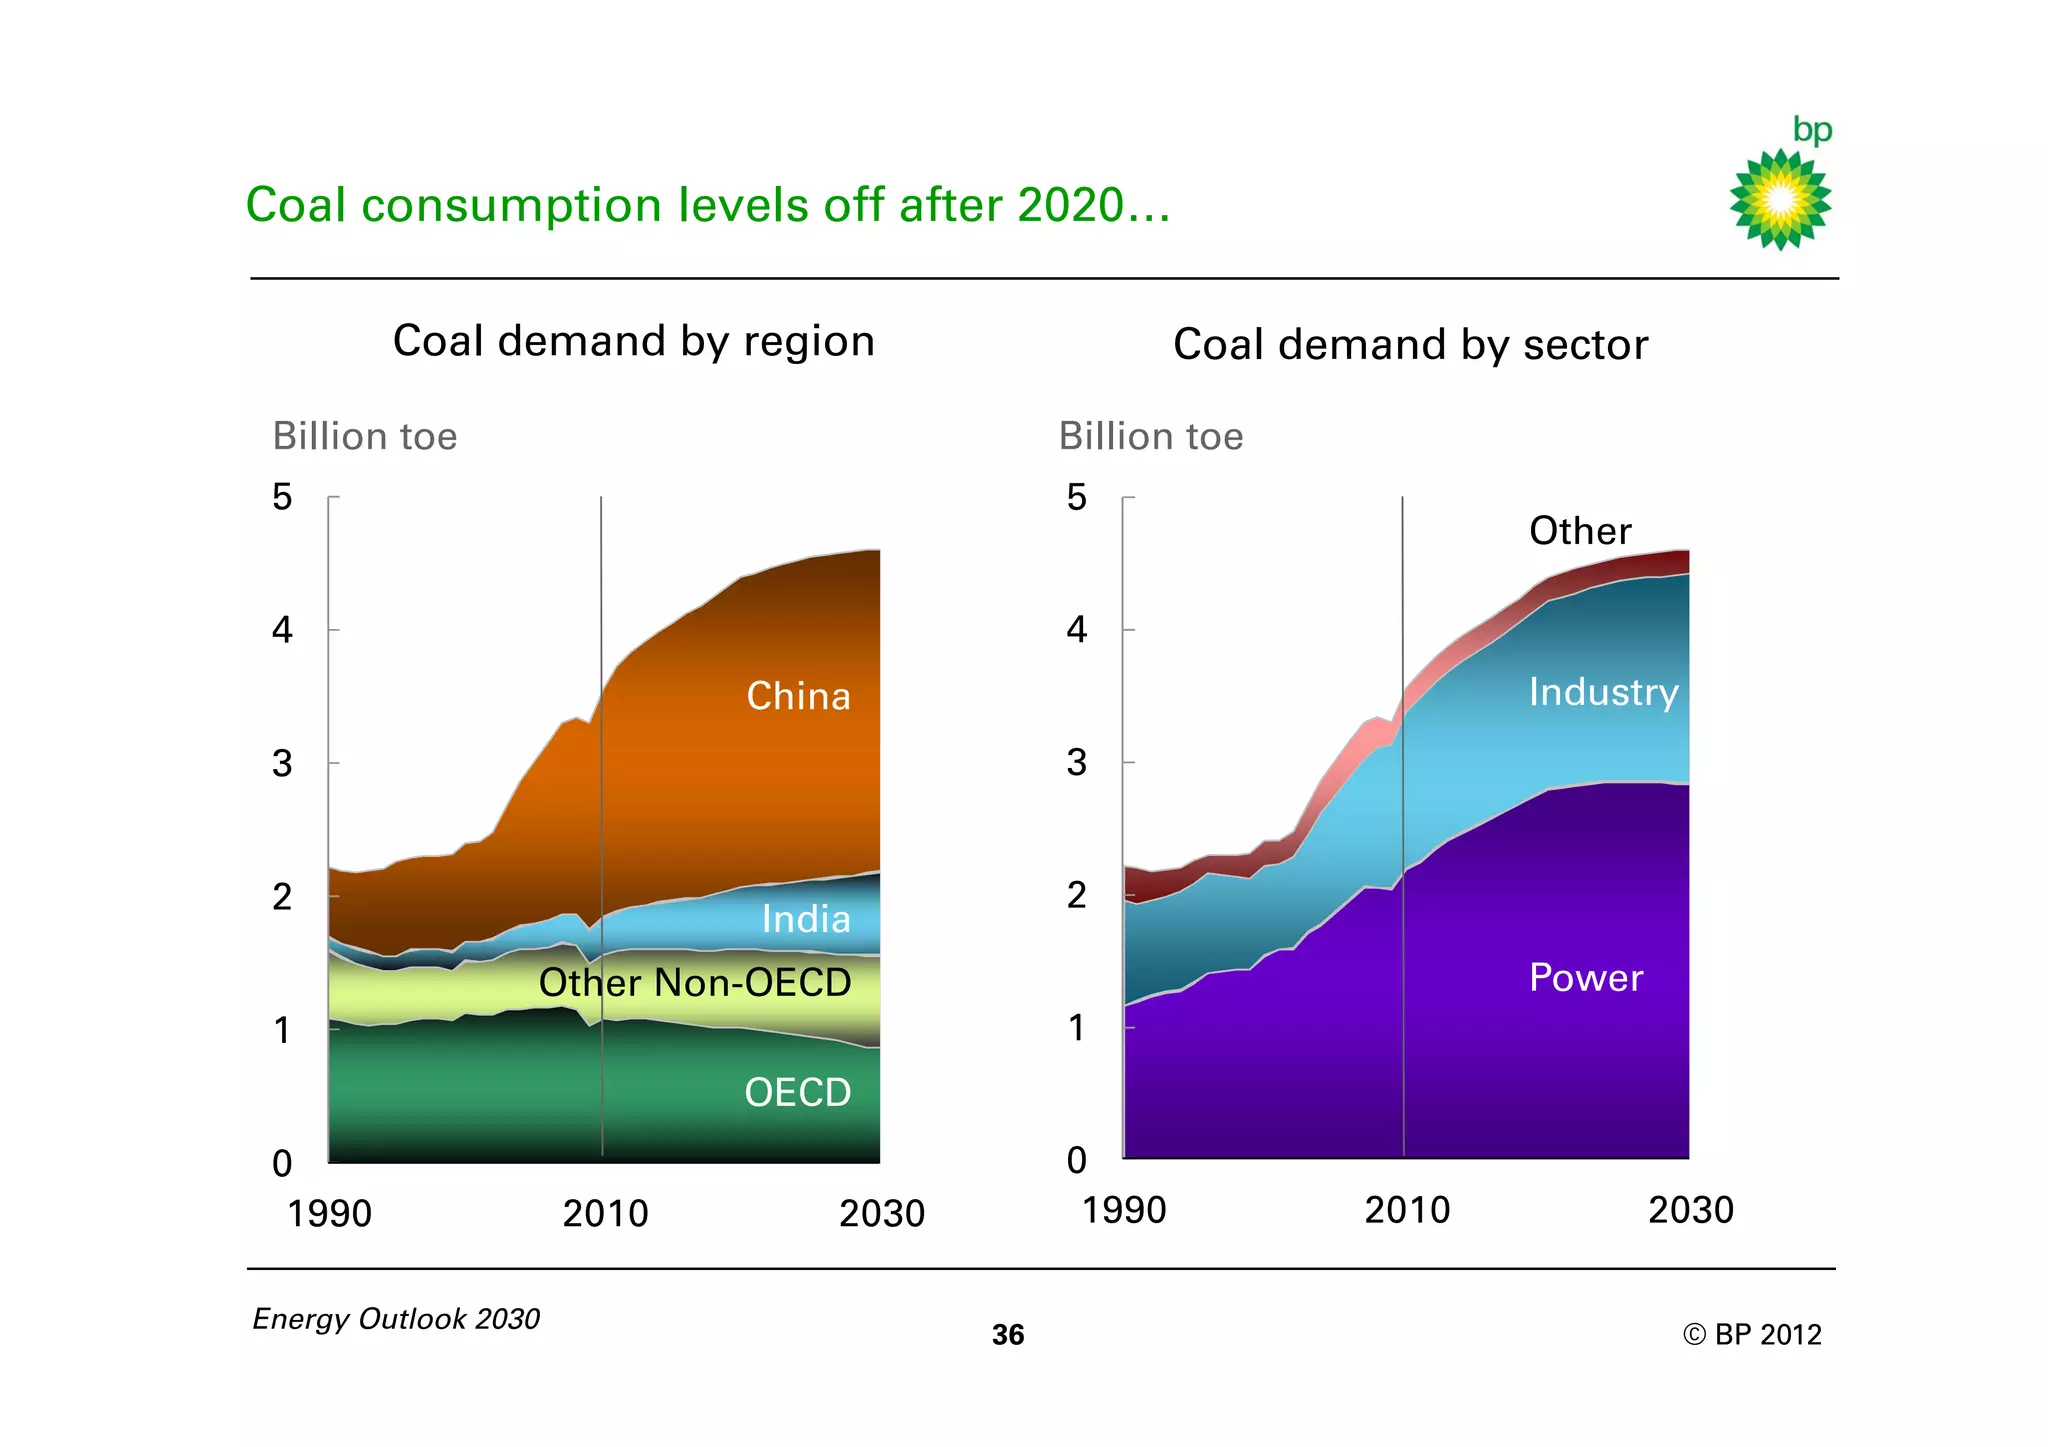
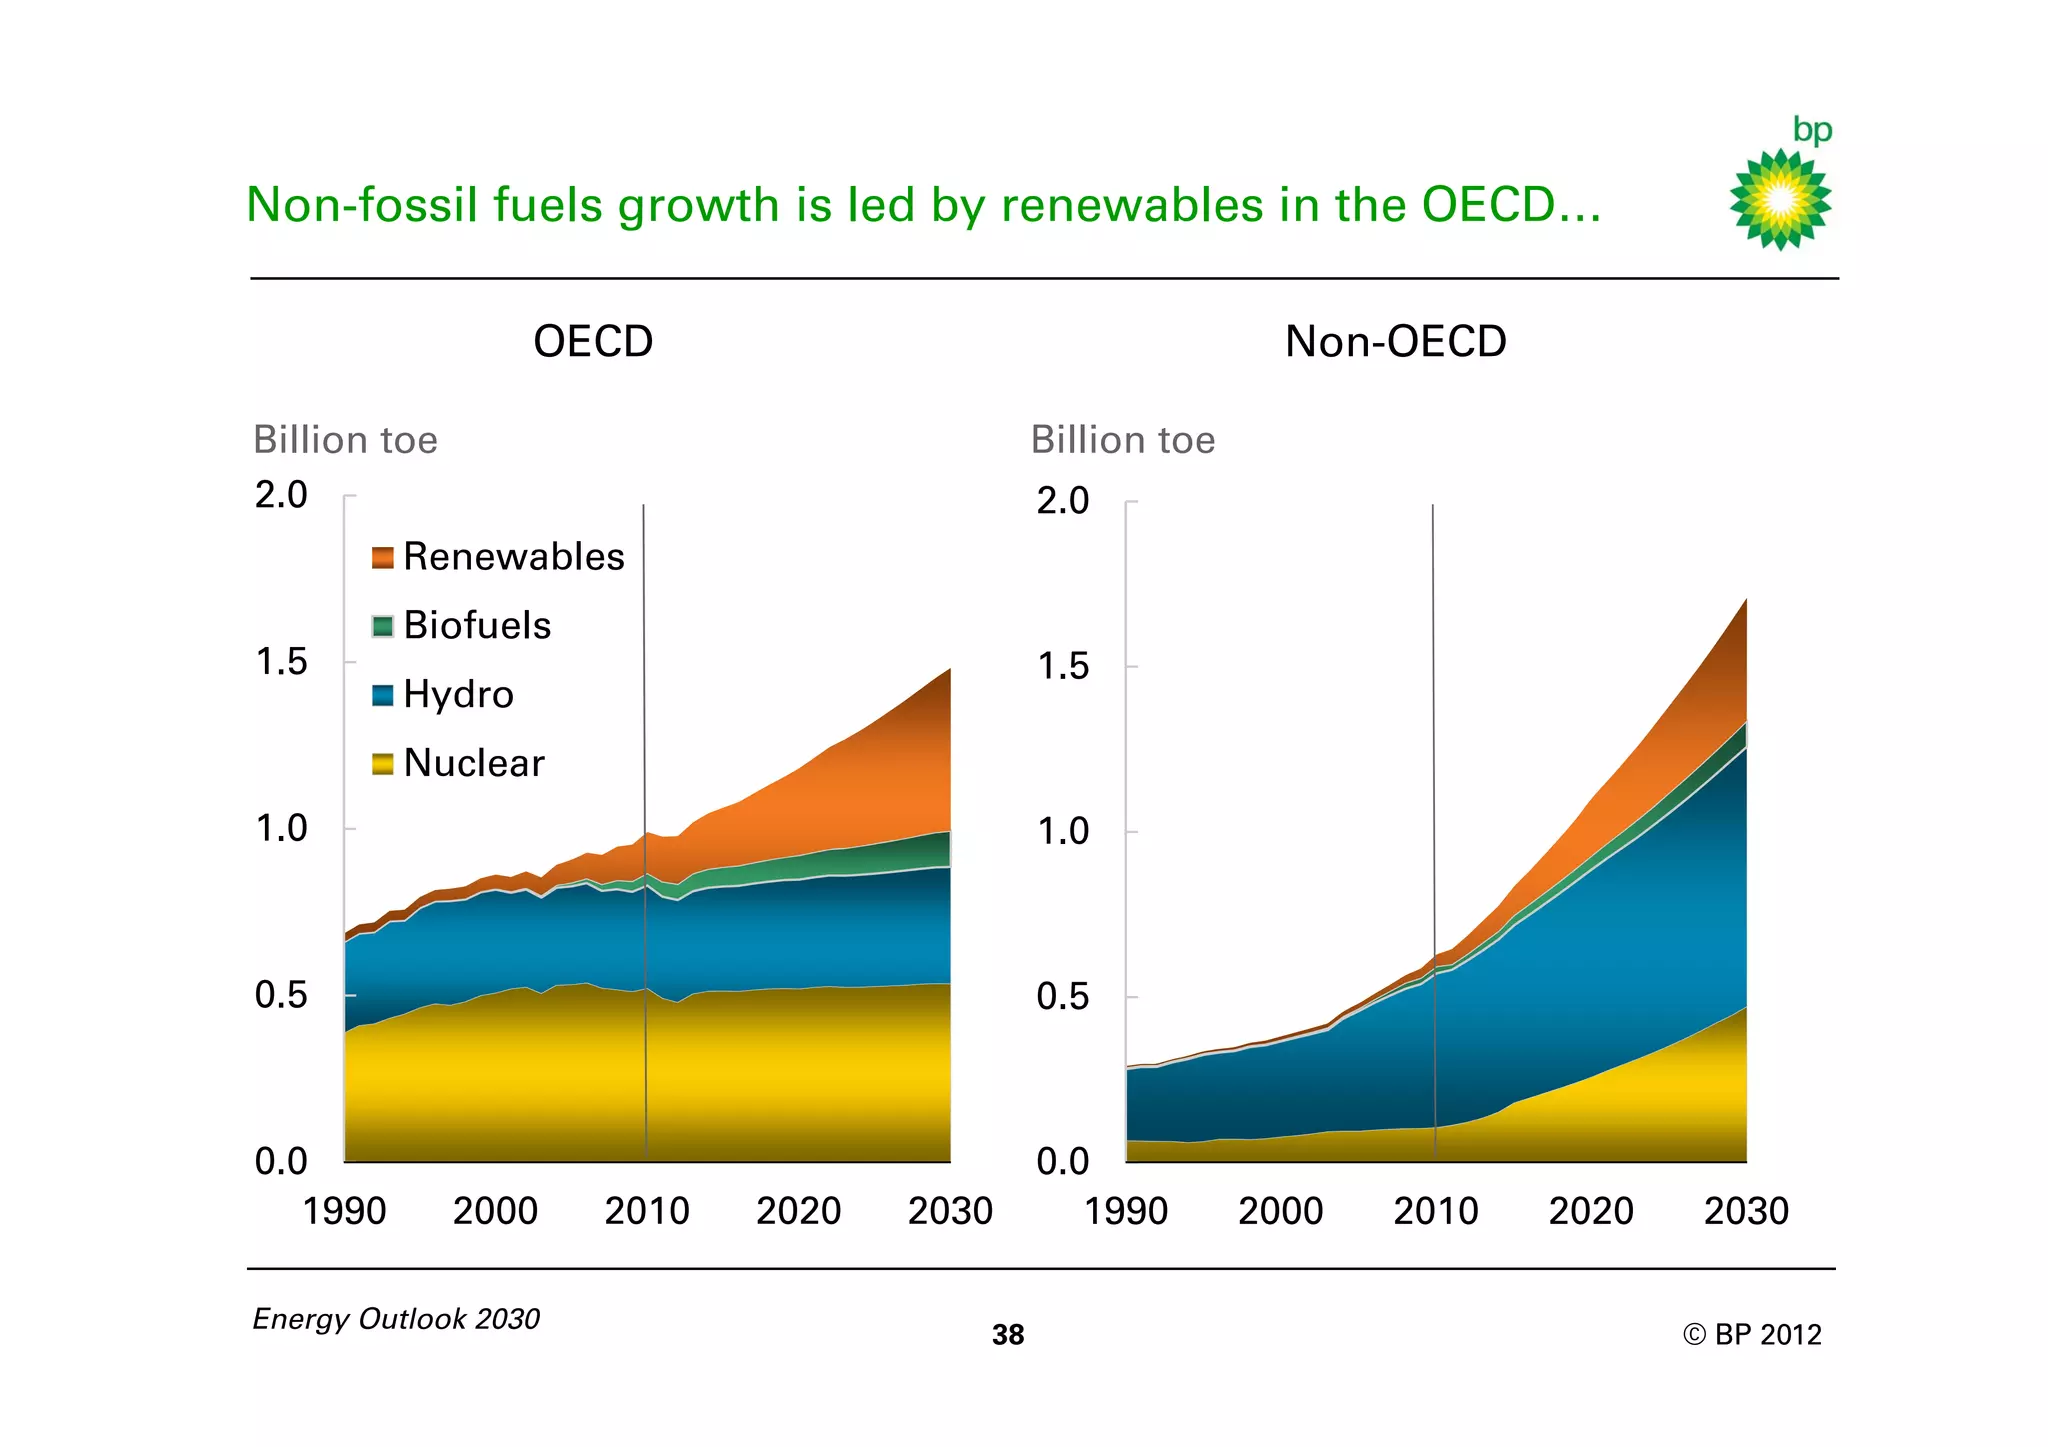
Download as PDF, PPTX
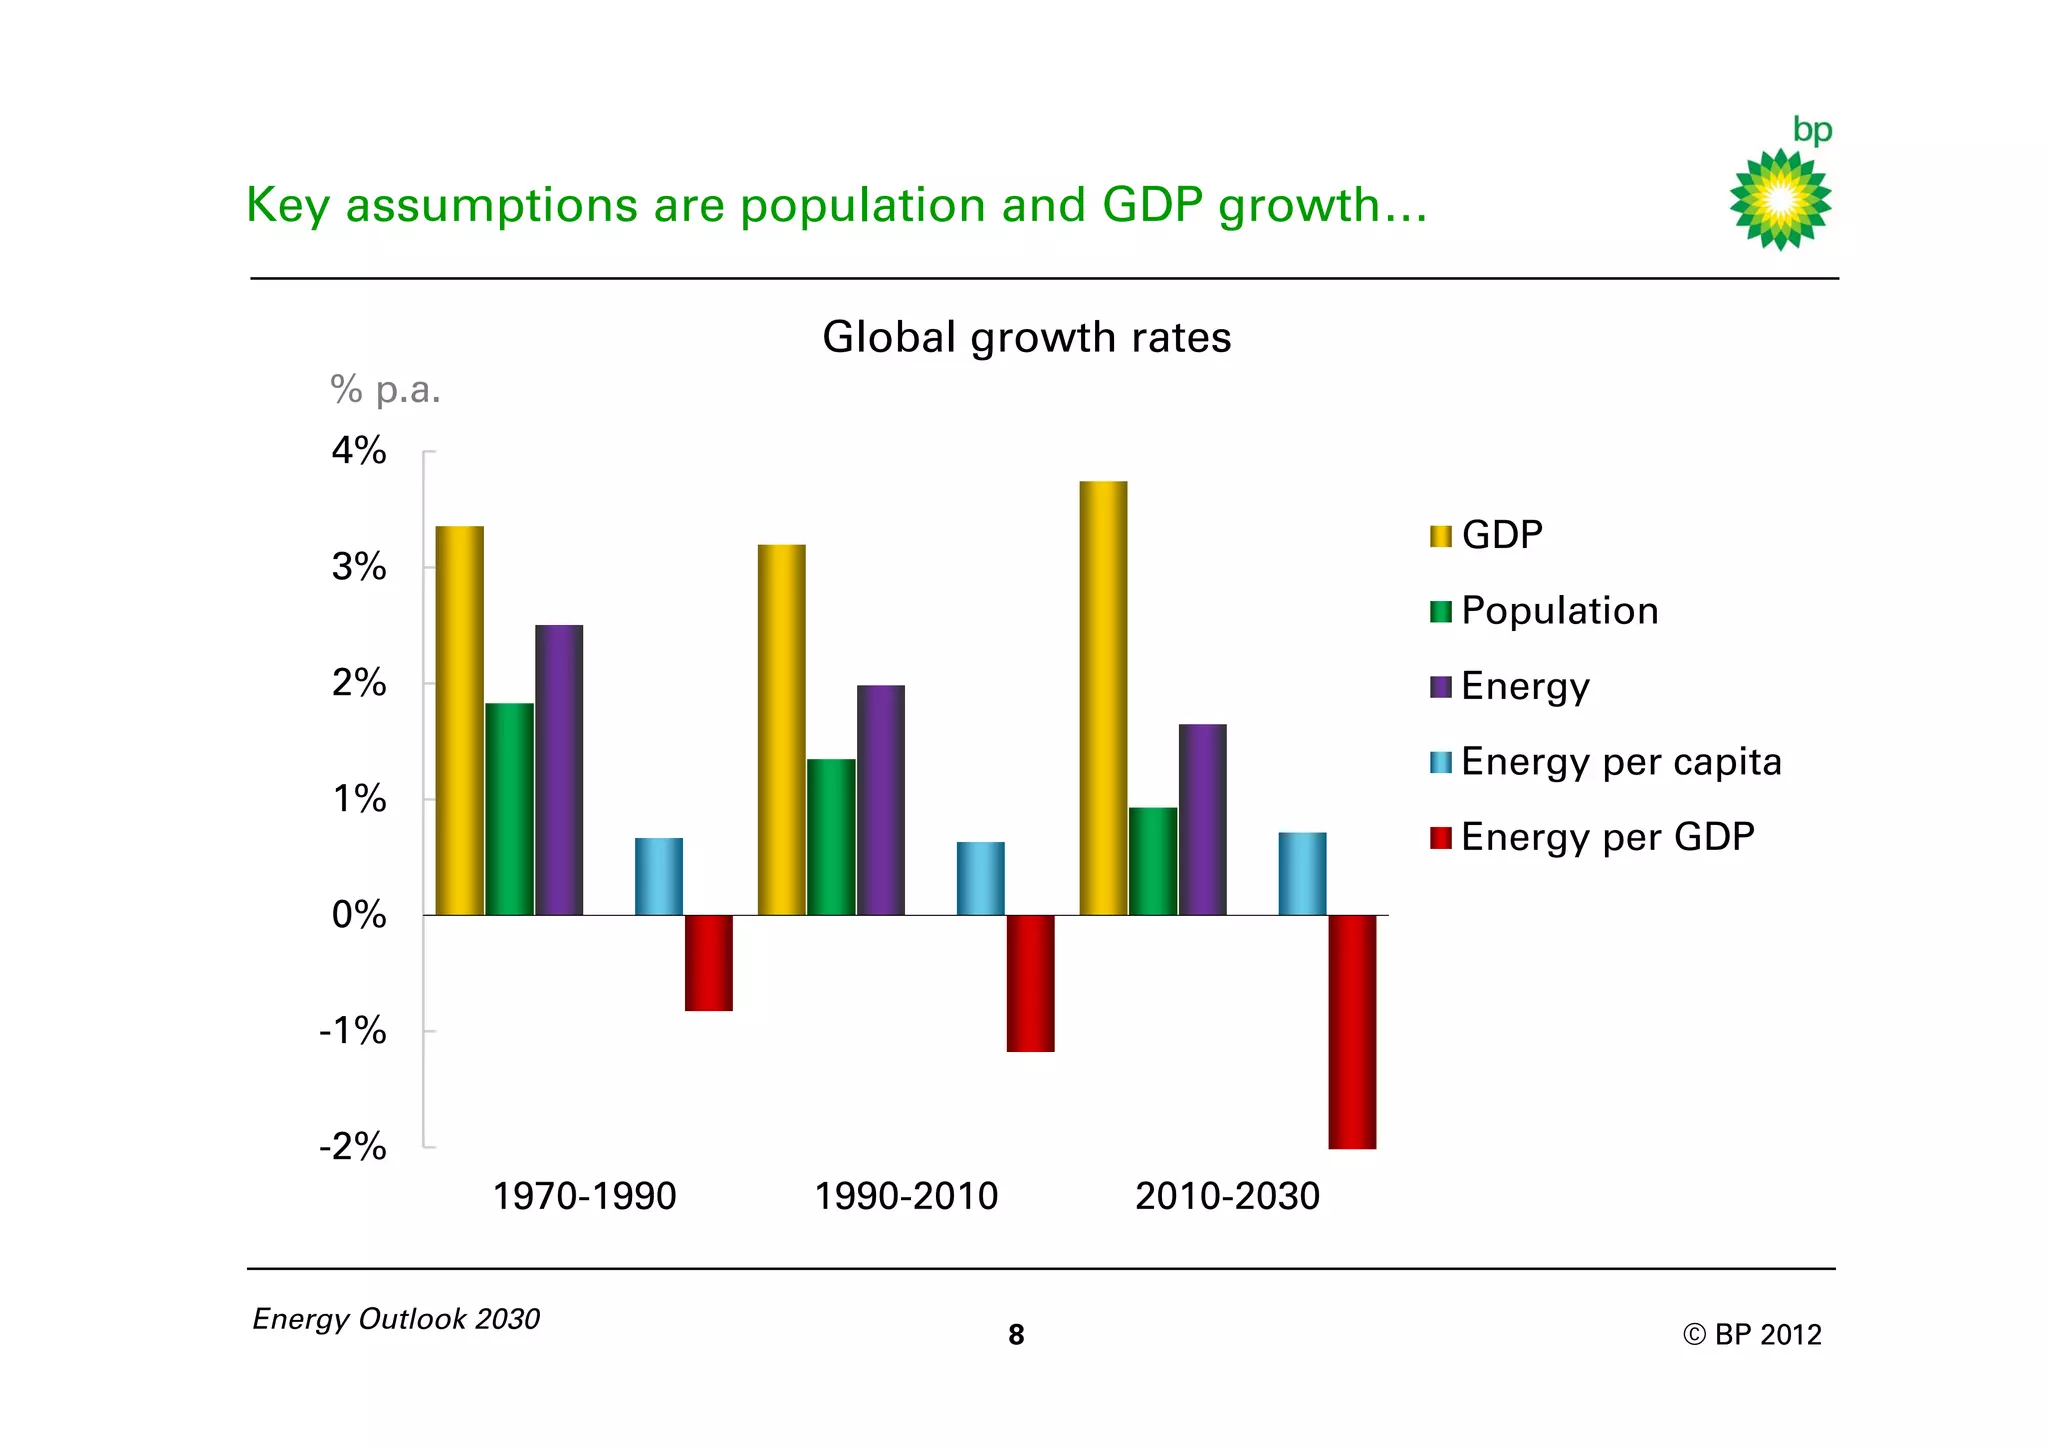
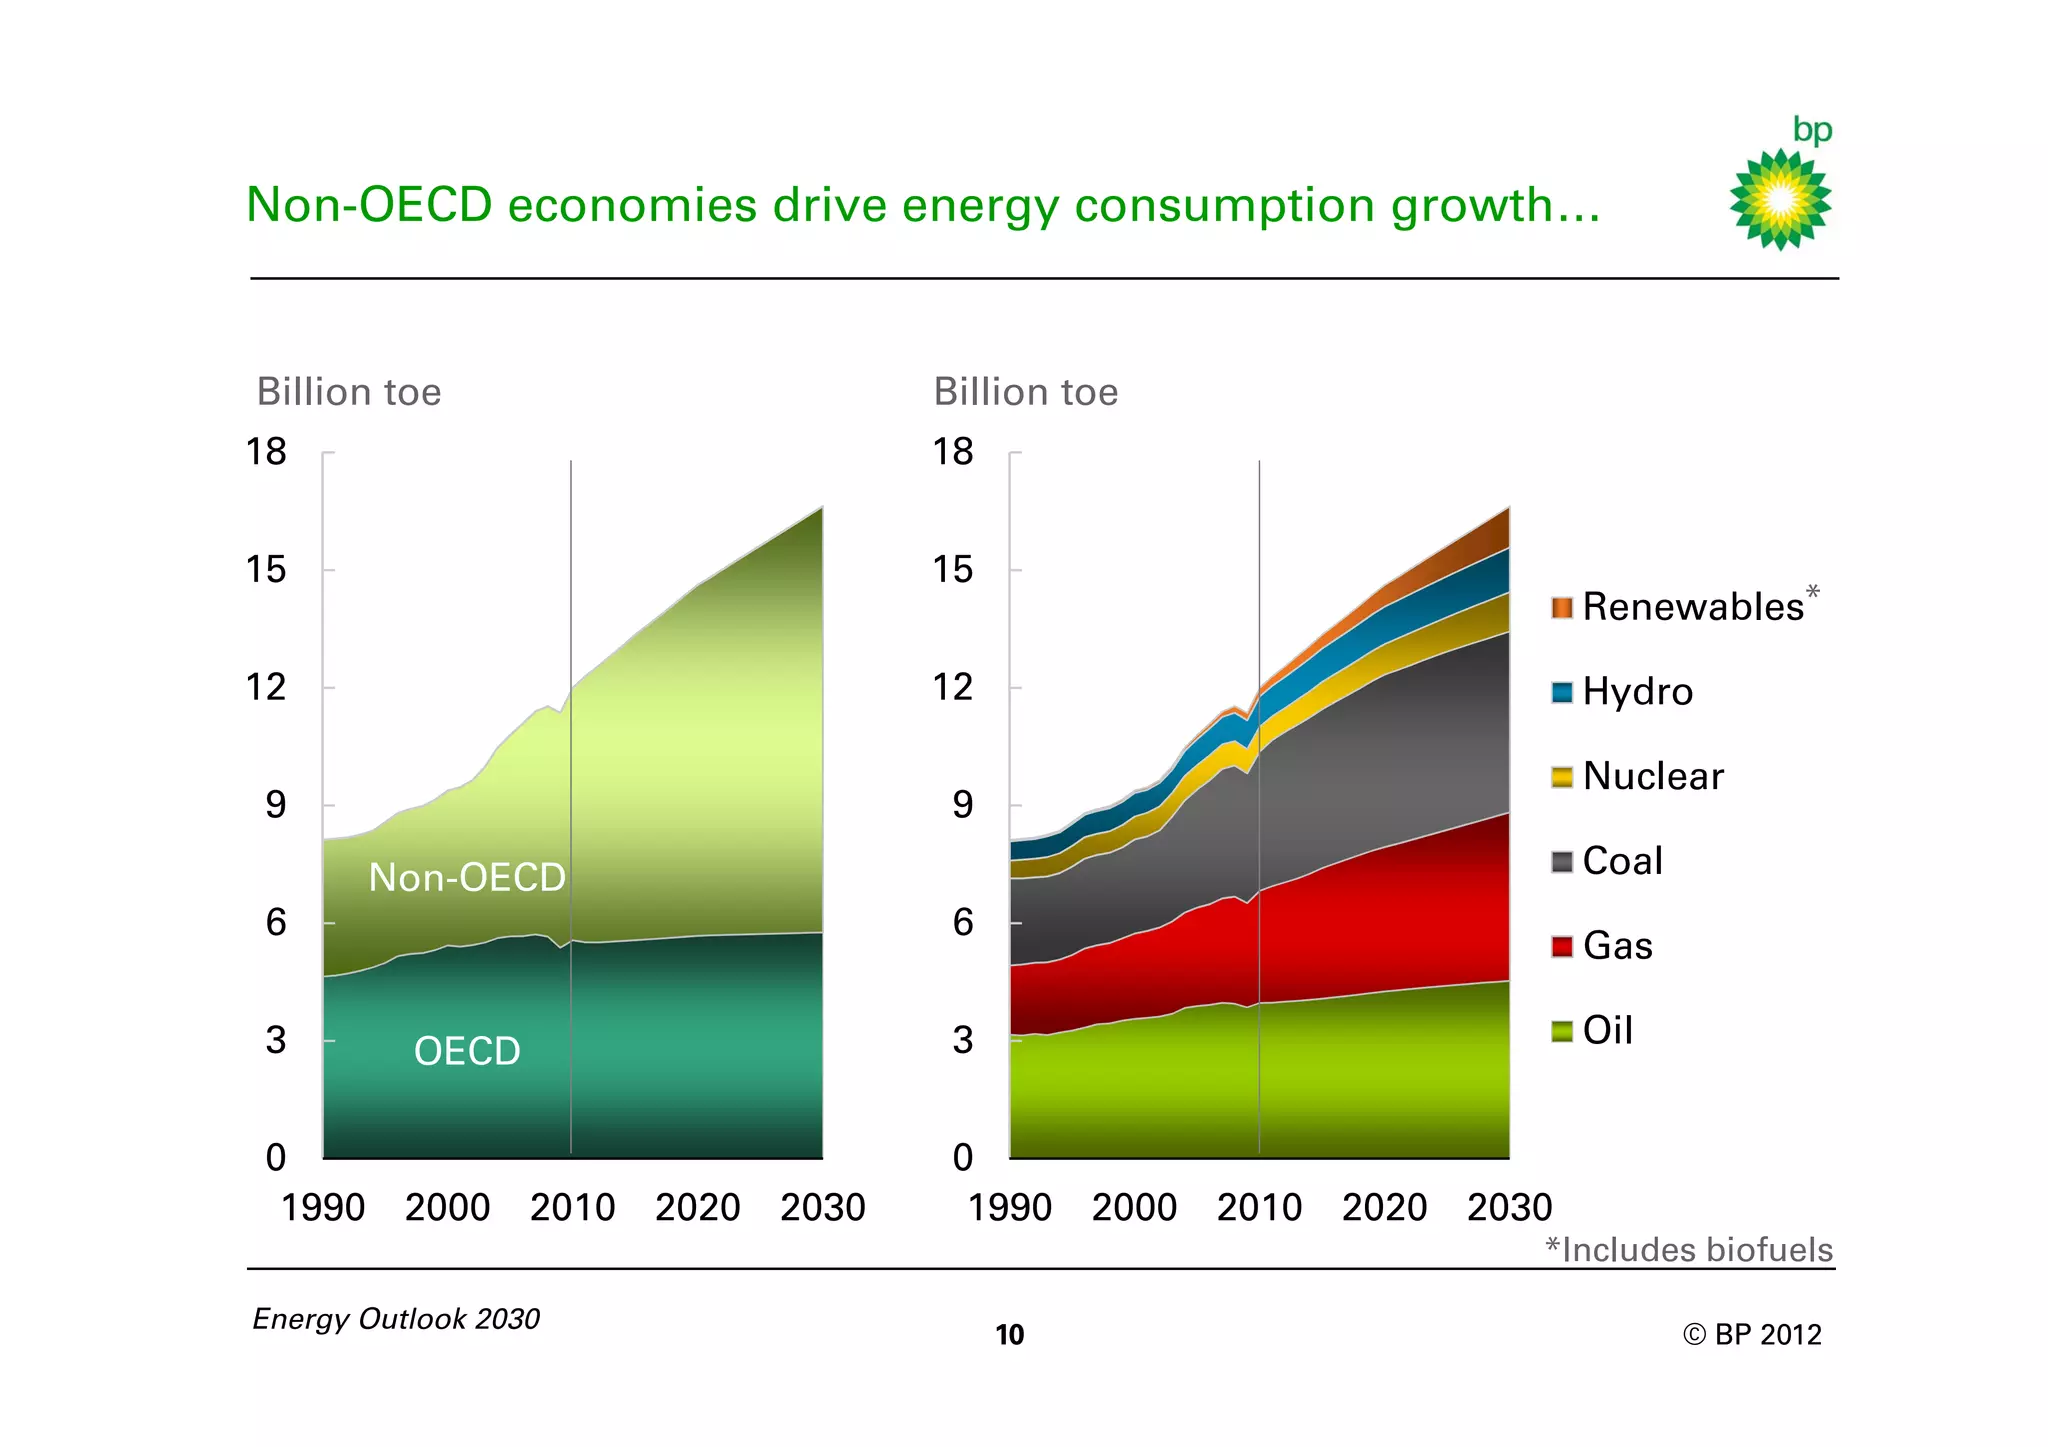
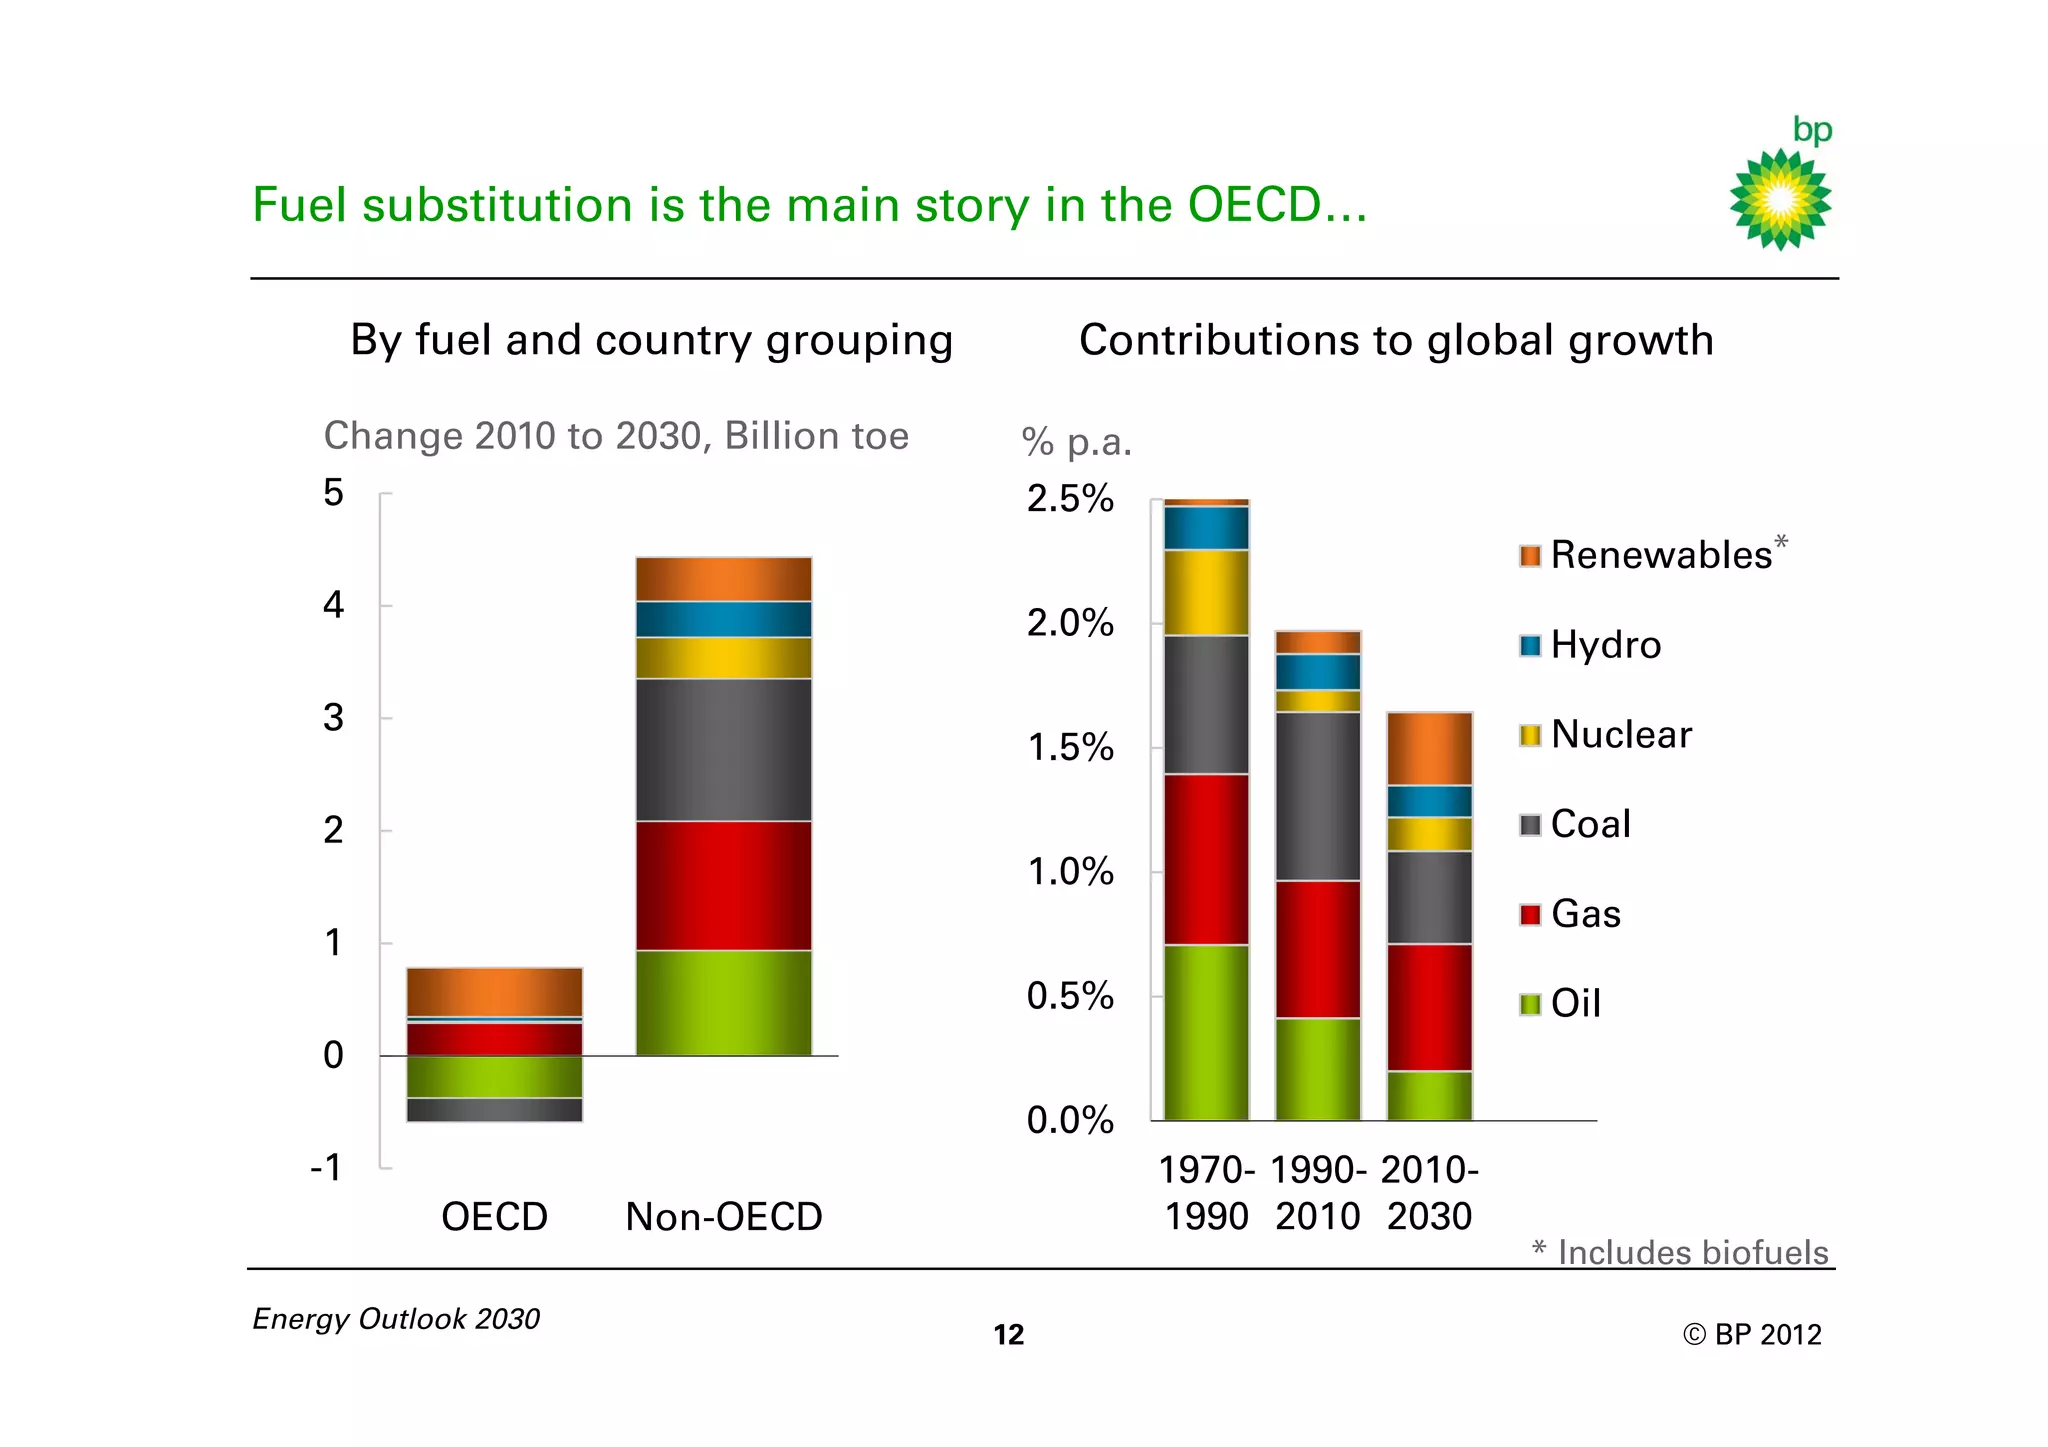


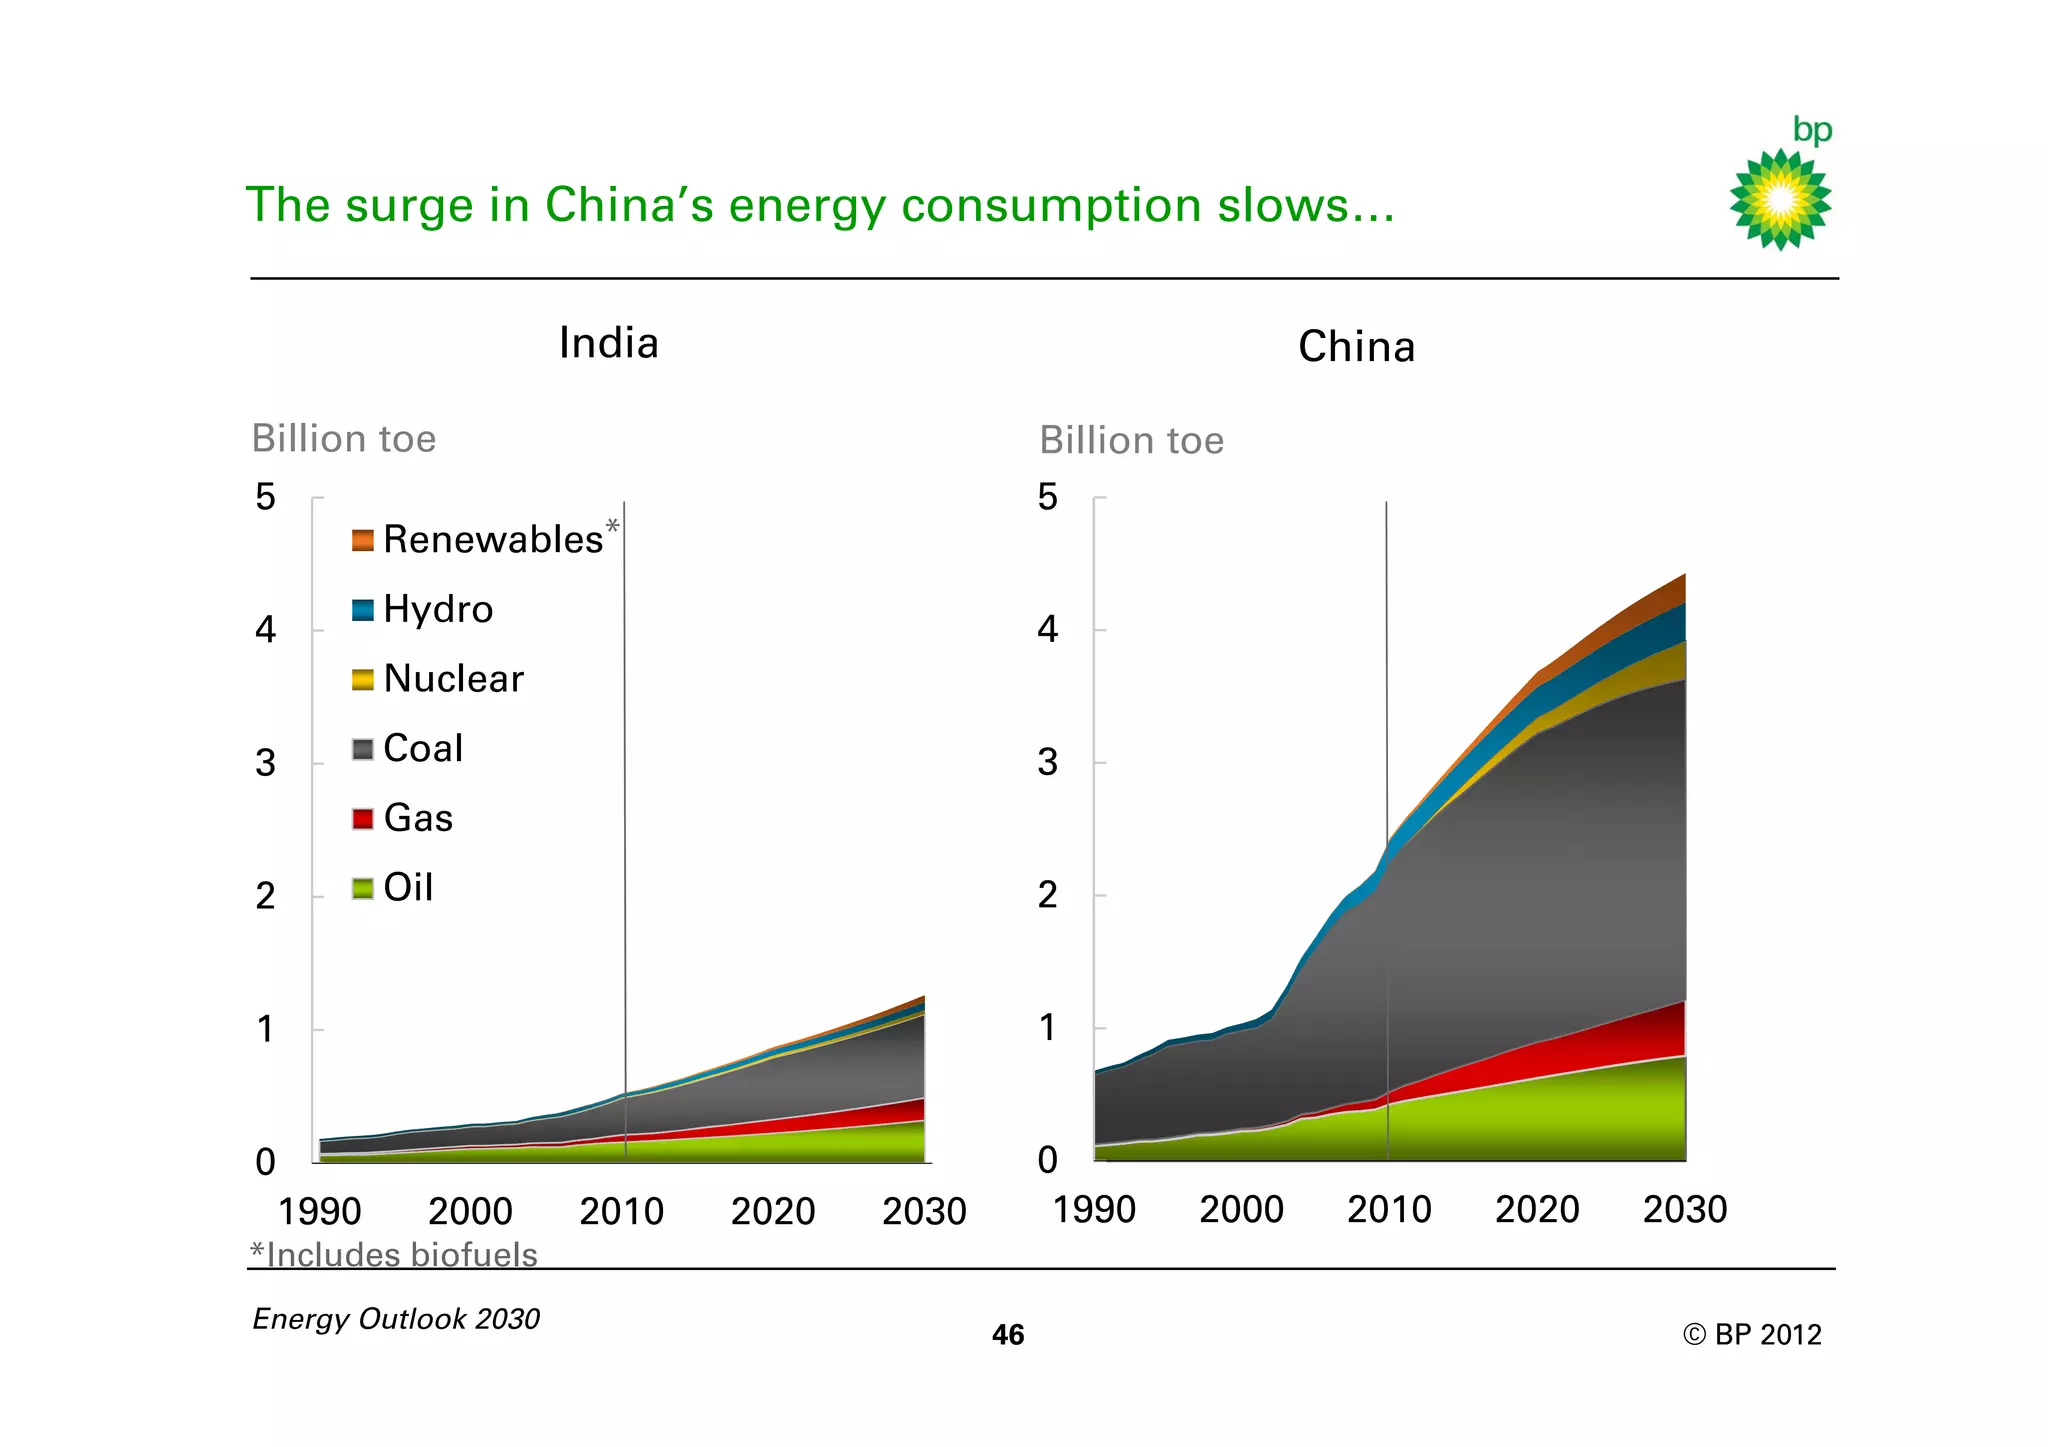
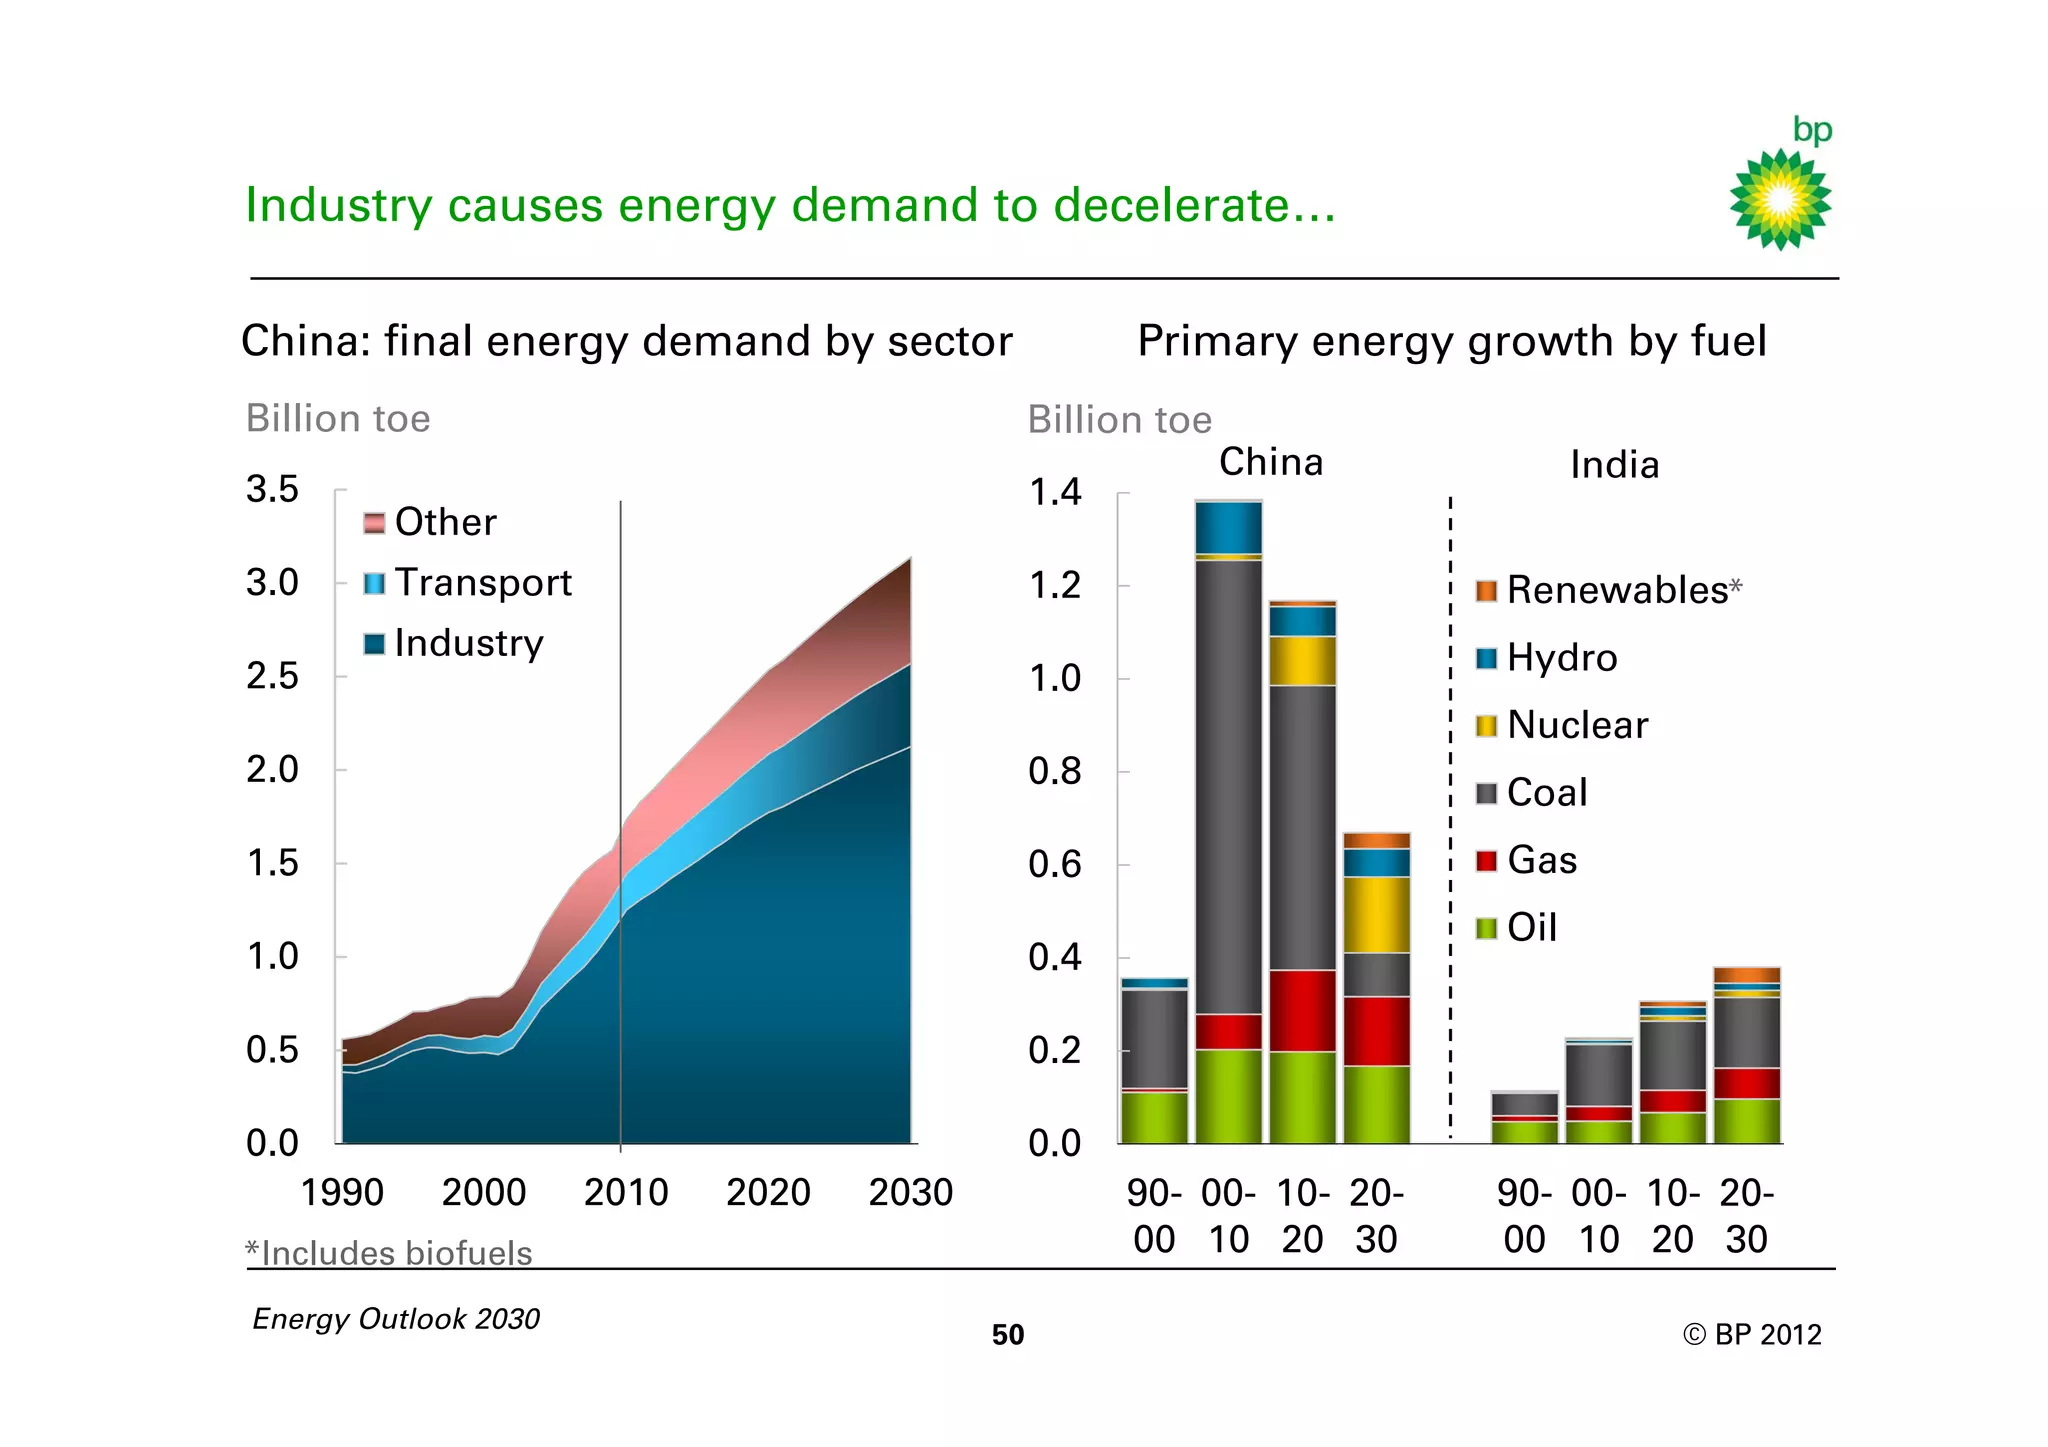


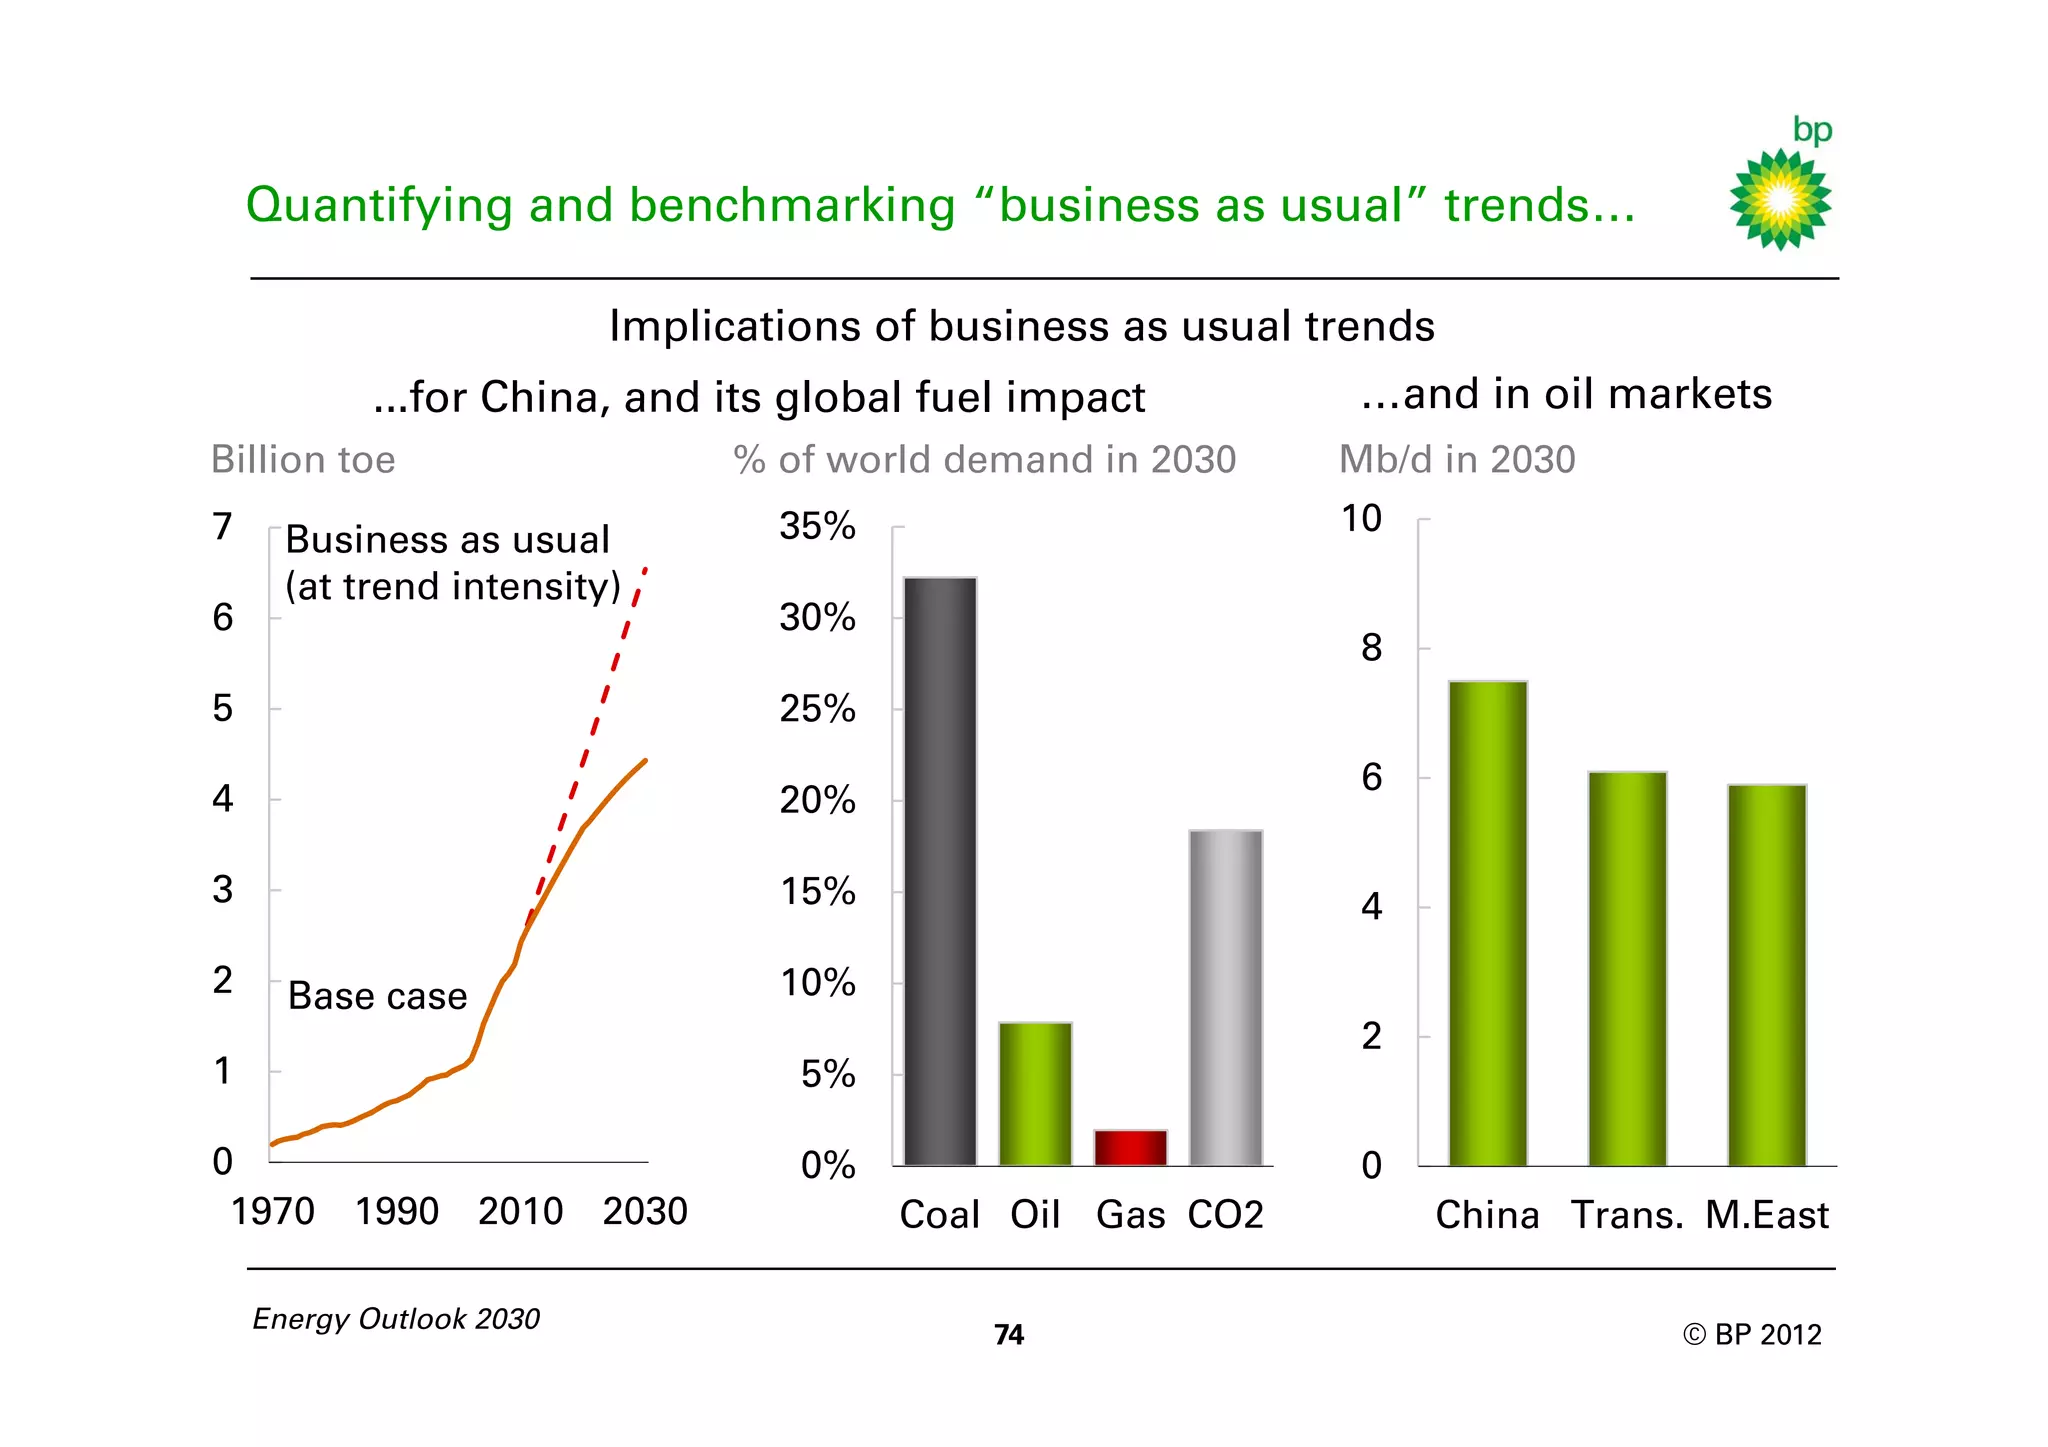


The document provides BP's Energy Outlook for 2030 which projects that: - Global energy demand will increase by 39% by 2030, with non-OECD countries driving most of the growth. - Gas and non-fossil fuels will gain share in the fuel mix at the expense of coal and oil over the next two decades. - Renewables will be the fastest growing fuel and contribute more to energy growth than oil. - China and India will see all fuels expanding to meet energy needs for economic development. - The power sector will remain the main driver of energy demand growth and fuel diversification through 2030.


