Download as PDF, PPTX

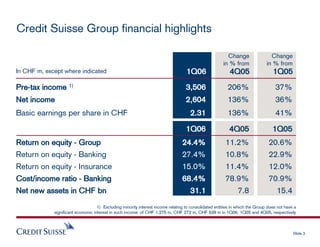
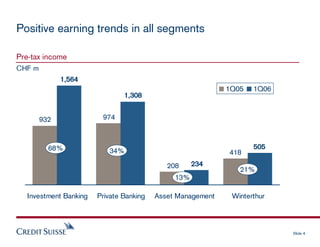

Credit Suisse Group reported strong results for the first quarter of 2006. Net income increased 136% compared to the fourth quarter of 2005 and 36% compared to the first quarter of 2005. All business segments - Investment Banking, Private Banking, Asset Management and Winterthur - delivered higher pre-tax income compared to the same period a year ago. Investment Banking benefited from record revenues in fixed income and equity trading. Private Banking saw significant growth in commissions and fees. Asset Management registered good net new asset inflows while Winterthur continued its strong operating performance.


