Download to read offline


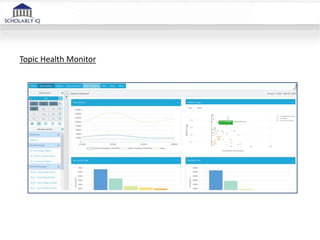
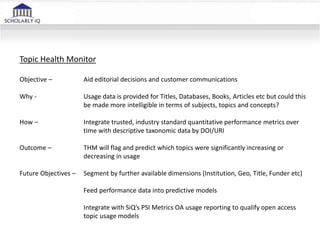
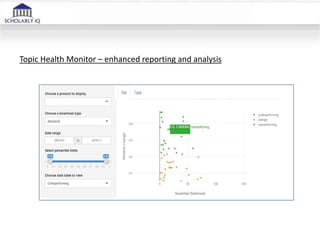
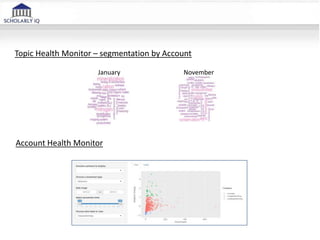
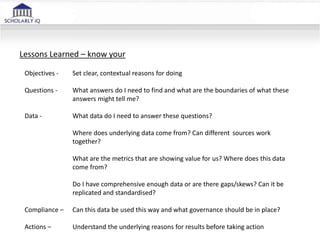
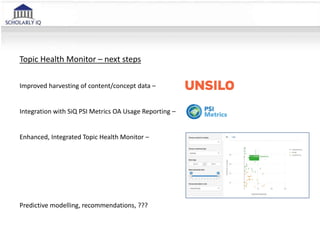

The document discusses the development and insights of the Topic Health Monitor (THM) by Scholarly IQ, aimed at enhancing usage reporting through predictive analytics and integration of performance metrics with taxonomic data. It outlines the objectives, methods of implementation, and identified opportunities for improved data analysis and reporting, while also addressing challenges with data reliability. Lessons learned emphasize the importance of clear objectives, comprehensive data quality, and effective governance for analysis.