Download free for 30 days
Sign in
Upload
Language (EN)
Support
Business
Mobile
Social Media
Marketing
Technology
Art & Photos
Career
Design
Education
Presentations & Public Speaking
Government & Nonprofit
Healthcare
Internet
Law
Leadership & Management
Automotive
Engineering
Software
Recruiting & HR
Retail
Sales
Services
Science
Small Business & Entrepreneurship
Food
Environment
Economy & Finance
Data & Analytics
Investor Relations
Sports
Spiritual
News & Politics
Travel
Self Improvement
Real Estate
Entertainment & Humor
Health & Medicine
Devices & Hardware
Lifestyle
Change Language
Language
English
Español
Português
Français
Deutsche
Cancel
Save
EN
Uploaded by
オラクルエンジニア通信
PPTX, PDF
1,014 views
【2016年3月時点】Data Visualization Cloud Service ハンズオン資料
無料で受講可能なオンライン版のDVCSハンズオンセミナ資料です。
Data & Analytics
◦
Related topics:
Data Visualization Techniques
•
Read more
0
Save
Share
Embed
Embed presentation
Download
Download to read offline
1
/ 55
2
/ 55
3
/ 55
4
/ 55
5
/ 55
6
/ 55
7
/ 55
8
/ 55
9
/ 55
10
/ 55
11
/ 55
12
/ 55
13
/ 55
14
/ 55
15
/ 55
16
/ 55
17
/ 55
18
/ 55
19
/ 55
20
/ 55
21
/ 55
22
/ 55
23
/ 55
24
/ 55
25
/ 55
26
/ 55
27
/ 55
28
/ 55
29
/ 55
30
/ 55
31
/ 55
32
/ 55
33
/ 55
34
/ 55
35
/ 55
36
/ 55
37
/ 55
38
/ 55
39
/ 55
40
/ 55
41
/ 55
42
/ 55
43
/ 55
44
/ 55
45
/ 55
46
/ 55
47
/ 55
48
/ 55
49
/ 55
50
/ 55
51
/ 55
52
/ 55
53
/ 55
54
/ 55
55
/ 55
More Related Content
PDF
Oracle R Enterprise の使い方
by
オラクルエンジニア通信
PDF
Oracle R Advanced Analytics for Hadoop利用方法
by
オラクルエンジニア通信
PDF
【2016年3月時点】クラウド型 BI だからできる新たな情報活用方法
by
オラクルエンジニア通信
PDF
Oracle Big Data Cloud Serviceのご紹介
by
オラクルエンジニア通信
PPTX
20160301 5日でできるクラウドで始めるデータ利活用 新日鉄住金ソリューションズ株式会社
by
オラクルエンジニア通信
PDF
RDF Semantic Graph「RDF 超入門」
by
オラクルエンジニア通信
PDF
Oracle R Enterprise のセットアップ
by
オラクルエンジニア通信
PPTX
Oracle Data Miner Tutorial 01
by
オラクルエンジニア通信
Oracle R Enterprise の使い方
by
オラクルエンジニア通信
Oracle R Advanced Analytics for Hadoop利用方法
by
オラクルエンジニア通信
【2016年3月時点】クラウド型 BI だからできる新たな情報活用方法
by
オラクルエンジニア通信
Oracle Big Data Cloud Serviceのご紹介
by
オラクルエンジニア通信
20160301 5日でできるクラウドで始めるデータ利活用 新日鉄住金ソリューションズ株式会社
by
オラクルエンジニア通信
RDF Semantic Graph「RDF 超入門」
by
オラクルエンジニア通信
Oracle R Enterprise のセットアップ
by
オラクルエンジニア通信
Oracle Data Miner Tutorial 01
by
オラクルエンジニア通信
What's hot
PDF
20160323 道玄坂LT祭り オラクル資料
by
オラクルエンジニア通信
PDF
Oracle Spatial 概要説明資料
by
オラクルエンジニア通信
PDF
20151209 Oracle DDD オラクルで実現するクラウド・マシン・ラーニング
by
オラクルエンジニア通信
PDF
Oracle Cloud PaaS & IaaS:2018年5月度サービス情報アップデート
by
オラクルエンジニア通信
PDF
20160916 ビッグデータシンポジウム オラクル公開資料
by
オラクルエンジニア通信
PDF
0151209 Oracle DDD OracleとHadoop連携の勘所
by
オラクルエンジニア通信
PDF
【OCP Summit 2016】最高のDB基盤Exadataをクラウドで活用しよう
by
オラクルエンジニア通信
PDF
Hadoop Conference Japan 2016 LT資料 グラフデータベース事始め
by
オラクルエンジニア通信
PDF
クラウドを使って競争優位なビッグデータ活用の実現へ [Oracle Cloud Days Tokyo 2016]
by
オラクルエンジニア通信
PDF
システム管理者向け、クラウドサービス「Oracle Management Cloud」で提供する3つの機能とは?~アプリケーション・パフォーマンス分析、ロ...
by
オラクルエンジニア通信
PDF
オラクルコンサルが語る!オラクルPaaS活用術(データベース・クラウド)(Oracle Cloud Days Tokyo 2015)
by
オラクルエンジニア通信
PPTX
Oracle Advanced Analytics 概要
by
オラクルエンジニア通信
PDF
Oracle Cloud PaaS & IaaS:2018年4月度サービス情報アップデート
by
オラクルエンジニア通信
PDF
BIがクラウドで更なる進化! データとの連携を強化したデータビジュアライゼーション
by
Hisashi Igarashi
PPTX
Oracle Labs 発! Parallel Graph AnalytiX(PGX)
by
オラクルエンジニア通信
PDF
ログ分析からセキュリティ監視まで:Oracle Management Cloudで実現するIT運用データのビッグデータ分析 [Oracle Cloud D...
by
オラクルエンジニア通信
PDF
Oracle Big Data SQL3.1のご紹介
by
オラクルエンジニア通信
PDF
つながる!クラウド・データベース間のリアルタイム・データ統合/連携とは
by
オラクルエンジニア通信
PDF
Oracle Cloud Platform - クラクドにおける 新たなデータベース開発
by
オラクルエンジニア通信
PDF
Oracle Cloud PaaS & IaaS:2018年7月度サービス情報アップデート
by
オラクルエンジニア通信
20160323 道玄坂LT祭り オラクル資料
by
オラクルエンジニア通信
Oracle Spatial 概要説明資料
by
オラクルエンジニア通信
20151209 Oracle DDD オラクルで実現するクラウド・マシン・ラーニング
by
オラクルエンジニア通信
Oracle Cloud PaaS & IaaS:2018年5月度サービス情報アップデート
by
オラクルエンジニア通信
20160916 ビッグデータシンポジウム オラクル公開資料
by
オラクルエンジニア通信
0151209 Oracle DDD OracleとHadoop連携の勘所
by
オラクルエンジニア通信
【OCP Summit 2016】最高のDB基盤Exadataをクラウドで活用しよう
by
オラクルエンジニア通信
Hadoop Conference Japan 2016 LT資料 グラフデータベース事始め
by
オラクルエンジニア通信
クラウドを使って競争優位なビッグデータ活用の実現へ [Oracle Cloud Days Tokyo 2016]
by
オラクルエンジニア通信
システム管理者向け、クラウドサービス「Oracle Management Cloud」で提供する3つの機能とは?~アプリケーション・パフォーマンス分析、ロ...
by
オラクルエンジニア通信
オラクルコンサルが語る!オラクルPaaS活用術(データベース・クラウド)(Oracle Cloud Days Tokyo 2015)
by
オラクルエンジニア通信
Oracle Advanced Analytics 概要
by
オラクルエンジニア通信
Oracle Cloud PaaS & IaaS:2018年4月度サービス情報アップデート
by
オラクルエンジニア通信
BIがクラウドで更なる進化! データとの連携を強化したデータビジュアライゼーション
by
Hisashi Igarashi
Oracle Labs 発! Parallel Graph AnalytiX(PGX)
by
オラクルエンジニア通信
ログ分析からセキュリティ監視まで:Oracle Management Cloudで実現するIT運用データのビッグデータ分析 [Oracle Cloud D...
by
オラクルエンジニア通信
Oracle Big Data SQL3.1のご紹介
by
オラクルエンジニア通信
つながる!クラウド・データベース間のリアルタイム・データ統合/連携とは
by
オラクルエンジニア通信
Oracle Cloud Platform - クラクドにおける 新たなデータベース開発
by
オラクルエンジニア通信
Oracle Cloud PaaS & IaaS:2018年7月度サービス情報アップデート
by
オラクルエンジニア通信
Similar to 【2016年3月時点】Data Visualization Cloud Service ハンズオン資料
PPTX
Data Visualization Cloud Service オンライン・ハンズオンセミナー
by
Hisashi Igarashi
PPTX
Oracle Data Visualization Cloud Service
by
Hisashi Igarashi
PDF
【2018年3月時点】Oracle Data Visualizaion ご紹介
by
オラクルエンジニア通信
PDF
BIがクラウドで更なる進化!データとの連携を強化したデータビジュアライゼーション(Oracle Cloud Days Tokyo 2015)
by
オラクルエンジニア通信
PPTX
ハンズオンセミナー:Answer編(非定型分析) ご説明資料
by
Hisashi Igarashi
PPTX
Oracle Data Minerハンズオンセミナー170927:③Business Analytics概要と事例
by
オラクルエンジニア通信
PPTX
【2017年5月時点】セルフサービスBIからエンタープライズまで展開できるOracle Business Analytics クラウドプラットフォームのご紹介
by
オラクルエンジニア通信
PPTX
Oracle Data Minerハンズオンセミナー170927:②Oracle data minerハンズオン資料
by
オラクルエンジニア通信
PDF
APEX Workshop III 日本語版
by
Nakakoshi Yuji
PDF
20190426 maenaka share
by
Mai Nagahisa
PPTX
データ・ビジュアライゼーションによる新しい気づきとは
by
Hisashi Igarashi
PDF
[Modern Cloud Day Tokyo 2019] 【ビジネスをさらに加速させる!!】Oracle Cloud を活用したデータドリブン ユースケ...
by
オラクルエンジニア通信
PPTX
【2017年4月時点】Oracle Essbase 概要
by
オラクルエンジニア通信
PDF
[Oracle Innovation Summit Tokyo 2018] 水環境の持続を支えるクラウド型ICTプラットフォーム「Water Busine...
by
オラクルエンジニア通信
PPTX
【2016年10月時点】Oracle Data Visualization BI Ask でコグニティブ BI を実現(スライド デモ)
by
オラクルエンジニア通信
Data Visualization Cloud Service オンライン・ハンズオンセミナー
by
Hisashi Igarashi
Oracle Data Visualization Cloud Service
by
Hisashi Igarashi
【2018年3月時点】Oracle Data Visualizaion ご紹介
by
オラクルエンジニア通信
BIがクラウドで更なる進化!データとの連携を強化したデータビジュアライゼーション(Oracle Cloud Days Tokyo 2015)
by
オラクルエンジニア通信
ハンズオンセミナー:Answer編(非定型分析) ご説明資料
by
Hisashi Igarashi
Oracle Data Minerハンズオンセミナー170927:③Business Analytics概要と事例
by
オラクルエンジニア通信
【2017年5月時点】セルフサービスBIからエンタープライズまで展開できるOracle Business Analytics クラウドプラットフォームのご紹介
by
オラクルエンジニア通信
Oracle Data Minerハンズオンセミナー170927:②Oracle data minerハンズオン資料
by
オラクルエンジニア通信
APEX Workshop III 日本語版
by
Nakakoshi Yuji
20190426 maenaka share
by
Mai Nagahisa
データ・ビジュアライゼーションによる新しい気づきとは
by
Hisashi Igarashi
[Modern Cloud Day Tokyo 2019] 【ビジネスをさらに加速させる!!】Oracle Cloud を活用したデータドリブン ユースケ...
by
オラクルエンジニア通信
【2017年4月時点】Oracle Essbase 概要
by
オラクルエンジニア通信
[Oracle Innovation Summit Tokyo 2018] 水環境の持続を支えるクラウド型ICTプラットフォーム「Water Busine...
by
オラクルエンジニア通信
【2016年10月時点】Oracle Data Visualization BI Ask でコグニティブ BI を実現(スライド デモ)
by
オラクルエンジニア通信
More from オラクルエンジニア通信
PDF
Oracle Cloud Infrastructure:2023年5月度サービス・アップデート
by
オラクルエンジニア通信
PDF
Oracle Cloud Infrastructure:2023年4月度サービス・アップデート
by
オラクルエンジニア通信
PDF
Oracle Cloud Infrastructure:2023年3月度サービス・アップデート
by
オラクルエンジニア通信
PDF
Oracle Cloud Infrastructure:2023年2月度サービス・アップデート
by
オラクルエンジニア通信
PDF
Oracle Cloud Infrastructure:2023年1月度サービス・アップデート
by
オラクルエンジニア通信
PDF
Oracle Cloud Infrastructure:2022年12月度サービス・アップデート
by
オラクルエンジニア通信
PDF
Oracle Cloud Infrastructure:2022年11月度サービス・アップデート
by
オラクルエンジニア通信
PDF
Oracle Cloud Infrastructure:2022年10月度サービス・アップデート
by
オラクルエンジニア通信
PDF
Oracle Cloud Infrastructure:2022年9月度サービス・アップデート
by
オラクルエンジニア通信
PDF
Oracle Cloud Infrastructure:2022年8月度サービス・アップデート
by
オラクルエンジニア通信
PDF
Oracle Cloud Infrastructure:2022年7月度サービス・アップデート
by
オラクルエンジニア通信
PDF
Oracle Cloud Infrastructure:2022年6月度サービス・アップデート
by
オラクルエンジニア通信
PDF
Oracle Cloud Infrastructure:2022年5月度サービス・アップデート
by
オラクルエンジニア通信
PDF
Oracle Cloud Infrastructure:2022年4月度サービス・アップデート
by
オラクルエンジニア通信
PDF
Oracle Cloud Infrastructure データベース・クラウド:各バージョンのサポート期間 (2022年4月版)
by
オラクルエンジニア通信
PPTX
MySQL Technology Cafe #14 MySQL Shellを使ってもっと楽をしようの会
by
オラクルエンジニア通信
PDF
Oracle Cloud Infrastructure:2022年3月度サービス・アップデート
by
オラクルエンジニア通信
PPTX
Oracle Cloud Infrastructure:2022年2月度サービス・アップデート
by
オラクルエンジニア通信
PDF
Oracle Cloud Infrastructure:2022年1月度サービス・アップデート
by
オラクルエンジニア通信
PDF
Oracle Databaseはクラウドに移行するべきか否か 全10ケースをご紹介 (Oracle Cloudウェビナーシリーズ: 2021年11月30日)
by
オラクルエンジニア通信
Oracle Cloud Infrastructure:2023年5月度サービス・アップデート
by
オラクルエンジニア通信
Oracle Cloud Infrastructure:2023年4月度サービス・アップデート
by
オラクルエンジニア通信
Oracle Cloud Infrastructure:2023年3月度サービス・アップデート
by
オラクルエンジニア通信
Oracle Cloud Infrastructure:2023年2月度サービス・アップデート
by
オラクルエンジニア通信
Oracle Cloud Infrastructure:2023年1月度サービス・アップデート
by
オラクルエンジニア通信
Oracle Cloud Infrastructure:2022年12月度サービス・アップデート
by
オラクルエンジニア通信
Oracle Cloud Infrastructure:2022年11月度サービス・アップデート
by
オラクルエンジニア通信
Oracle Cloud Infrastructure:2022年10月度サービス・アップデート
by
オラクルエンジニア通信
Oracle Cloud Infrastructure:2022年9月度サービス・アップデート
by
オラクルエンジニア通信
Oracle Cloud Infrastructure:2022年8月度サービス・アップデート
by
オラクルエンジニア通信
Oracle Cloud Infrastructure:2022年7月度サービス・アップデート
by
オラクルエンジニア通信
Oracle Cloud Infrastructure:2022年6月度サービス・アップデート
by
オラクルエンジニア通信
Oracle Cloud Infrastructure:2022年5月度サービス・アップデート
by
オラクルエンジニア通信
Oracle Cloud Infrastructure:2022年4月度サービス・アップデート
by
オラクルエンジニア通信
Oracle Cloud Infrastructure データベース・クラウド:各バージョンのサポート期間 (2022年4月版)
by
オラクルエンジニア通信
MySQL Technology Cafe #14 MySQL Shellを使ってもっと楽をしようの会
by
オラクルエンジニア通信
Oracle Cloud Infrastructure:2022年3月度サービス・アップデート
by
オラクルエンジニア通信
Oracle Cloud Infrastructure:2022年2月度サービス・アップデート
by
オラクルエンジニア通信
Oracle Cloud Infrastructure:2022年1月度サービス・アップデート
by
オラクルエンジニア通信
Oracle Databaseはクラウドに移行するべきか否か 全10ケースをご紹介 (Oracle Cloudウェビナーシリーズ: 2021年11月30日)
by
オラクルエンジニア通信
【2016年3月時点】Data Visualization Cloud Service ハンズオン資料
1.
Copyright © 2015
Oracle and/or its affiliates. All rights reserved. | Oracle Data Visualization Cloud Service オンライン ハンズオン セミナー 日本オラクル株式会社
2.
Copyright © 2015
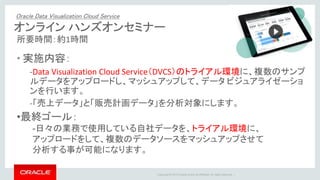
Oracle and/or its affiliates. All rights reserved. | オンライン ハンズオンセミナー 所要時間:約1時間 • 実施内容: -Data Visualization Cloud Service(DVCS)のトライアル環境に、複数のサンプ ルデータをアップロードし、マッシュアップして、データ ビジュアライゼーショ ンを行います。 -「売上データ」と「販売計画データ」を分析対象にします。 Oracle Data Visualization Cloud Service •最終ゴール: -日々の業務で使用している自社データを、トライアル環境に、 アップロードをして、複数のデータソースをマッシュアップさせて 分析する事が可能になります。
3.
Copyright © 2015
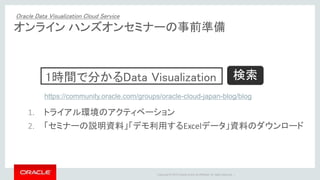
Oracle and/or its affiliates. All rights reserved. | オンライン ハンズオンセミナーの事前準備 1. トライアル環境のアクティベーション 2. 「セミナーの説明資料」「デモ利用するExcelデータ」資料のダウンロード 1時間で分かるData Visualization https://community.oracle.com/groups/oracle-cloud-japan-blog/blog 検索 Oracle Data Visualization Cloud Service
4.
Copyright © 2015
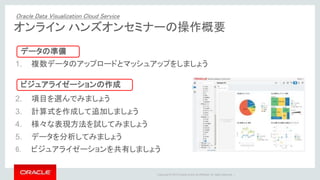
Oracle and/or its affiliates. All rights reserved. | 53 1. 複数データのアップロードとマッシュアップをしましょう 2. 項目を選んでみましょう 3. 計算式を作成して追加しましょう 4. 様々な表現方法を試してみましょう 5. データを分析してみましょう 6. ビジュアライゼーションを共有しましょう データの準備 ビジュアライゼーションの作成 オンライン ハンズオンセミナーの操作概要 Oracle Data Visualization Cloud Service
5.
Copyright © 2015
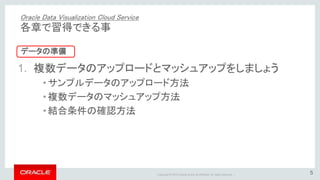
Oracle and/or its affiliates. All rights reserved. | 5 1. 複数データのアップロードとマッシュアップをしましょう • サンプルデータのアップロード方法 • 複数データのマッシュアップ方法 • 結合条件の確認方法 Oracle Data Visualization Cloud Service 各章で習得できる事 データの準備
6.
Copyright © 2015
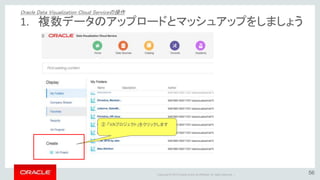
Oracle and/or its affiliates. All rights reserved. | ② 「VAプロジェクト」をクリックします 1. 複数データのアップロードとマッシュアップをしましょう Oracle Data Visualization Cloud Serviceの操作 56
7.
Copyright © 2015
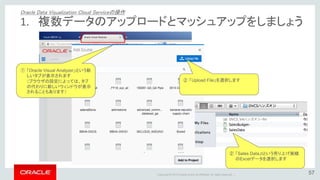
Oracle and/or its affiliates. All rights reserved. | 57 ② 「Upload File」を選択します ① 「Oracle Visual Analyzer」という新 しいタブが表示されます (ブラウザの設定によっては、タブ の代わりに新しいウィンドウが表示 されることもあります) ② 「Sales Data」tという売り上げ実績 のExcelデータを選択します 1. 複数データのアップロードとマッシュアップをしましょう Oracle Data Visualization Cloud Serviceの操作
8.
Copyright © 2015
Oracle and/or its affiliates. All rights reserved. | 57 ② 「Upload File」を選択します ① 「Oracle Visual Analyzer」という新 しいタブが表示されます (ブラウザの設定によっては、タブ の代わりに新しいウィンドウが表示 されることもあります) ② 「Sales Data」tという売り上げ実績 のExcelデータを選択します 1. 複数データのアップロードとマッシュアップをしましょう Oracle Data Visualization Cloud Serviceの操作
9.
Copyright © 2015
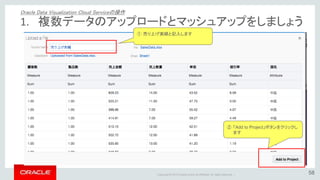
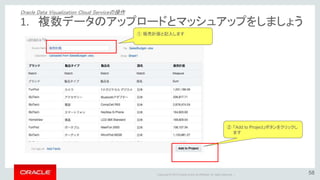
Oracle and/or its affiliates. All rights reserved. | 58 ① 売り上げ実績と記入します ② 「Add to Project」ボタンをクリックし ます 1. 複数データのアップロードとマッシュアップをしましょう Oracle Data Visualization Cloud Serviceの操作
10.
Copyright © 2015
Oracle and/or its affiliates. All rights reserved. | ① 売り上げ実績データがアップロード されました。 1. 複数データのアップロードとマッシュアップをしましょう Oracle Data Visualization Cloud Serviceの操作
11.
Copyright © 2015
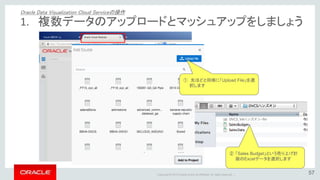
Oracle and/or its affiliates. All rights reserved. | 57 ① 先ほどと同様に「Upload File」を選 択します ② 「Sales Budget」という売り上げ計 画のExcelデータを選択します 1. 複数データのアップロードとマッシュアップをしましょう Oracle Data Visualization Cloud Serviceの操作
12.
Copyright © 2015
Oracle and/or its affiliates. All rights reserved. | 58 ① 販売計画と記入します ② 「Add to Project」ボタンをクリックし ます 1. 複数データのアップロードとマッシュアップをしましょう Oracle Data Visualization Cloud Serviceの操作
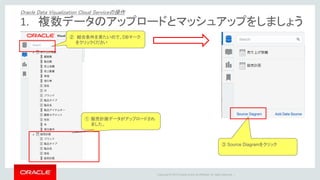
13.
Copyright © 2015
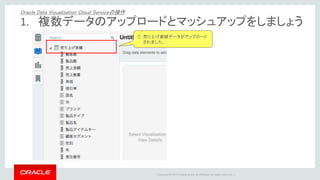
Oracle and/or its affiliates. All rights reserved. | ① 販売計画データがアップロードされ ました。 ② 結合条件を見たいので、DBマーク をクリックください ③ Source Diagramをクリック 1. 複数データのアップロードとマッシュアップをしましょう Oracle Data Visualization Cloud Serviceの操作
14.
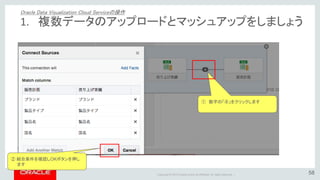
Copyright © 2015
Oracle and/or its affiliates. All rights reserved. | 58 ② 結合条件を確認しOKボタンを押し ます ① 数字の「④」をクリックします 1. 複数データのアップロードとマッシュアップをしましょう Oracle Data Visualization Cloud Serviceの操作
15.
Copyright © 2015
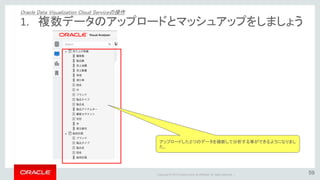
Oracle and/or its affiliates. All rights reserved. | 59 アップロードした2つのデータを横断して分析する事ができるようになりまし た。 1. 複数データのアップロードとマッシュアップをしましょう Oracle Data Visualization Cloud Serviceの操作
16.
Copyright © 2015
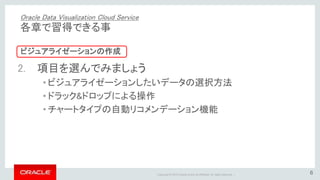
Oracle and/or its affiliates. All rights reserved. | 16 2. 項目を選んでみましょう • ビジュアライゼーションしたいデータの選択方法 • ドラック&ドロップによる操作 • チャートタイプの自動リコメンデーション機能 Oracle Data Visualization Cloud Service 各章で習得できる事 ビジュアライゼーションの作成
17.
Copyright © 2015
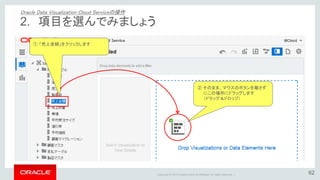
Oracle and/or its affiliates. All rights reserved. | 62 ① 「売上金額」をクリックします ② そのまま、マウスのボタンを離さず にこの場所にドラッグします (ドラッグ&ドロップ) 2. 項目を選んでみましょう Oracle Data Visualization Cloud Serviceの操作
18.
Copyright © 2015
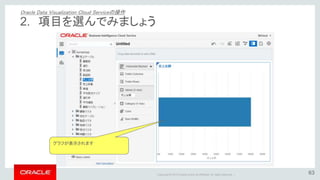
Oracle and/or its affiliates. All rights reserved. | グラフが表示されます 63 2. 項目を選んでみましょう Oracle Data Visualization Cloud Serviceの操作
19.
Copyright © 2015
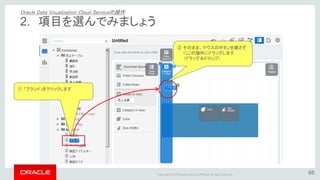
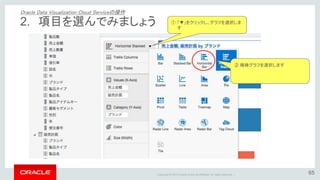
Oracle and/or its affiliates. All rights reserved. | 65 ① 「ブランド」をクリックします ② そのまま、マウスのボタンを離さず にこの場所にドラッグします (ドラッグ&ドロップ) 2. 項目を選んでみましょう Oracle Data Visualization Cloud Serviceの操作
20.
Copyright © 2015
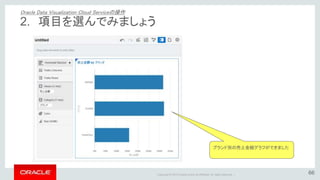
Oracle and/or its affiliates. All rights reserved. | 66 ブランド別の売上金額グラフができました 2. 項目を選んでみましょう Oracle Data Visualization Cloud Serviceの操作
21.
Copyright © 2015
Oracle and/or its affiliates. All rights reserved. | 65 ① 「販売計画」をクリックします ② そのまま、マウスのボタンを離さず にこの場所にドラッグします (ドラッグ&ドロップ) 2. 項目を選んでみましょう Oracle Data Visualization Cloud Serviceの操作
22.
Copyright © 2015
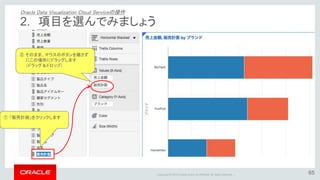
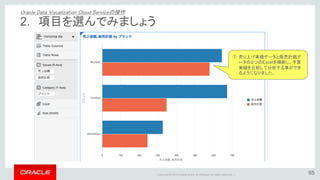
Oracle and/or its affiliates. All rights reserved. | 65 ① 「▼」をクリックし、グラフを選択しま す ② 横棒グラフを選択します 2. 項目を選んでみましょう Oracle Data Visualization Cloud Serviceの操作
23.
Copyright © 2015
Oracle and/or its affiliates. All rights reserved. | 65 ① 売り上げ実績データと販売計画デ ータの2つのExcelを横断し、予算 実績を比較して分析する事ができ るようになりました。 2. 項目を選んでみましょう Oracle Data Visualization Cloud Serviceの操作
24.
Copyright © 2015
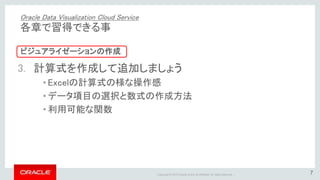
Oracle and/or its affiliates. All rights reserved. | 24 3. 計算式を作成して追加しましょう • Excelの計算式の様な操作感 • データ項目の選択と数式の作成方法 • 利用可能な関数 Oracle Data Visualization Cloud Service 各章で習得できる事 ビジュアライゼーションの作成
25.
Copyright © 2015
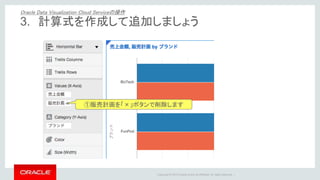
Oracle and/or its affiliates. All rights reserved. | ①販売計画を「×」ボタンで削除します 3. 計算式を作成して追加しましょう Oracle Data Visualization Cloud Serviceの操作
26.
Copyright © 2015
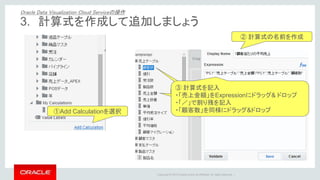
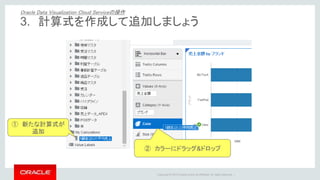
Oracle and/or its affiliates. All rights reserved. | ①Add Calculationを選択 ② 計算式の名前を作成 ③ 売上金額をExpressionにドラッグ& ドロップ ③ 計算式を記入 ・「売上金額」をExpressionにドラッグ& ドロップ ・「/」で割り残を記入 ・「顧客数」を同様にドラッグ&ドロップ 3. 計算式を作成して追加しましょう Oracle Data Visualization Cloud Serviceの操作
27.
Copyright © 2015
Oracle and/or its affiliates. All rights reserved. | ① 新たな計算式が 追加 ② カラーにドラッグ&ドロップ 3. 計算式を作成して追加しましょう Oracle Data Visualization Cloud Serviceの操作
28.
Copyright © 2015
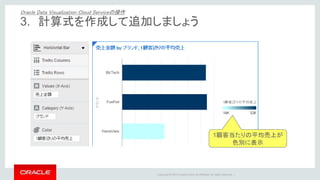
Oracle and/or its affiliates. All rights reserved. | 1顧客当たりの平均売上が 色別に表示 3. 計算式を作成して追加しましょう Oracle Data Visualization Cloud Serviceの操作
29.
Copyright © 2015
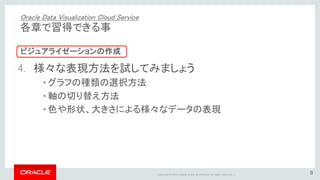
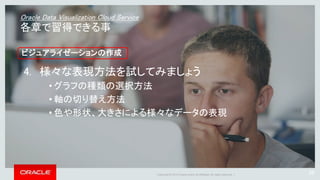
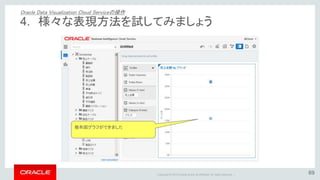
Oracle and/or its affiliates. All rights reserved. | 29 4. 様々な表現方法を試してみましょう • グラフの種類の選択方法 • 軸の切り替え方法 • 色や形状、大きさによる様々なデータの表現 Oracle Data Visualization Cloud Service 各章で習得できる事 ビジュアライゼーションの作成
30.
Copyright © 2015
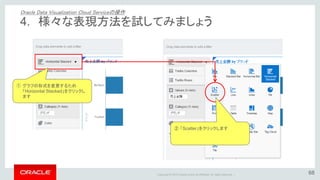
Oracle and/or its affiliates. All rights reserved. | 68 ① グラフの形式を変更するため 「Horizontal Stacked」をクリックし ます ② 「Scatter」をクリックします 4. 様々な表現方法を試してみましょう Oracle Data Visualization Cloud Serviceの操作
31.
Copyright © 2015
Oracle and/or its affiliates. All rights reserved. | 69 散布図グラフができました 4. 様々な表現方法を試してみましょう Oracle Data Visualization Cloud Serviceの操作
32.
Copyright © 2015
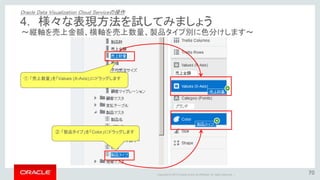
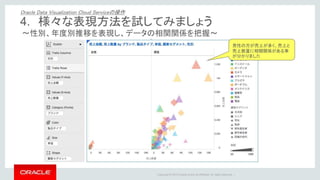
Oracle and/or its affiliates. All rights reserved. | ~縦軸を売上金額、横軸を売上数量、製品タイプ別に色分けします~ 70 ① 「売上数量」を「Values (X-Axis)」にドラッグします ② 「製品タイプ」を「Color」にドラッグします 4. 様々な表現方法を試してみましょう Oracle Data Visualization Cloud Serviceの操作
33.
Copyright © 2015
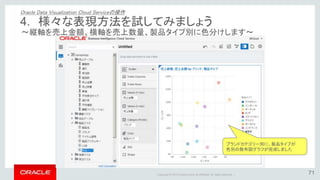
Oracle and/or its affiliates. All rights reserved. | 71 ブランドカテゴリー別に、製品タイプが 色別の散布図グラフが完成しました 4. 様々な表現方法を試してみましょう Oracle Data Visualization Cloud Serviceの操作 ~縦軸を売上金額、横軸を売上数量、製品タイプ別に色分けします~
34.
Copyright © 2015
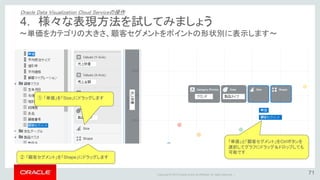
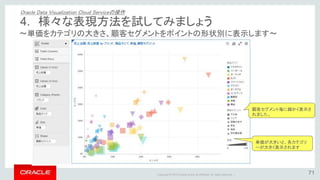
Oracle and/or its affiliates. All rights reserved. | 71 「単価」と「顧客セグメント」をCtrlボタンを 選択してグラフにドラッグ&ドロップしても 可能です ① 「単価」を「Size」にドラッグします ② 「顧客セグメント」を「Shape」にドラッグします ~単価をカテゴリの大きさ、顧客セグメントをポイントの形状別に表示します~ 4. 様々な表現方法を試してみましょう Oracle Data Visualization Cloud Serviceの操作
35.
Copyright © 2015
Oracle and/or its affiliates. All rights reserved. | 71 顧客セグメント毎に細かく表示さ れました。 単価が大きいと、各カテゴリ ーが大きく表示されます 4. 様々な表現方法を試してみましょう Oracle Data Visualization Cloud Serviceの操作 ~単価をカテゴリの大きさ、顧客セグメントをポイントの形状別に表示します~
36.
Copyright © 2015
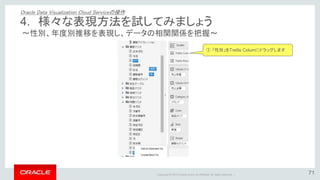
Oracle and/or its affiliates. All rights reserved. | 71 ① 「性別」をTrellis Columにドラッグします ~性別、年度別推移を表現し、データの相関関係を把握~ 4. 様々な表現方法を試してみましょう Oracle Data Visualization Cloud Serviceの操作
37.
Copyright © 2015
Oracle and/or its affiliates. All rights reserved. | 男性の方が売上が多く、売上と 売上数量に相関関係がある事 が分かりました 4. 様々な表現方法を試してみましょう Oracle Data Visualization Cloud Serviceの操作 ~性別、年度別推移を表現し、データの相関関係を把握~
38.
Copyright © 2015
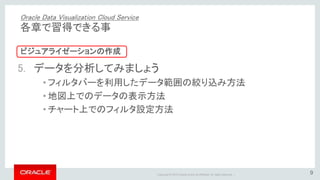
Oracle and/or its affiliates. All rights reserved. | 38 5. データを分析してみましょう • フィルタバーを利用したデータ範囲の絞り込み方法 • 地図上でのデータの表示方法 • チャート上でのフィルタ設定方法 Oracle Data Visualization Cloud Service 各章で習得できる事 ビジュアライゼーションの作成
39.
Copyright © 2015
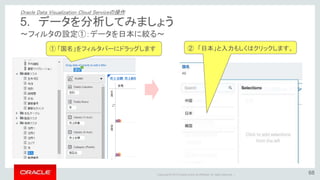
Oracle and/or its affiliates. All rights reserved. | ~フィルタの設定①:データを日本に絞る~ 68 ① 「国名」をフィルタバーにドラッグします ② 「日本」と入力もしくはクリックします。 5. データを分析してみましょう Oracle Data Visualization Cloud Serviceの操作
40.
Copyright © 2015
Oracle and/or its affiliates. All rights reserved. | ~フィルタの設定①:データを日本のみを選択~ 「日本」のみのデータが表示されました。 5. データを分析してみましょう Oracle Data Visualization Cloud Serviceの操作
41.
Copyright © 2015
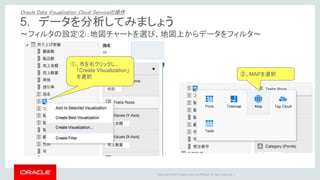
Oracle and/or its affiliates. All rights reserved. | ~フィルタの設定②:地図チャートを選び、地図上からデータをフィルタ~ ②、MAPを選択 ①、市を右クリックし、 「Create Visualization」 を選択 5. データを分析してみましょう Oracle Data Visualization Cloud Serviceの操作
42.
Copyright © 2015
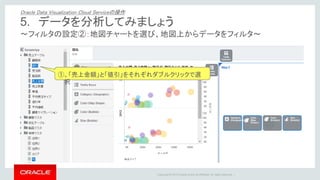
Oracle and/or its affiliates. All rights reserved. | ~フィルタの設定②:地図チャートを選び、地図上からデータをフィルタ~ ①、「売上金額」と「値引」をそれぞれダブルクリックで選 択 5. データを分析してみましょう Oracle Data Visualization Cloud Serviceの操作
43.
Copyright © 2015
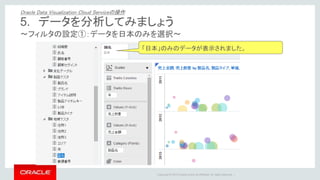
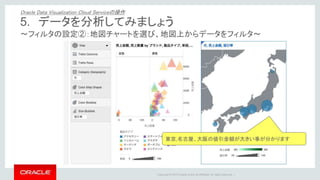
Oracle and/or its affiliates. All rights reserved. | ~フィルタの設定②:地図チャートを選び、地図上からデータをフィルタ~ 東京,名古屋、大阪の値引金額が大きい事が分かります 5. データを分析してみましょう Oracle Data Visualization Cloud Serviceの操作
44.
Copyright © 2015
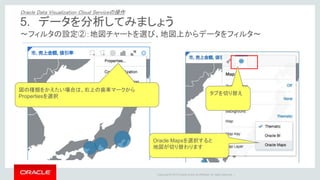
Oracle and/or its affiliates. All rights reserved. | ~フィルタの設定②:地図チャートを選び、地図上からデータをフィルタ~ 図の種類をかえたい場合は、右上の歯車マークから Propertiesを選択 タブを切り替え Oracle Mapsを選択すると 地図が切り替わります 5. データを分析してみましょう Oracle Data Visualization Cloud Serviceの操作
45.
Copyright © 2015
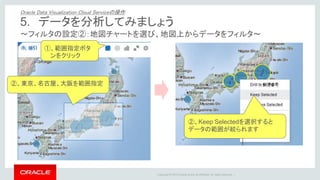
Oracle and/or its affiliates. All rights reserved. | ~フィルタの設定②:地図チャートを選び、地図上からデータをフィルタ~ ②、東京、名古屋、大阪を範囲指定 ①、範囲指定ボタ ンをクリック ②、Keep Selectedを選択すると データの範囲が絞られます 5. データを分析してみましょう Oracle Data Visualization Cloud Serviceの操作
46.
Copyright © 2015
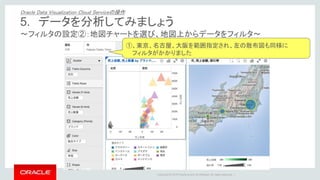
Oracle and/or its affiliates. All rights reserved. | ~フィルタの設定②:地図チャートを選び、地図上からデータをフィルタ~ ①、東京、名古屋、大阪を範囲指定され、左の散布図も同様に フィルタがかかりました 5. データを分析してみましょう Oracle Data Visualization Cloud Serviceの操作
47.
Copyright © 2015
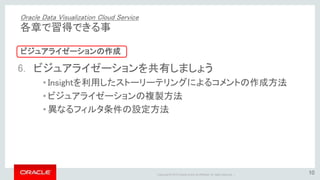
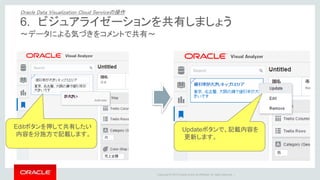
Oracle and/or its affiliates. All rights reserved. | 47 6. ビジュアライゼーションを共有しましょう • Insightを利用したストーリーテリングによるコメントの作成方法 • ビジュアライゼーションの複製方法 • 異なるフィルタ条件の設定方法 Oracle Data Visualization Cloud Service 各章で習得できる事 ビジュアライゼーションの作成
48.
Copyright © 2015
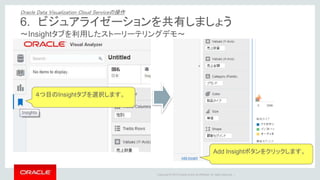
Oracle and/or its affiliates. All rights reserved. | ~Insightタブを利用したストーリーテリングデモ~ 4つ目のInsightタブを選択します。 Add Insightボタンをクリックします。 6. ビジュアライゼーションを共有しましょう Oracle Data Visualization Cloud Serviceの操作
49.
Copyright © 2015
Oracle and/or its affiliates. All rights reserved. | ~データによる気づきをコメントで共有~ Editボタンを押して共有したい 内容を分施方で記載します。 Updateボタンで、記載内容を 更新します。 6. ビジュアライゼーションを共有しましょう Oracle Data Visualization Cloud Serviceの操作
50.
Copyright © 2015
Oracle and/or its affiliates. All rights reserved. | ~新たなInsightボタンの追加~ ① Add Insightボタンをクリックし ビジュアライゼーション画面を複製します。 ②新たなInsightタブ が作成されました。 ③ 売上金額を値引率の上にドラック & ドロップして軸を交換します。 6. ビジュアライゼーションを共有しましょう Oracle Data Visualization Cloud Serviceの操作
51.
Copyright © 2015
Oracle and/or its affiliates. All rights reserved. | ~異なる表示~ 売上高が大きい順に円の大きさが 表示されます 6. ビジュアライゼーションを共有しましょう Oracle Data Visualization Cloud Serviceの操作
52.
Copyright © 2015
Oracle and/or its affiliates. All rights reserved. | ~フィルタ条件の変更と新たなInsightの保存~ フィルタバーから『市』の選択条件を Remove Filterボタンで排除します 先程と同様に売上高に関してのコメントを 記載しupdateをクリックします。 6. ビジュアライゼーションを共有しましょう Oracle Data Visualization Cloud Serviceの操作
53.
Copyright © 2015
Oracle and/or its affiliates. All rights reserved. | ~様々な視点によるシナリオの共有~ 値引率別と売上別のランキングをそれぞれのInsightで コメントを記載し異なるフィルタ条件で保存し共有します。 6. ビジュアライゼーションを共有しましょう Oracle Data Visualization Cloud Serviceの操作
54.
Copyright © 2015
Oracle and/or its affiliates. All rights reserved. |
55.
Copyright © 2015
Oracle and/or its affiliates. All rights reserved. |
Download


![クラウドを使って競争優位なビッグデータ活用の実現へ [Oracle Cloud Days Tokyo 2016]](https://cdn.slidesharecdn.com/ss_thumbnails/20161025oracleclouddaysbigdatacloud-161122131839-thumbnail.jpg?width=640&height=640&fit=bounds)


![[Modern Cloud Day Tokyo 2019] 【ビジネスをさらに加速させる!!】Oracle Cloud を活用したデータドリブン ユースケ...](https://cdn.slidesharecdn.com/ss_thumbnails/mcd19b-4-190826050527-thumbnail.jpg?width=640&height=640&fit=bounds)

![[Oracle Innovation Summit Tokyo 2018] 水環境の持続を支えるクラウド型ICTプラットフォーム「Water Busine...](https://cdn.slidesharecdn.com/ss_thumbnails/ist18a-2-180822044642-thumbnail.jpg?width=640&height=640&fit=bounds)


