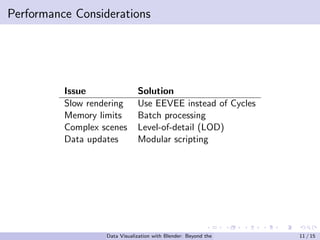
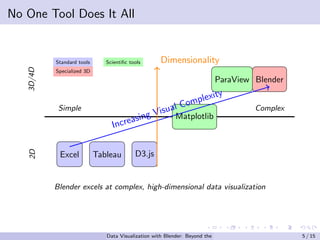
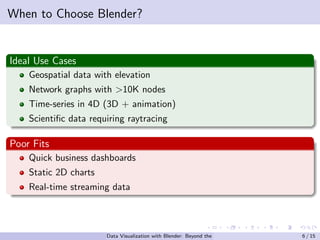
Data Visualization with Blender: Beyond the Basics
Unlocking 3D Insights Through Scripting
Data Visualization with Blender: Beyond the Basics 1 / 15
What If...?
Hook Question
”What if you could turn raw data into immersive 3D stories?”
Blender is not just for animation—it’s a data visualization powerhouse
Scripting unlocks infinite customization
Today’s goal: Show why Blender is unique for complex data
Data Visualization with Blender: Beyond the Basics 2 / 15
Why Blender for Data Visualization?
Strengths:
Native 3D rendering engine
Python API for automation
Physics simulations
VR/AR export capabilities
Photo-realistic graphics
Python tool chain
Weaknesses:
Steep learning curve
Not real-time like D3.js
Overkill for simple charts
Not as well known
Data Visualization with Blender: Beyond the Basics 3 / 15
Recommend Reading (Support Slides)
Blender Python API Documentation
Data Visualization+Blender/Scripting/Python All-In-One (Paperback)
(Kenwright)
101 Blender Scripting Projects (Paperback) (Kenwright) ISBN: 979-8290336053
101 Data Visualization and Analytics Projects (Paperback) (Kenwright) ISBN:
979-8280332539
Speak with Visualizations (Paperback) ISBN: 979-8282625813
Data Visualization with Blender: Beyond the Basics 4 / 15
No One Tool Does It All
Simple Complex
2D
3D/4D
Excel Tableau D3.js
Matplotlib
ParaView Blender
Increasing Visual Complexity
Dimensionality
Standard tools Scientific tools
Specialized 3D
Blender excels at complex, high-dimensional data visualization
Data Visualization with Blender: Beyond the Basics 5 / 15
When to Choose Blender?
Ideal Use Cases
Geospatial data with elevation
Network graphs with >10K nodes
Time-series in 4D (3D + animation)
Scientific data requiring raytracing
Poor Fits
Quick business dashboards
Static 2D charts
Real-time streaming data
Data Visualization with Blender: Beyond the Basics 6 / 15
Hello Blender Python
1 import bpy
2
3 # Create a cube at (0,0,0)
4 bpy.ops.mesh. primitive_cube_add (location =(0 ,0 ,0))
5
6 # Access the cube ’s data
7 cube = bpy.context.active_object
8
9 # Change its scale based on data
10 cube.scale = (1.0, 2.5, 0.5) # x,y,z dimensions
Data Visualization with Blender: Beyond the Basics 7 / 15
Data Flow Pipeline
Step Blender Tool
Data Cleaning Python Pandas
Geometry Generation bpy.ops.mesh
Material Assignment Shader Nodes
Animation Keyframes
Rendering Cycles/EEVEE
Data Visualization with Blender: Beyond the Basics 8 / 15
Case Study: 3D Network Graph
15,000-node social network
Node size = User influence
Edge thickness = Connection strength
Color = Community detection
Data Visualization with Blender: Beyond the Basics 9 / 15
Generating Nodes from Data
1 import networkx as nx
2
3 G = nx.read_gml("social_network .gml")
4
5 for node in G.nodes(data=True):
6 x, y, z = node [1][ ’position ’]
7 bpy.ops.mesh. primitive_sphere_add (
8 radius=node [1][ ’influence ’]*0.1 ,
9 location =(x, y, z)
10 )
Data Visualization with Blender: Beyond the Basics 10 / 15
Performance Considerations
Issue Solution
Slow rendering Use EEVEE instead of Cycles
Memory limits Batch processing
Complex scenes Level-of-detail (LOD)
Data updates Modular scripting
Data Visualization with Blender: Beyond the Basics 11 / 15
Debugging Tips
1 Use print() statements liberally
2 Check Blender’s System Console
3 Isolate components with collections
4 Version control your .blend files
Data Visualization with Blender: Beyond the Basics 12 / 15
Questions to Ponder
How would you visualize live sensor data in Blender?
What datasets in your field need 3D representation?
When is Blender not the right choice?
Data Visualization with Blender: Beyond the Basics 13 / 15
Final Thoughts
”Data visualization is storytelling with evidence”
Blender provides the tools to tell richer, more immersive data stories
Data Visualization with Blender: Beyond the Basics 14 / 15
Resources
Blender Python API Documentation
Data Visualization+Blender/Scripting/Python All-In-One (Paperback)
(Kenwright)
101 Blender Scripting Projects (Paperback) (Kenwright) ISBN: 979-8290336053
101 Data Visualization and Analytics Projects (Paperback) (Kenwright) ISBN:
979-8280332539
Speak with Visualizations (Paperback) ISBN: 979-8282625813
Thank You!
Data Visualization with Blender: Beyond the Basics 15 / 15

Data Visualization Blender Scripting - Complexity, Data Dimensions and Extended Reality

  • 1.
    Data Visualization withBlender: Beyond the Basics Unlocking 3D Insights Through Scripting Data Visualization with Blender: Beyond the Basics 1 / 15
  • 2.
    What If...? Hook Question ”Whatif you could turn raw data into immersive 3D stories?” Blender is not just for animation—it’s a data visualization powerhouse Scripting unlocks infinite customization Today’s goal: Show why Blender is unique for complex data Data Visualization with Blender: Beyond the Basics 2 / 15
  • 3.
    Why Blender forData Visualization? Strengths: Native 3D rendering engine Python API for automation Physics simulations VR/AR export capabilities Photo-realistic graphics Python tool chain Weaknesses: Steep learning curve Not real-time like D3.js Overkill for simple charts Not as well known Data Visualization with Blender: Beyond the Basics 3 / 15
  • 4.
    Recommend Reading (SupportSlides) Blender Python API Documentation Data Visualization+Blender/Scripting/Python All-In-One (Paperback) (Kenwright) 101 Blender Scripting Projects (Paperback) (Kenwright) ISBN: 979-8290336053 101 Data Visualization and Analytics Projects (Paperback) (Kenwright) ISBN: 979-8280332539 Speak with Visualizations (Paperback) ISBN: 979-8282625813 Data Visualization with Blender: Beyond the Basics 4 / 15
  • 5.
    No One ToolDoes It All Simple Complex 2D 3D/4D Excel Tableau D3.js Matplotlib ParaView Blender Increasing Visual Complexity Dimensionality Standard tools Scientific tools Specialized 3D Blender excels at complex, high-dimensional data visualization Data Visualization with Blender: Beyond the Basics 5 / 15
  • 6.
    When to ChooseBlender? Ideal Use Cases Geospatial data with elevation Network graphs with >10K nodes Time-series in 4D (3D + animation) Scientific data requiring raytracing Poor Fits Quick business dashboards Static 2D charts Real-time streaming data Data Visualization with Blender: Beyond the Basics 6 / 15
  • 7.
    Hello Blender Python 1import bpy 2 3 # Create a cube at (0,0,0) 4 bpy.ops.mesh. primitive_cube_add (location =(0 ,0 ,0)) 5 6 # Access the cube ’s data 7 cube = bpy.context.active_object 8 9 # Change its scale based on data 10 cube.scale = (1.0, 2.5, 0.5) # x,y,z dimensions Data Visualization with Blender: Beyond the Basics 7 / 15
  • 8.
    Data Flow Pipeline StepBlender Tool Data Cleaning Python Pandas Geometry Generation bpy.ops.mesh Material Assignment Shader Nodes Animation Keyframes Rendering Cycles/EEVEE Data Visualization with Blender: Beyond the Basics 8 / 15
  • 9.
    Case Study: 3DNetwork Graph 15,000-node social network Node size = User influence Edge thickness = Connection strength Color = Community detection Data Visualization with Blender: Beyond the Basics 9 / 15
  • 10.
    Generating Nodes fromData 1 import networkx as nx 2 3 G = nx.read_gml("social_network .gml") 4 5 for node in G.nodes(data=True): 6 x, y, z = node [1][ ’position ’] 7 bpy.ops.mesh. primitive_sphere_add ( 8 radius=node [1][ ’influence ’]*0.1 , 9 location =(x, y, z) 10 ) Data Visualization with Blender: Beyond the Basics 10 / 15
  • 11.
    Performance Considerations Issue Solution Slowrendering Use EEVEE instead of Cycles Memory limits Batch processing Complex scenes Level-of-detail (LOD) Data updates Modular scripting Data Visualization with Blender: Beyond the Basics 11 / 15
  • 12.
    Debugging Tips 1 Useprint() statements liberally 2 Check Blender’s System Console 3 Isolate components with collections 4 Version control your .blend files Data Visualization with Blender: Beyond the Basics 12 / 15
  • 13.
    Questions to Ponder Howwould you visualize live sensor data in Blender? What datasets in your field need 3D representation? When is Blender not the right choice? Data Visualization with Blender: Beyond the Basics 13 / 15
  • 14.
    Final Thoughts ”Data visualizationis storytelling with evidence” Blender provides the tools to tell richer, more immersive data stories Data Visualization with Blender: Beyond the Basics 14 / 15
  • 15.
    Resources Blender Python APIDocumentation Data Visualization+Blender/Scripting/Python All-In-One (Paperback) (Kenwright) 101 Blender Scripting Projects (Paperback) (Kenwright) ISBN: 979-8290336053 101 Data Visualization and Analytics Projects (Paperback) (Kenwright) ISBN: 979-8280332539 Speak with Visualizations (Paperback) ISBN: 979-8282625813 Thank You! Data Visualization with Blender: Beyond the Basics 15 / 15