Download to read offline

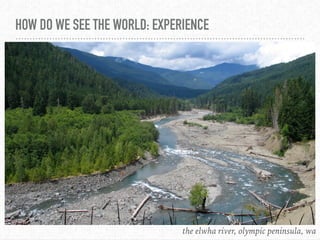
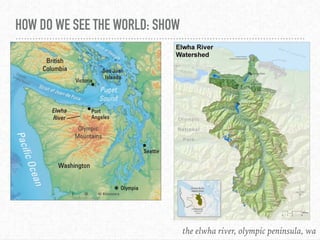
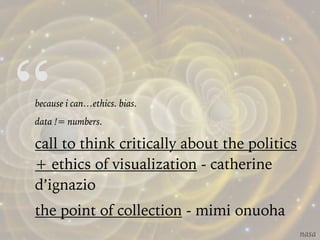
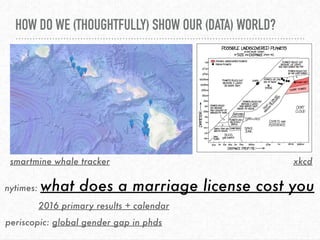
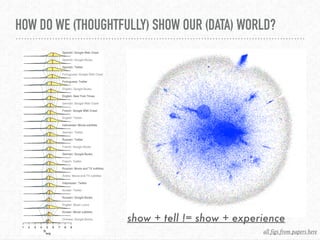
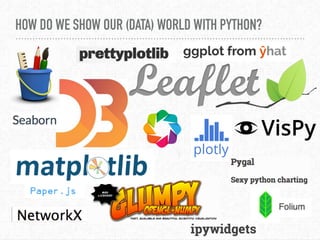
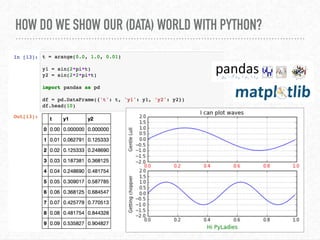
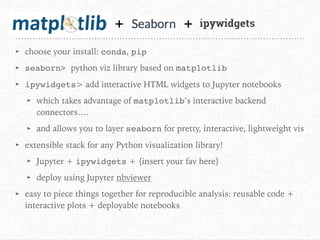
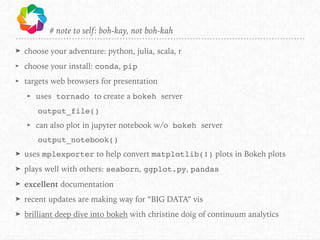
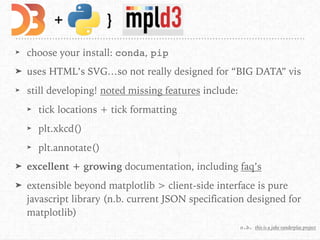

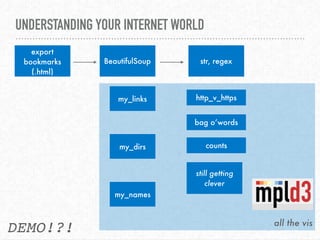
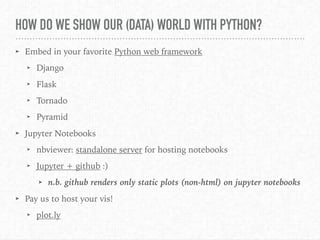
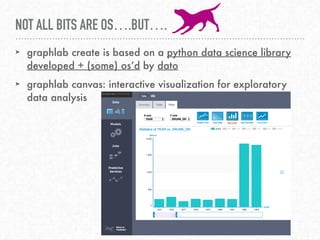


The document discusses interactive visualization techniques in Python, particularly in the context of environmental data such as the Elwha River. It emphasizes the importance of critical thinking regarding the ethics and politics of data visualization and outlines various Python libraries to create interactive plots. The speaker expresses gratitude towards the open source community and the Pyladies Seattle for their support and participation in the event.


![[Ignite 강남 2016] 조현길 경영자처럼 일할테니 경영자의 월급을 주세ᄋ...](https://cdn.slidesharecdn.com/ss_thumbnails/2-7-161027162241-thumbnail.jpg?width=640&height=640&fit=bounds)
![[Ignite 강남 2016] 차성국 아들과 함께한 국토대장정](https://cdn.slidesharecdn.com/ss_thumbnails/1-3-161027161929-thumbnail.jpg?width=640&height=640&fit=bounds)


![[DSC Europe 25] Predrag Maletic - Scaling AI in Banking – Our Strategic Journ...](https://cdn.slidesharecdn.com/ss_thumbnails/qu2onv0aruwlvqtygmxx-predrag-maletic-scaling-ai-in-banking-260123083019-6cf1da1d-thumbnail.jpg?width=640&height=640&fit=bounds)