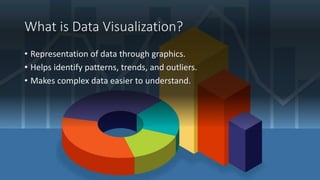
Data Visualization
Understanding the role of data visualizations
What is Data Visualization?
Flesh out the real value
Not just about seeing value in data!
Discuss examples
What is Data Visualization?
• Representation of data through graphics.
• Helps identify patterns, trends, and outliers.
• Makes complex data easier to understand.
Why is Data Visualization Important?
• Simplifies complex datasets.
• Facilitates decision making.
• Enhances communication of insights.
What are Common Types of Visualizations?
• Bar Charts
• Line Graphs
• Pie Charts
• Scatter Plots
• Heatmaps
Going Beyond: Custom Visualizations
• Tailored to specific data needs.
• Provide unique insights.
• Allow interactivity and dynamic exploration.
Why Create Custom Visualizations?
• Standard charts may not capture complex relationships.
• Showcase narratives that generic visuals can't.
• Engage users with interactive experiences.
WebGPU & Advanced Visualization
• Harness the power of GPU in the browser.
• Real-time, high-performance graphics.
• Ideal for large datasets and simulations.
Telling Stories with Custom Visuals
• Highlight the 'why' behind the numbers.
• Create immersive, exploratory environments.
• Move beyond static charts to interactive journeys.
Summary
• Visualizations simplify complex data.
• Custom visuals unlock deeper insights.
• WebGPU enables cutting-edge browser graphics.
• Storytelling is key to effective data communication.
Links & Resources
100s Interactive WebGPU Demos/Examples
https://webgpu.xbdev.net
Tutorials/articles
https://xbdev.net/internet/webgpu/

Data Visualization - Understanding the Why - The Technologies - Custom Visualization with WebGPU

  • 1.
    Data Visualization Understanding therole of data visualizations
  • 2.
    What is DataVisualization? Flesh out the real value Not just about seeing value in data! Discuss examples
  • 3.
    What is DataVisualization? • Representation of data through graphics. • Helps identify patterns, trends, and outliers. • Makes complex data easier to understand.
  • 4.
    Why is DataVisualization Important?
  • 5.
    Why is DataVisualization Important? • Simplifies complex datasets. • Facilitates decision making. • Enhances communication of insights.
  • 6.
    What are CommonTypes of Visualizations?
  • 7.
    What are CommonTypes of Visualizations? • Bar Charts • Line Graphs • Pie Charts • Scatter Plots • Heatmaps
  • 8.
    Going Beyond: CustomVisualizations • Tailored to specific data needs. • Provide unique insights. • Allow interactivity and dynamic exploration.
  • 9.
    Why Create CustomVisualizations? • Standard charts may not capture complex relationships. • Showcase narratives that generic visuals can't. • Engage users with interactive experiences.
  • 10.
    WebGPU & AdvancedVisualization • Harness the power of GPU in the browser. • Real-time, high-performance graphics. • Ideal for large datasets and simulations.
  • 11.
    Telling Stories withCustom Visuals • Highlight the 'why' behind the numbers. • Create immersive, exploratory environments. • Move beyond static charts to interactive journeys.
  • 12.
    Summary • Visualizations simplifycomplex data. • Custom visuals unlock deeper insights. • WebGPU enables cutting-edge browser graphics. • Storytelling is key to effective data communication.
  • 13.
    Links & Resources 100sInteractive WebGPU Demos/Examples https://webgpu.xbdev.net Tutorials/articles https://xbdev.net/internet/webgpu/