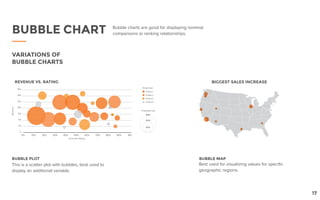
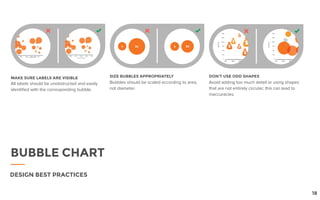
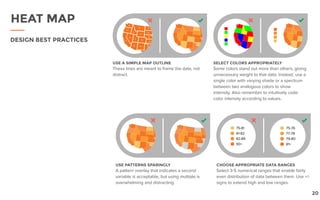
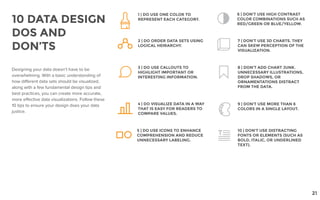
This document provides a guide to designing effective data visualizations. It discusses different types of charts and graphs such as bar charts, pie charts, line charts, area charts, scatter plots, bubble charts, and heat maps. For each type of visualization, it describes best practices for design, including proper use of colors, labels, axes, and other elements. It also provides dos and don'ts for design, such as using one color per category and avoiding distracting elements. The overall document aims to help readers understand how to choose the right visualization for their data and design it clearly and effectively.