Download as PDF, PPTX
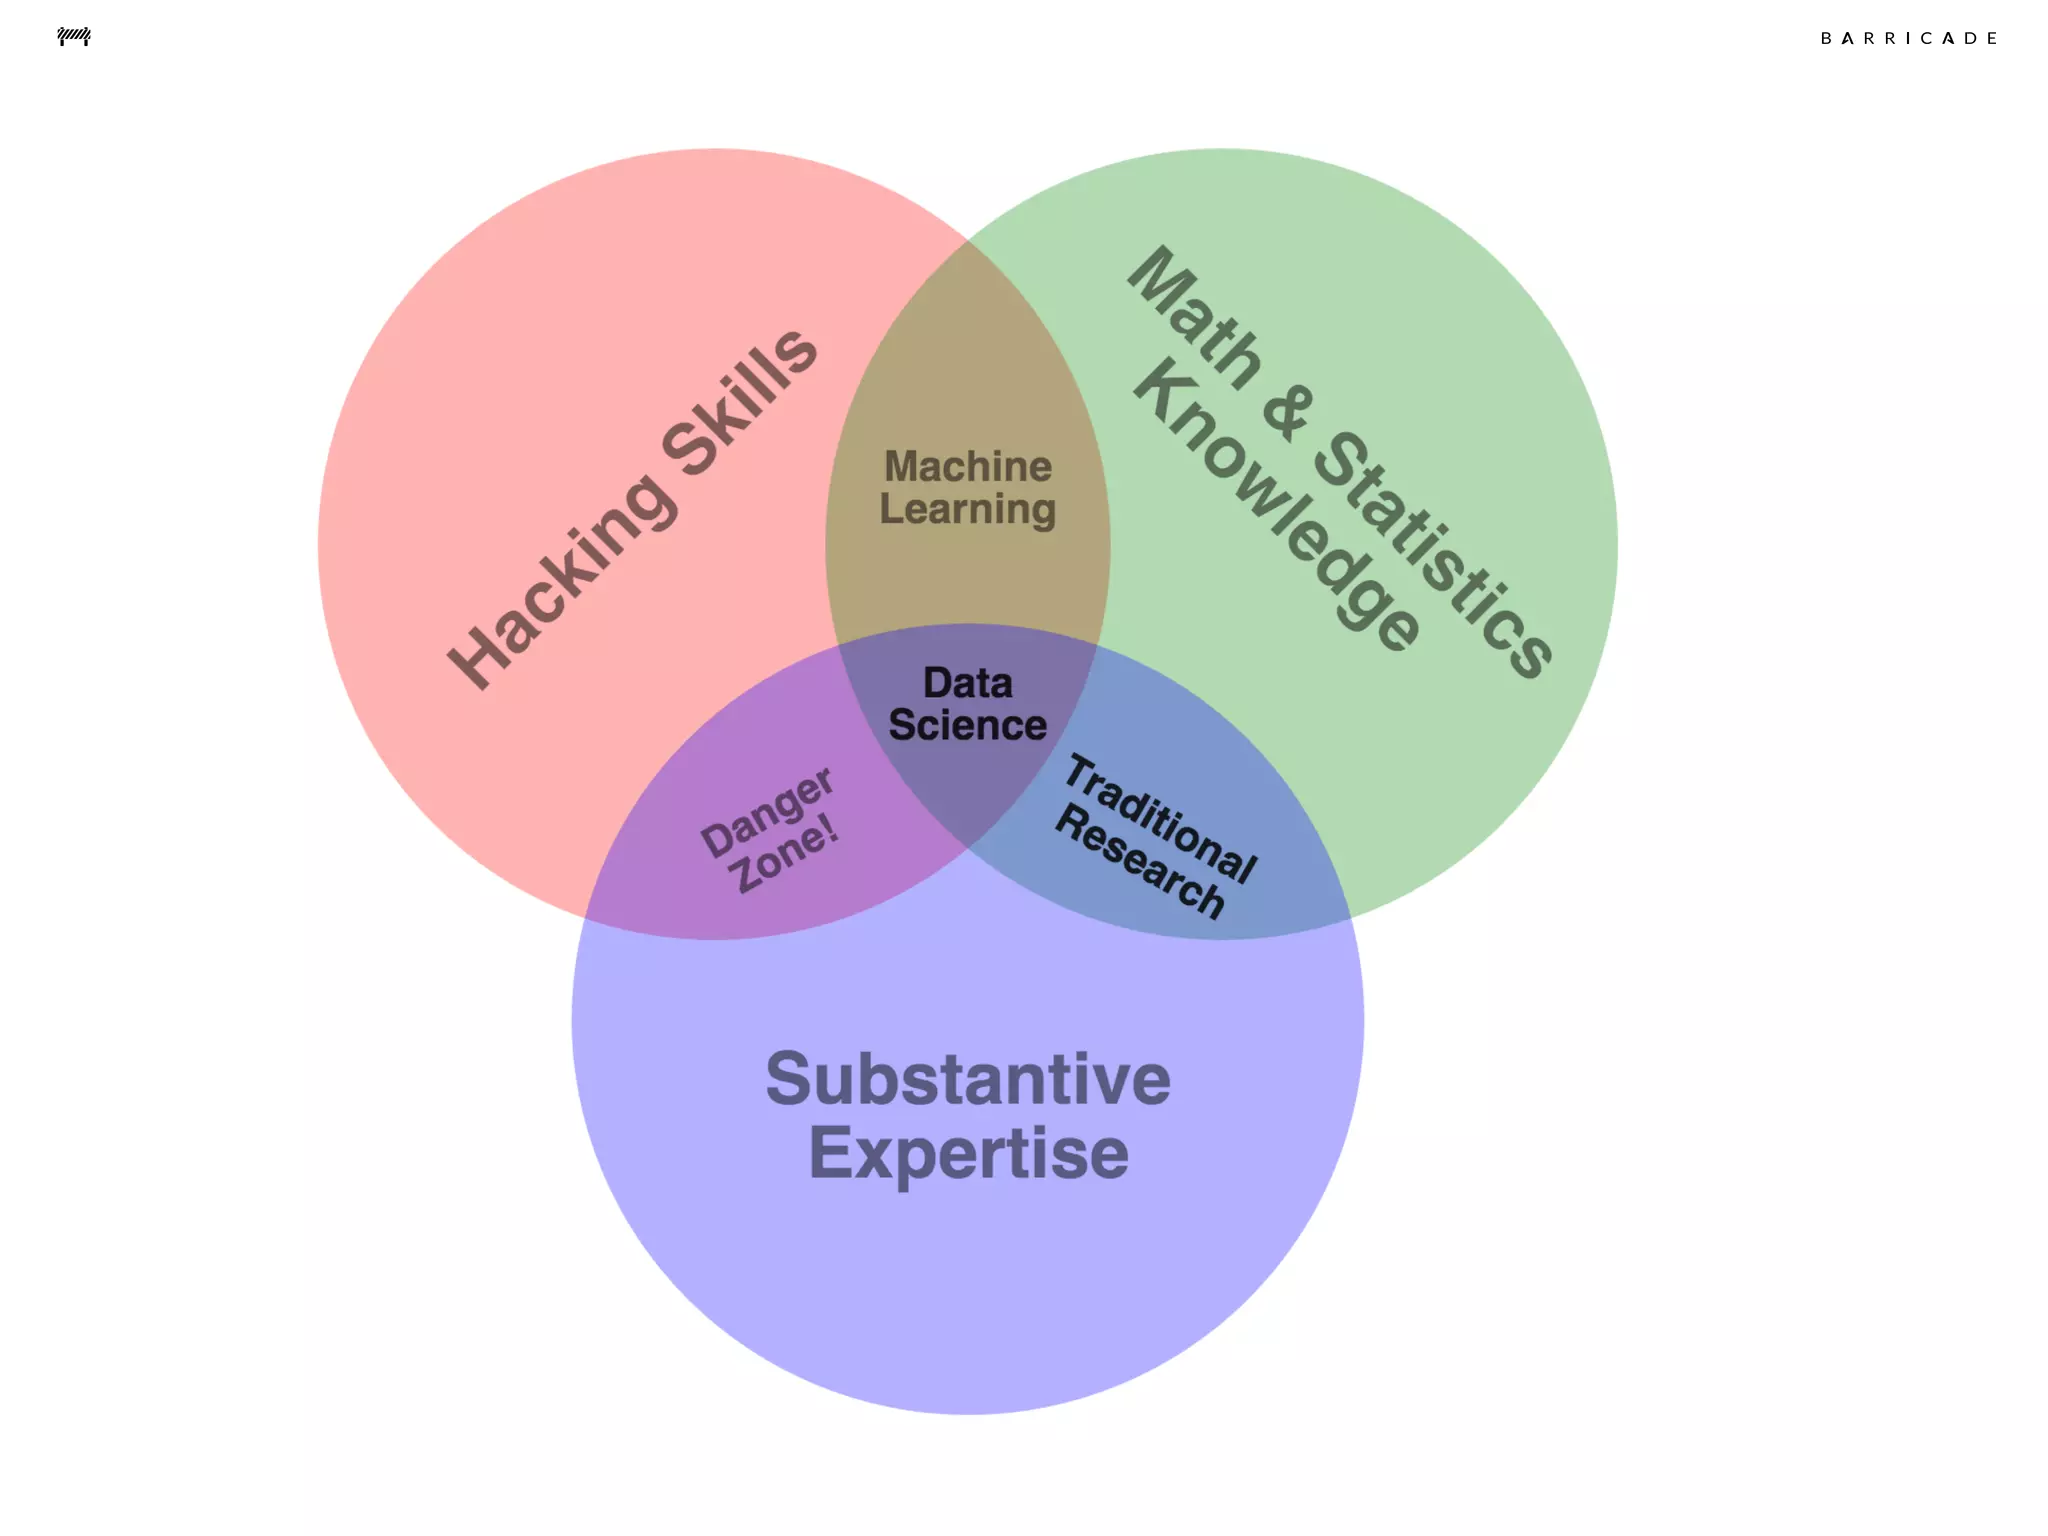


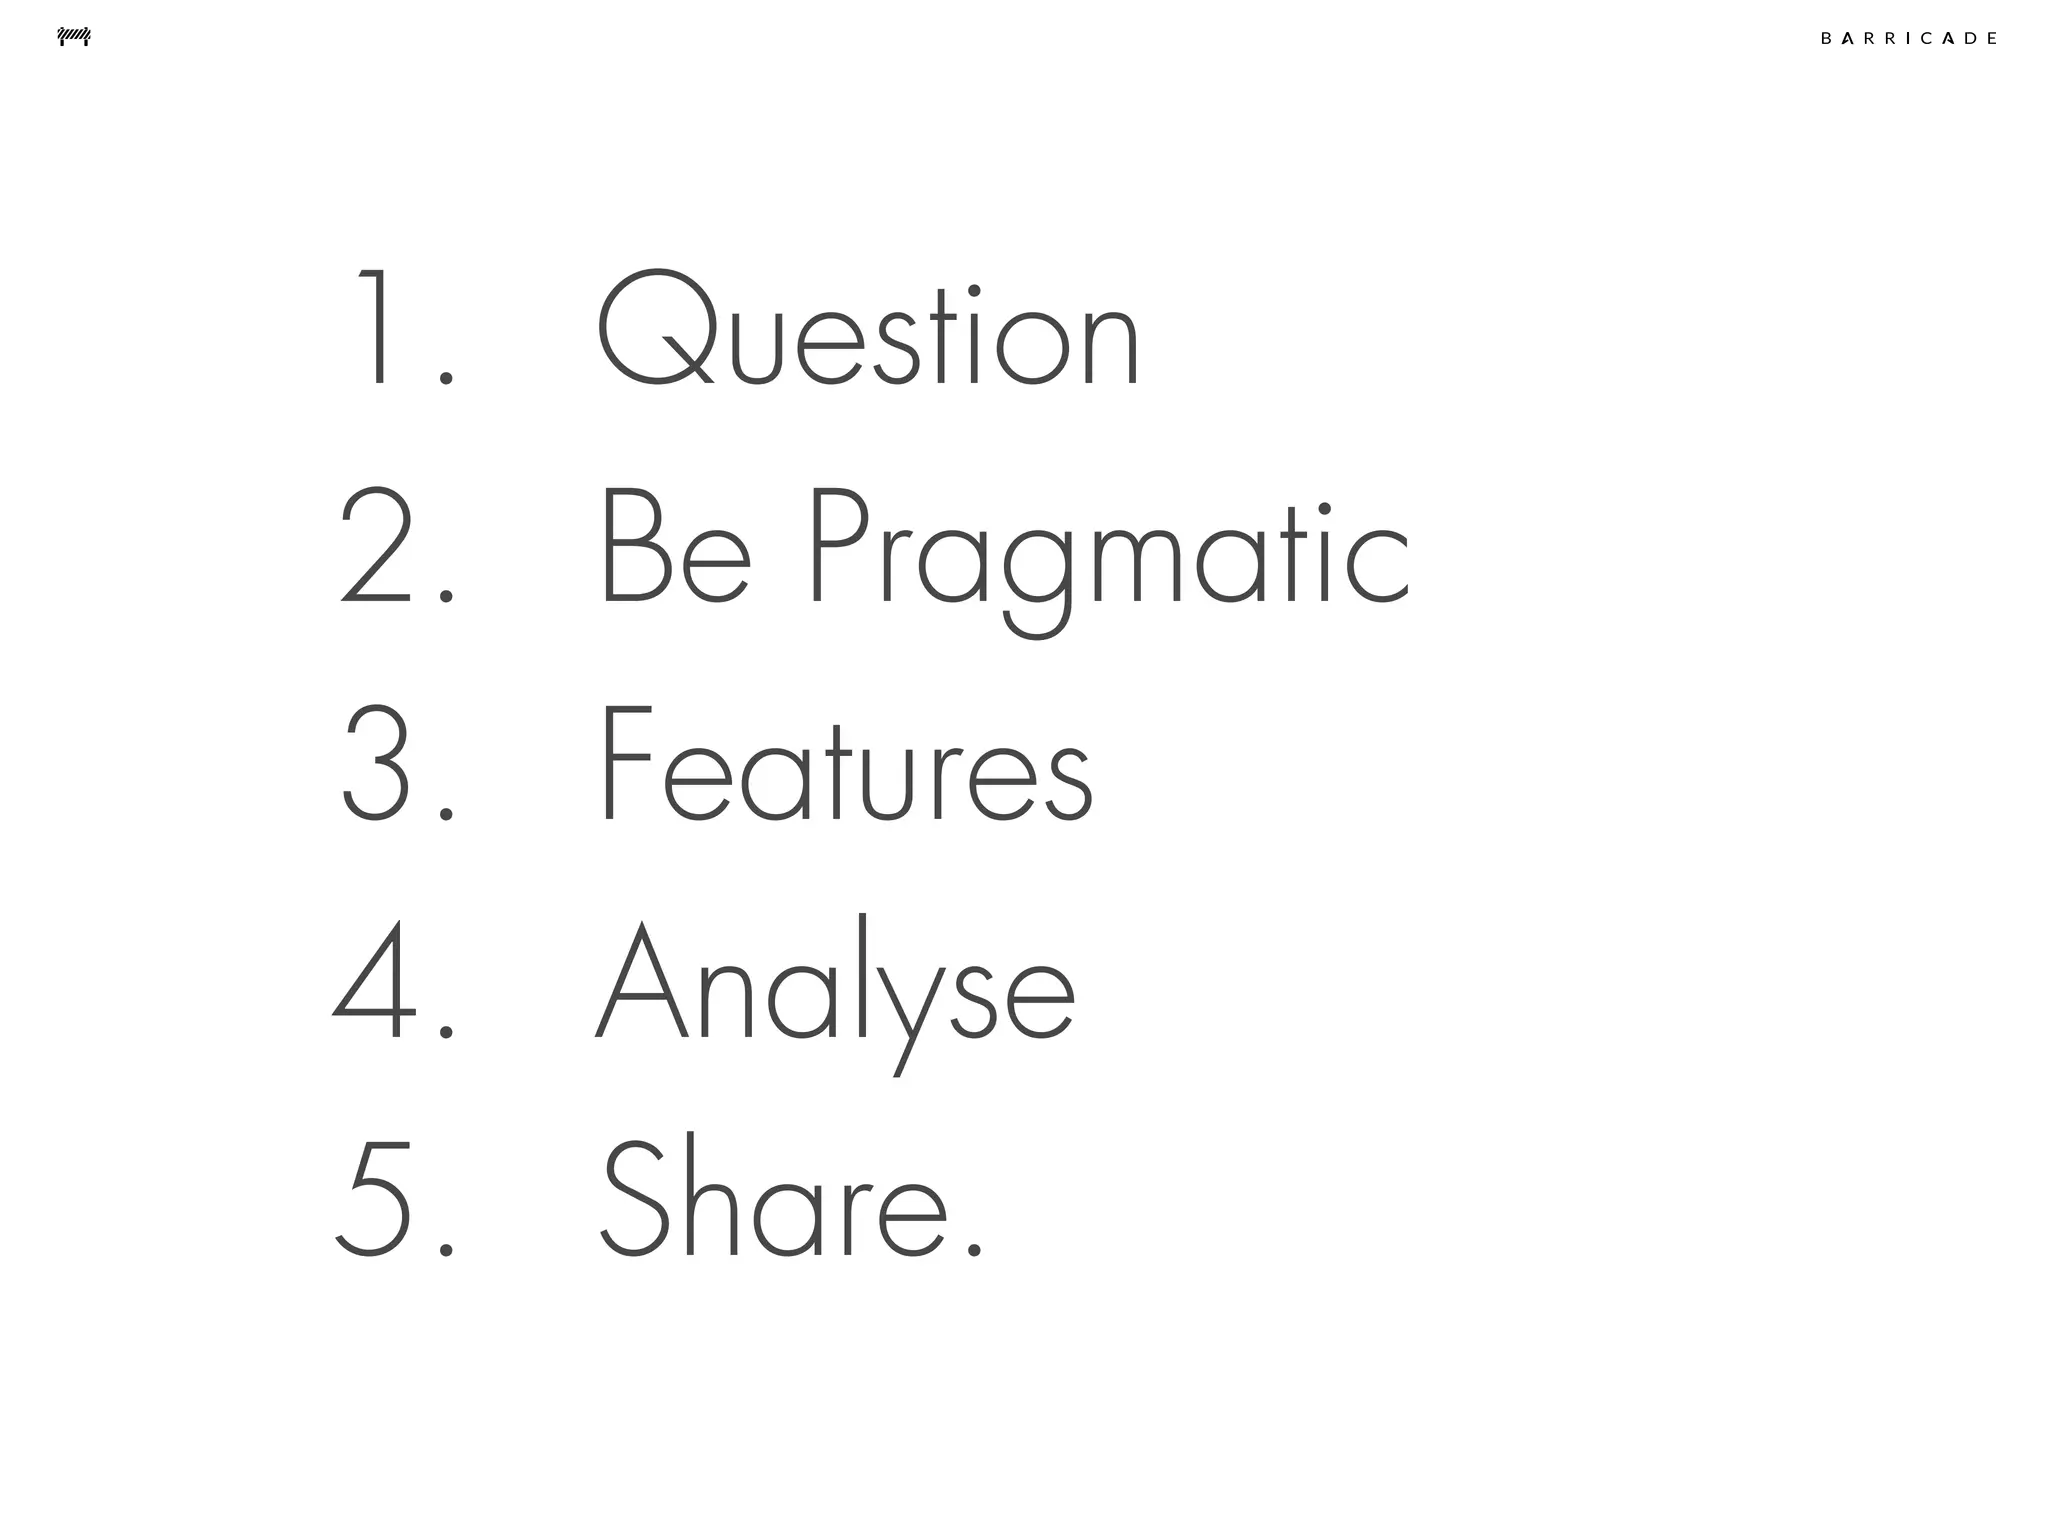


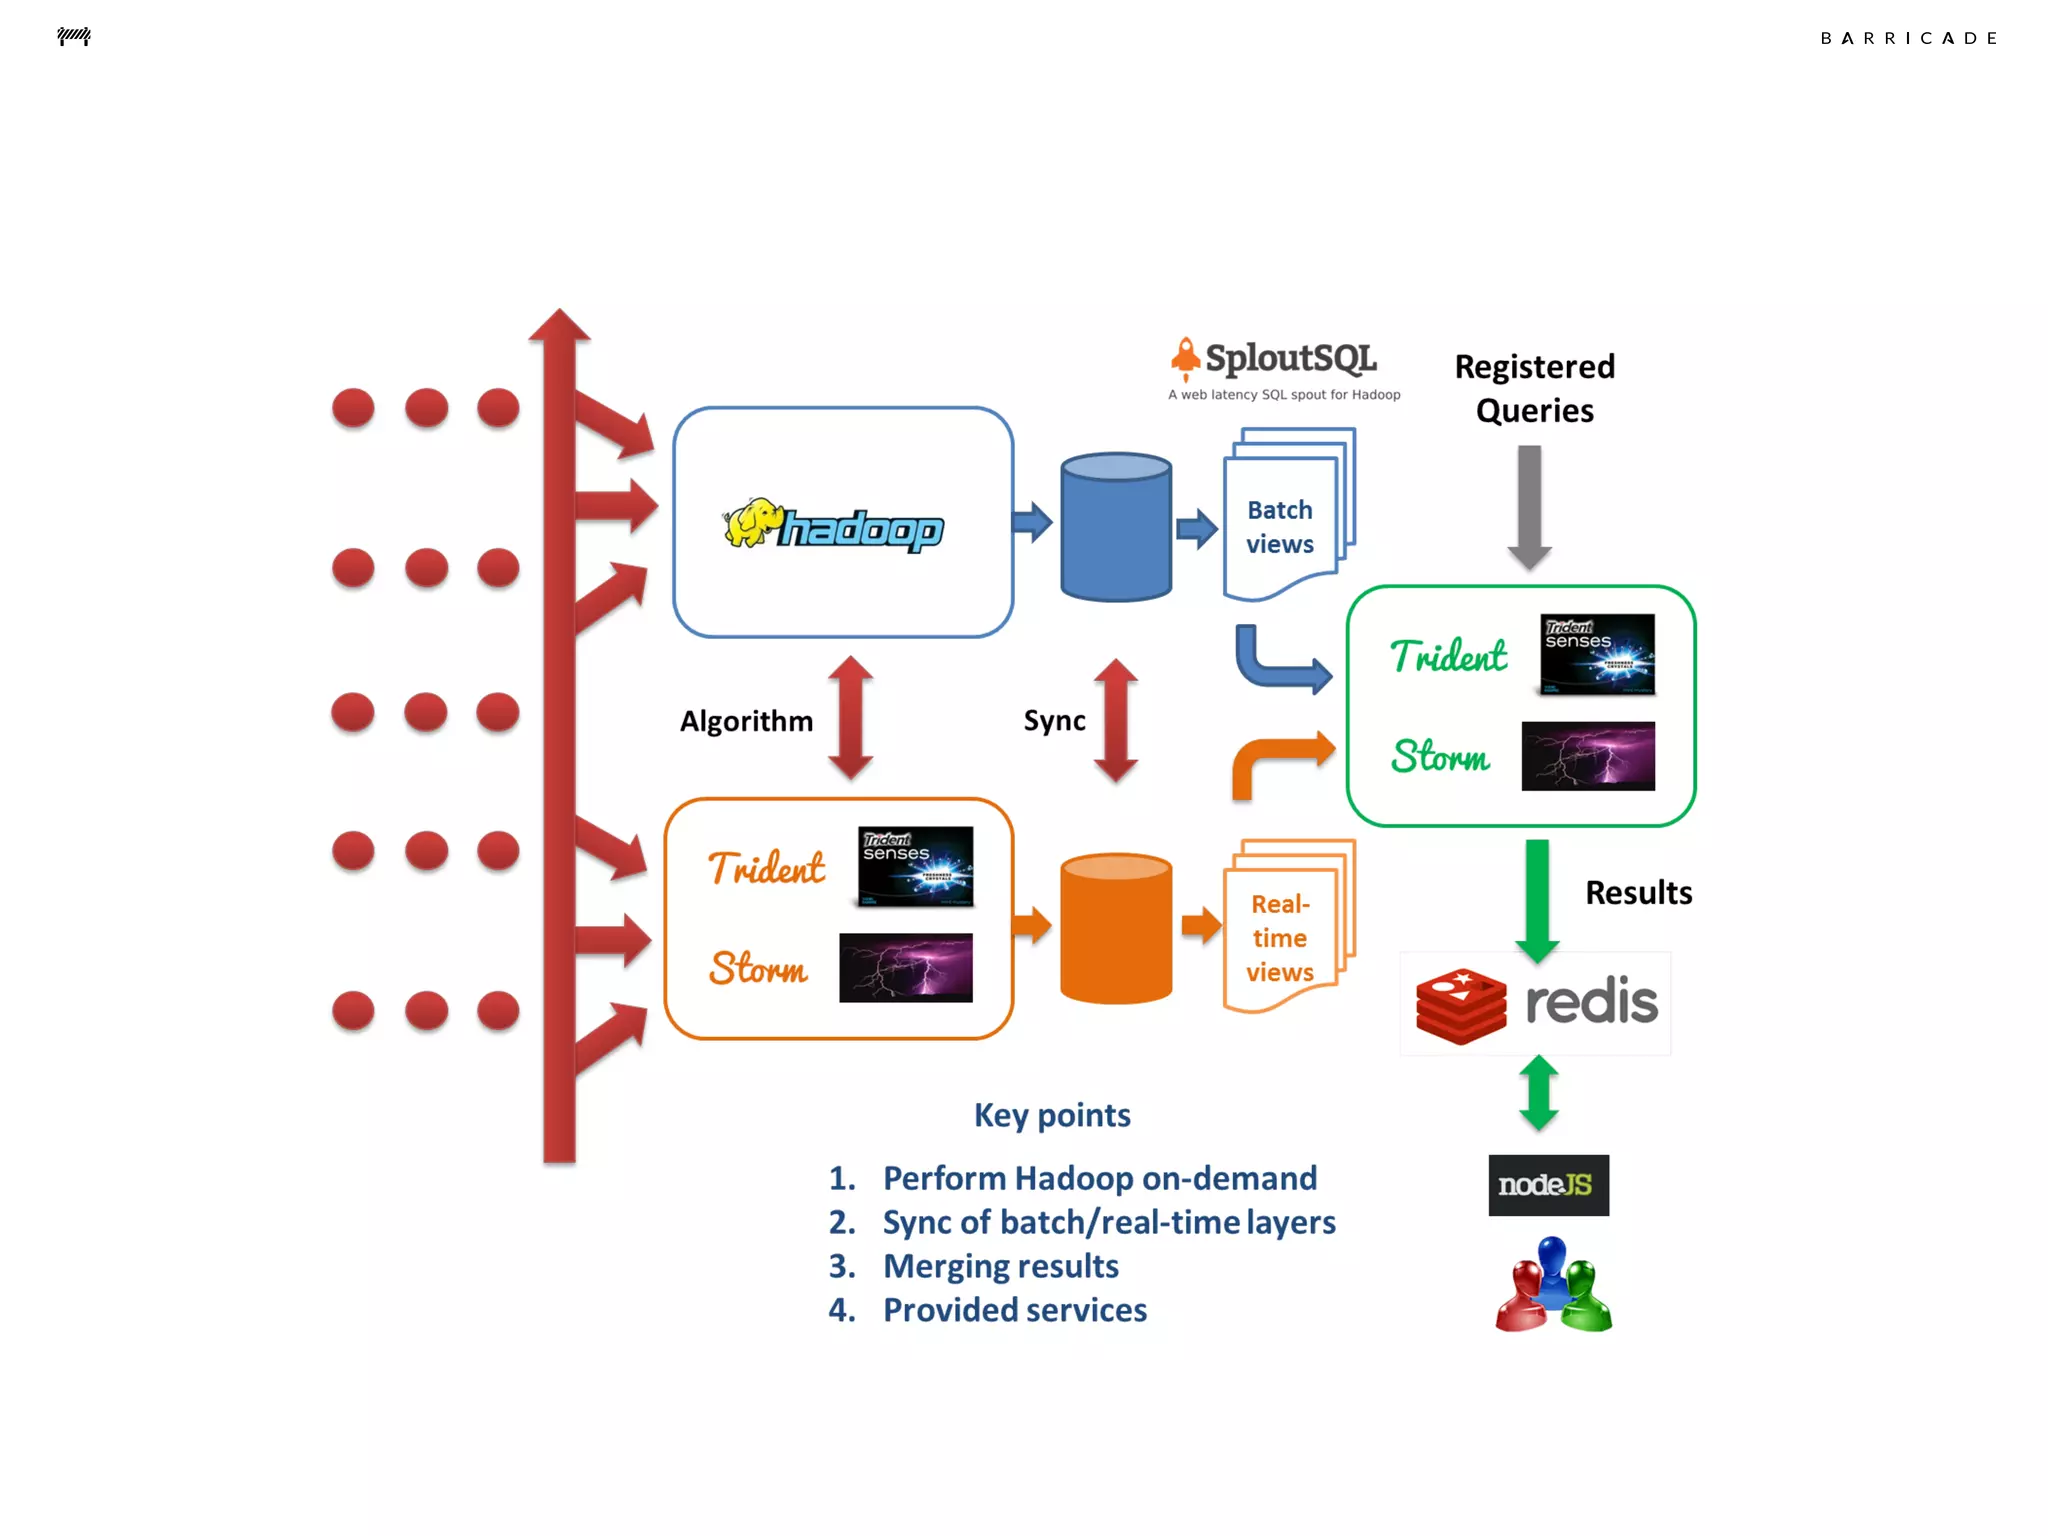

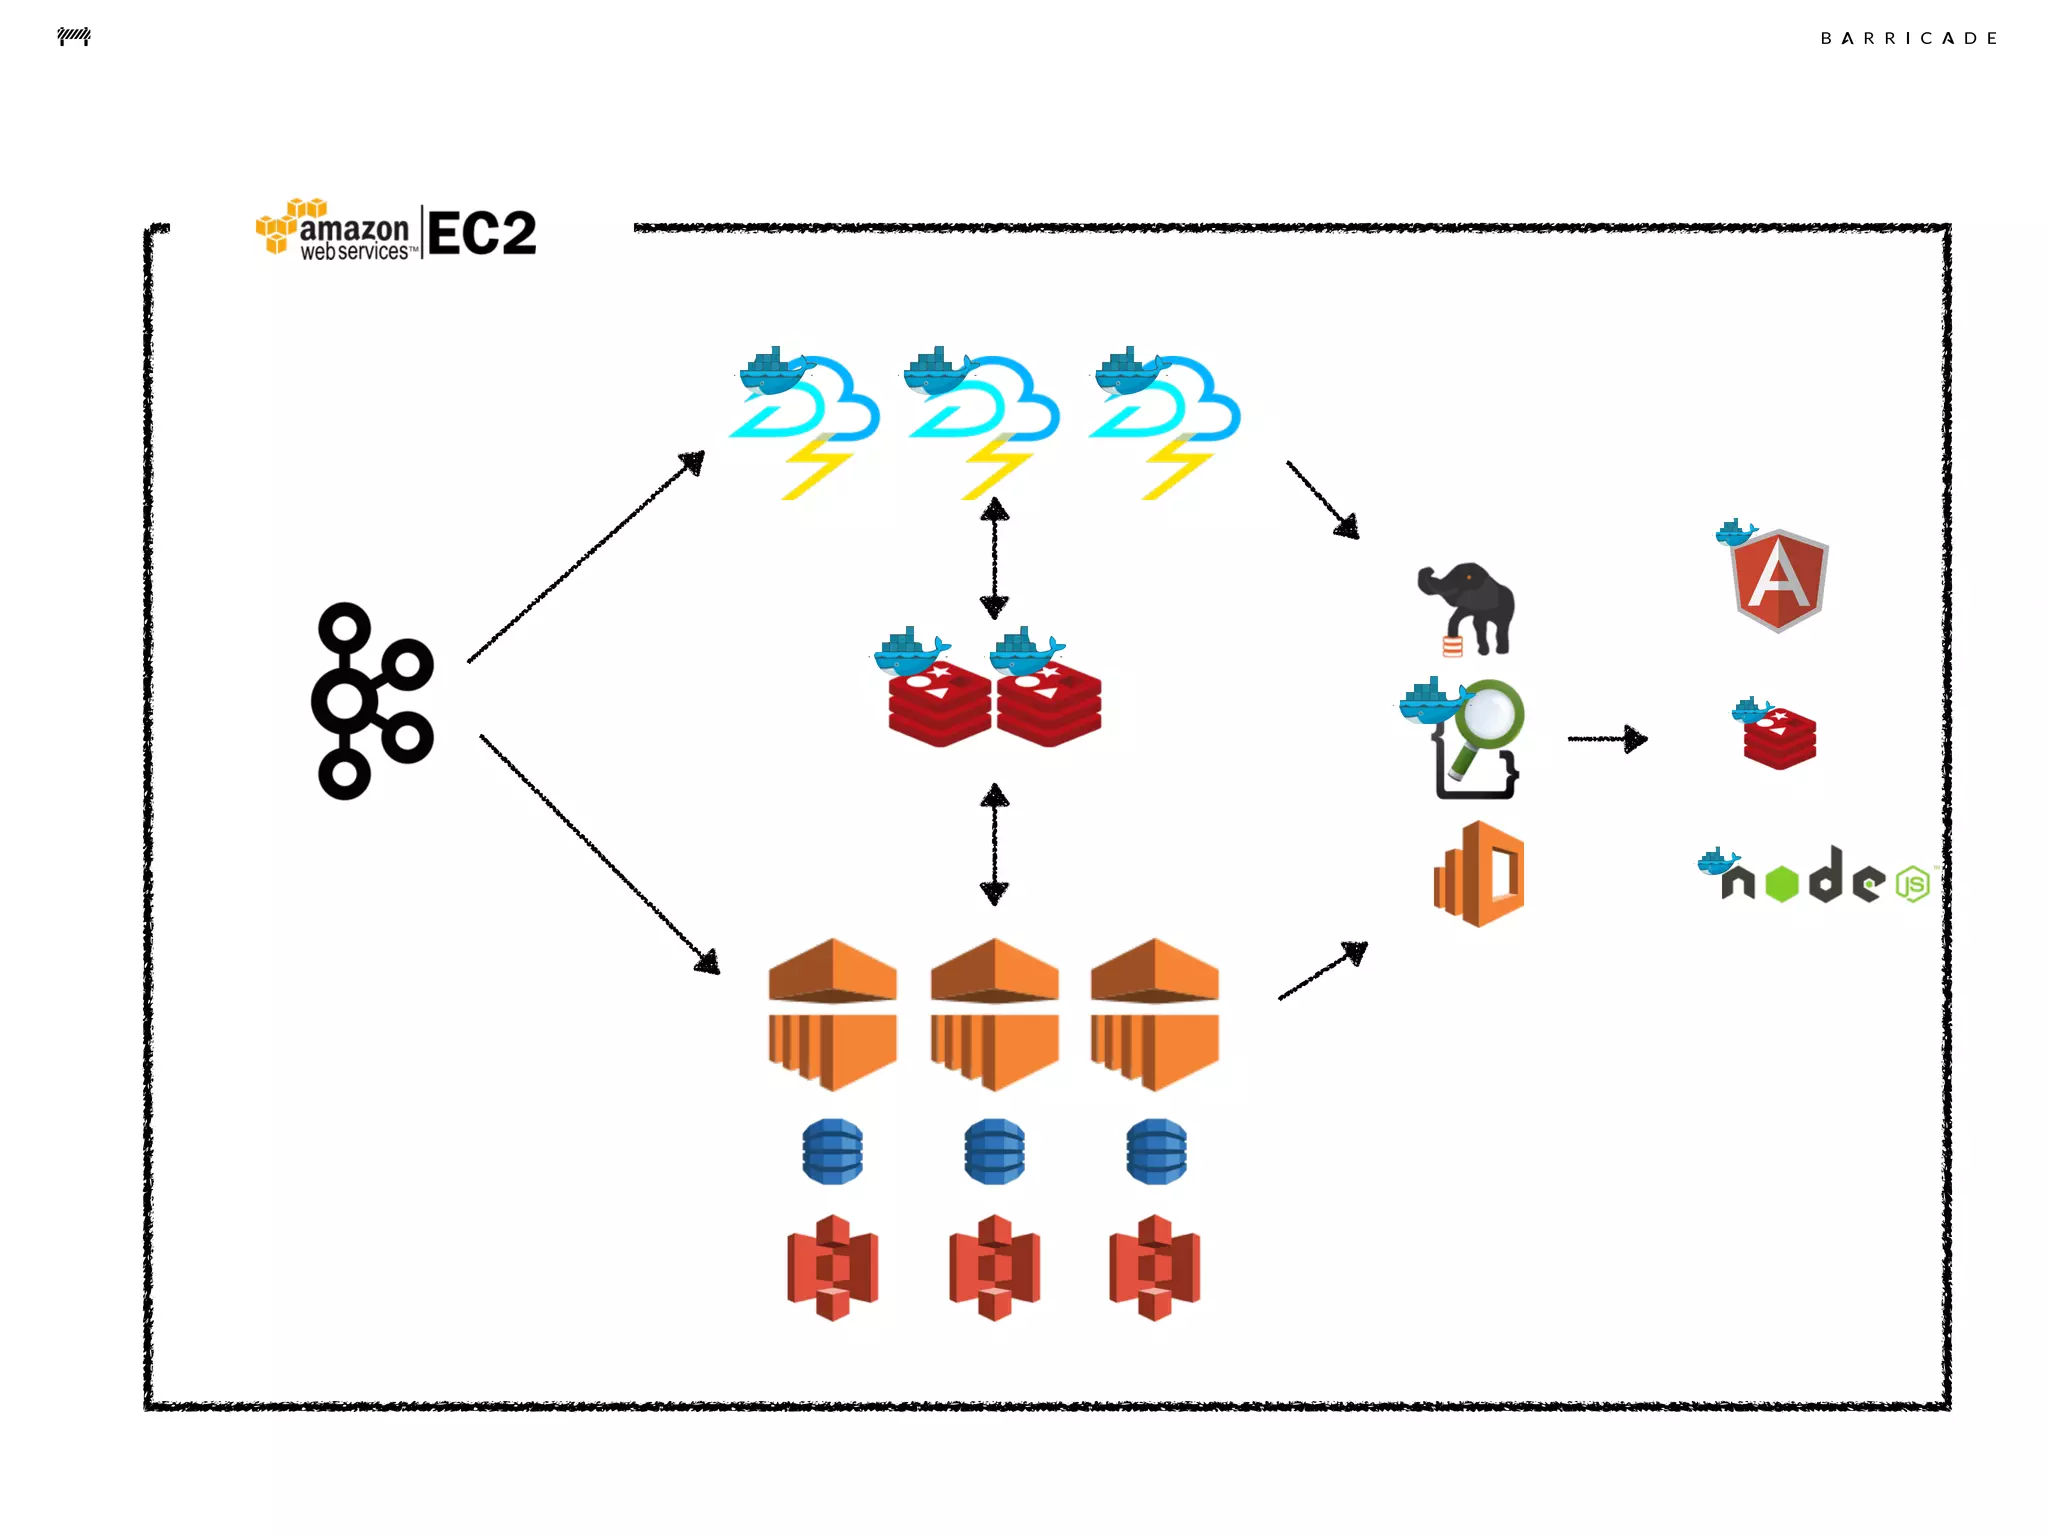

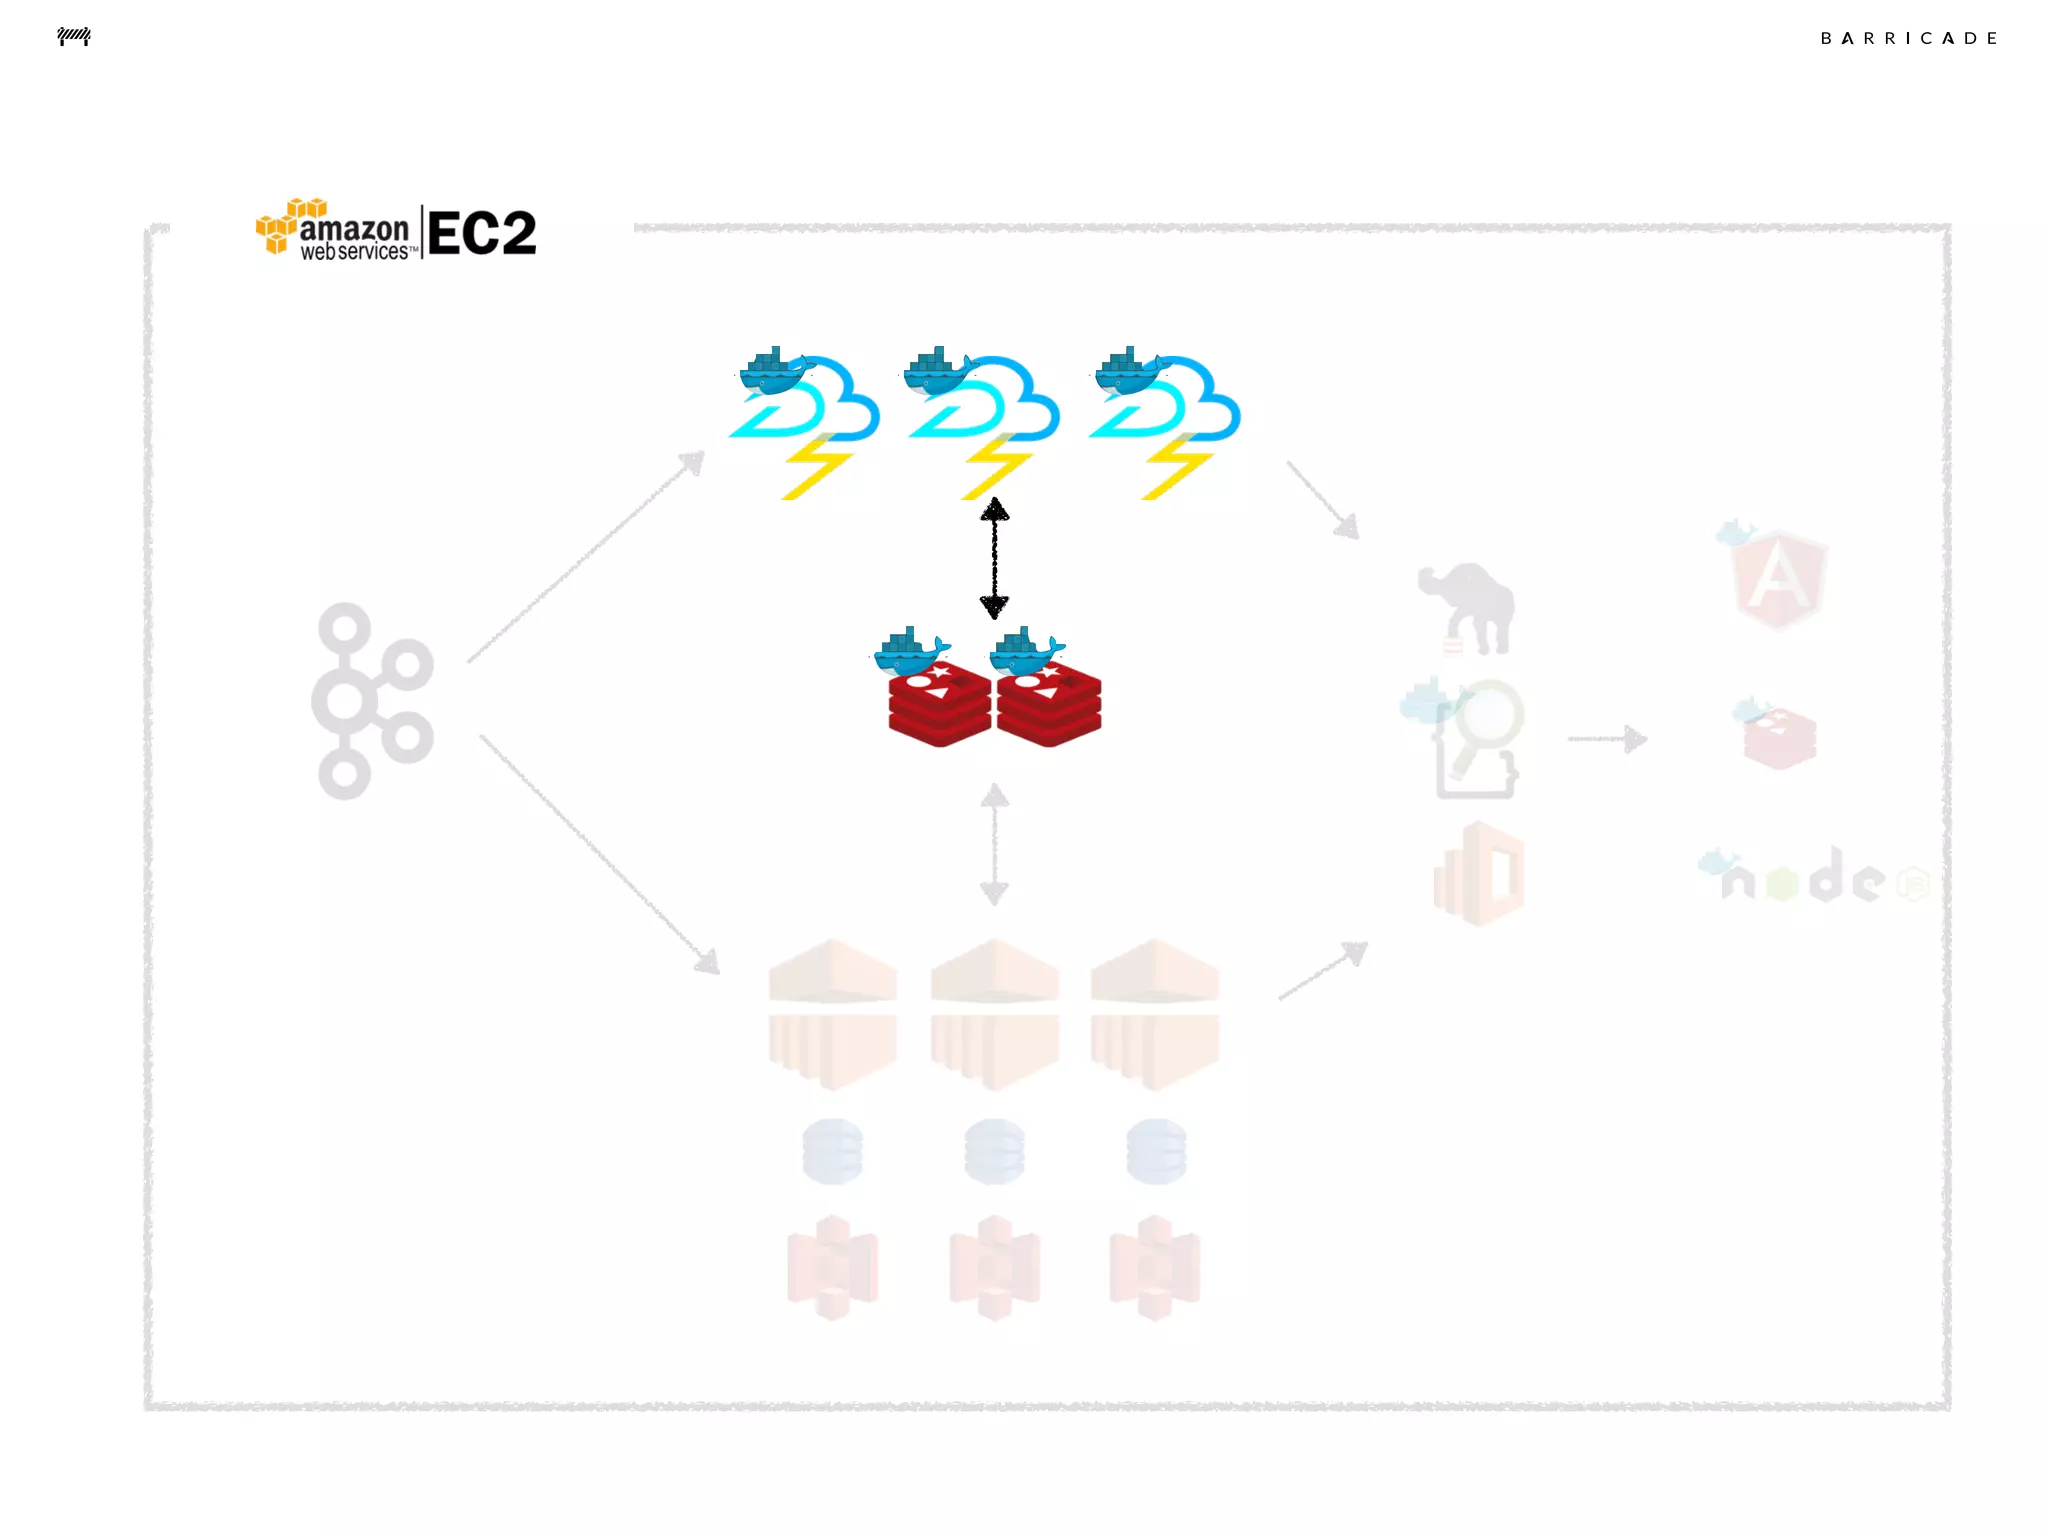
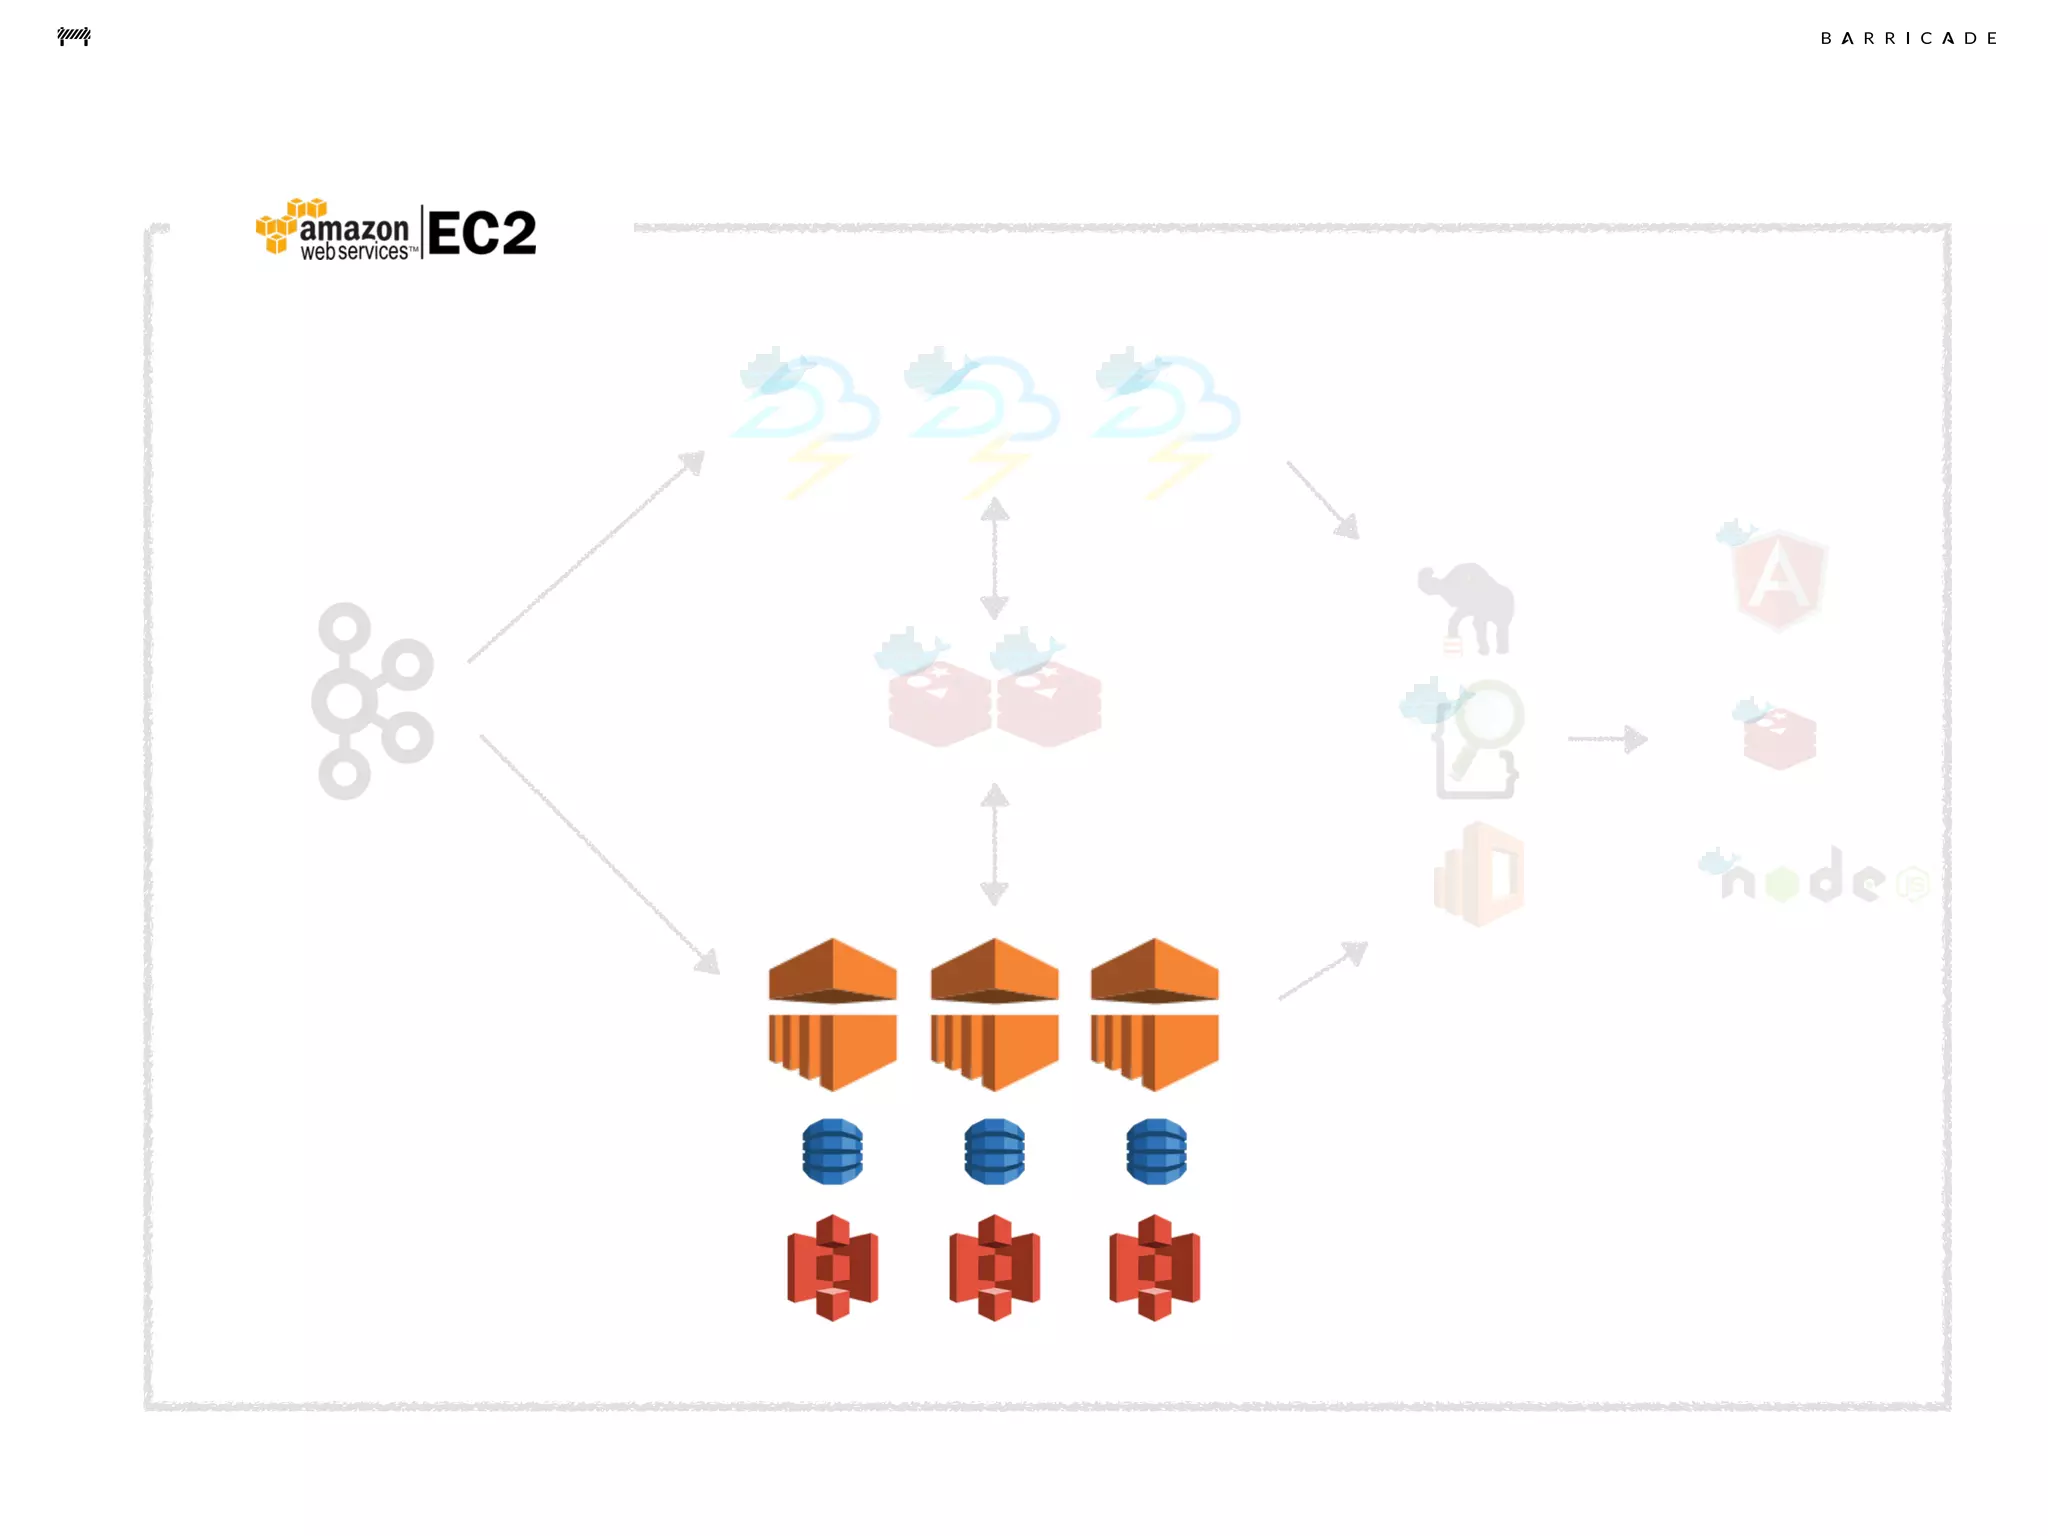
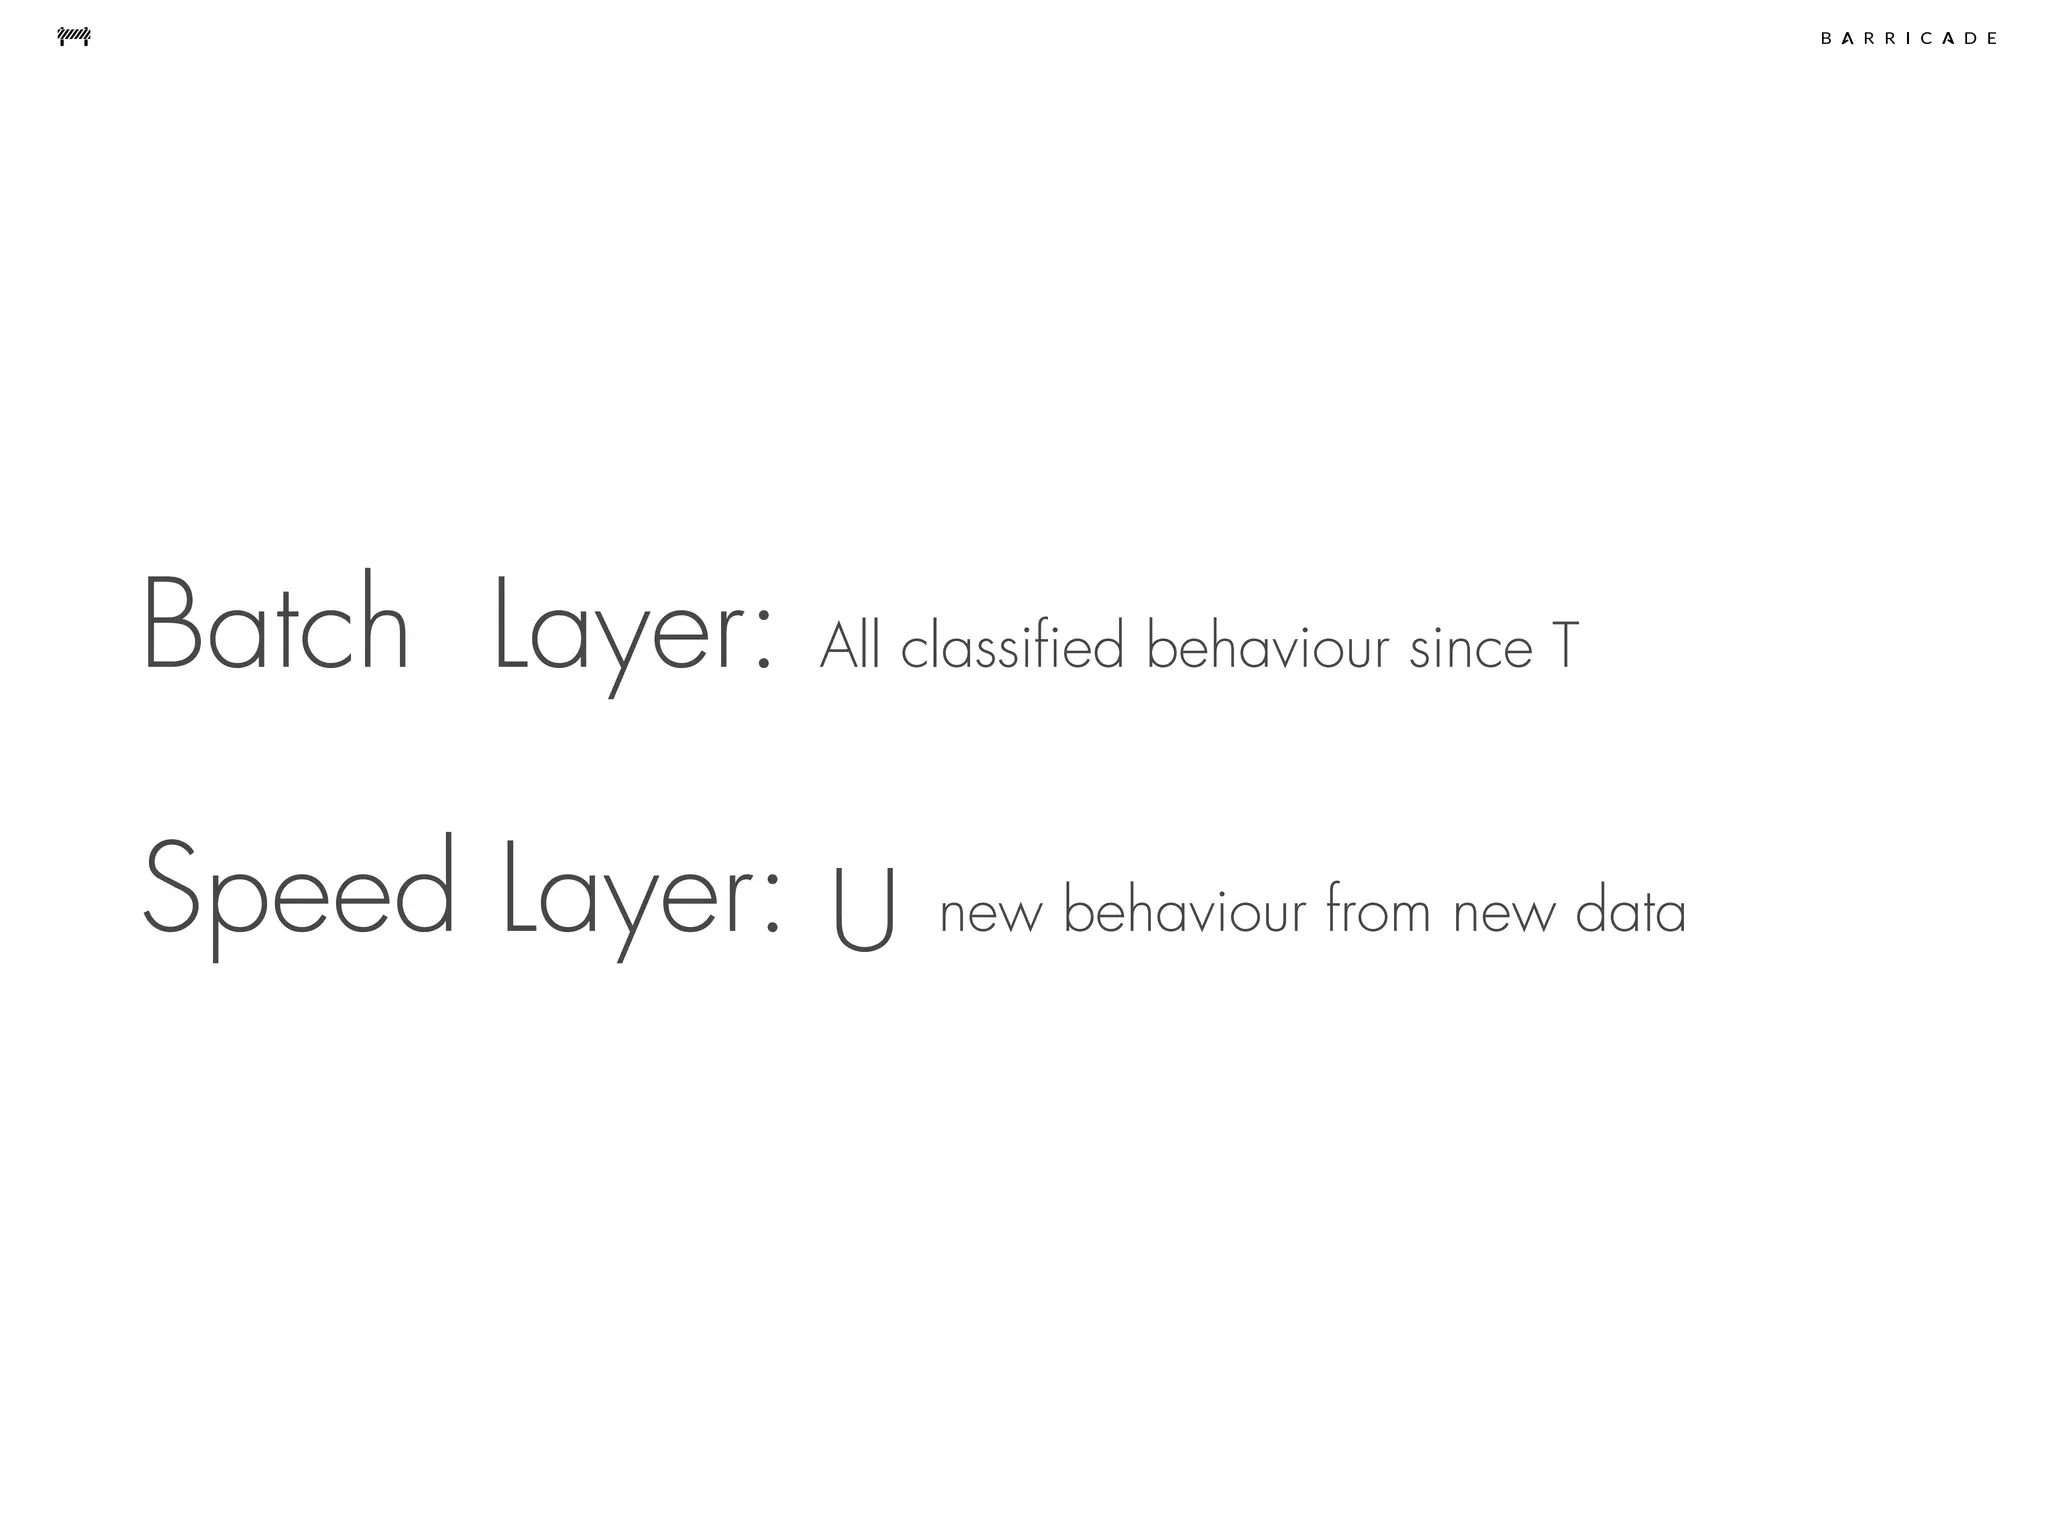
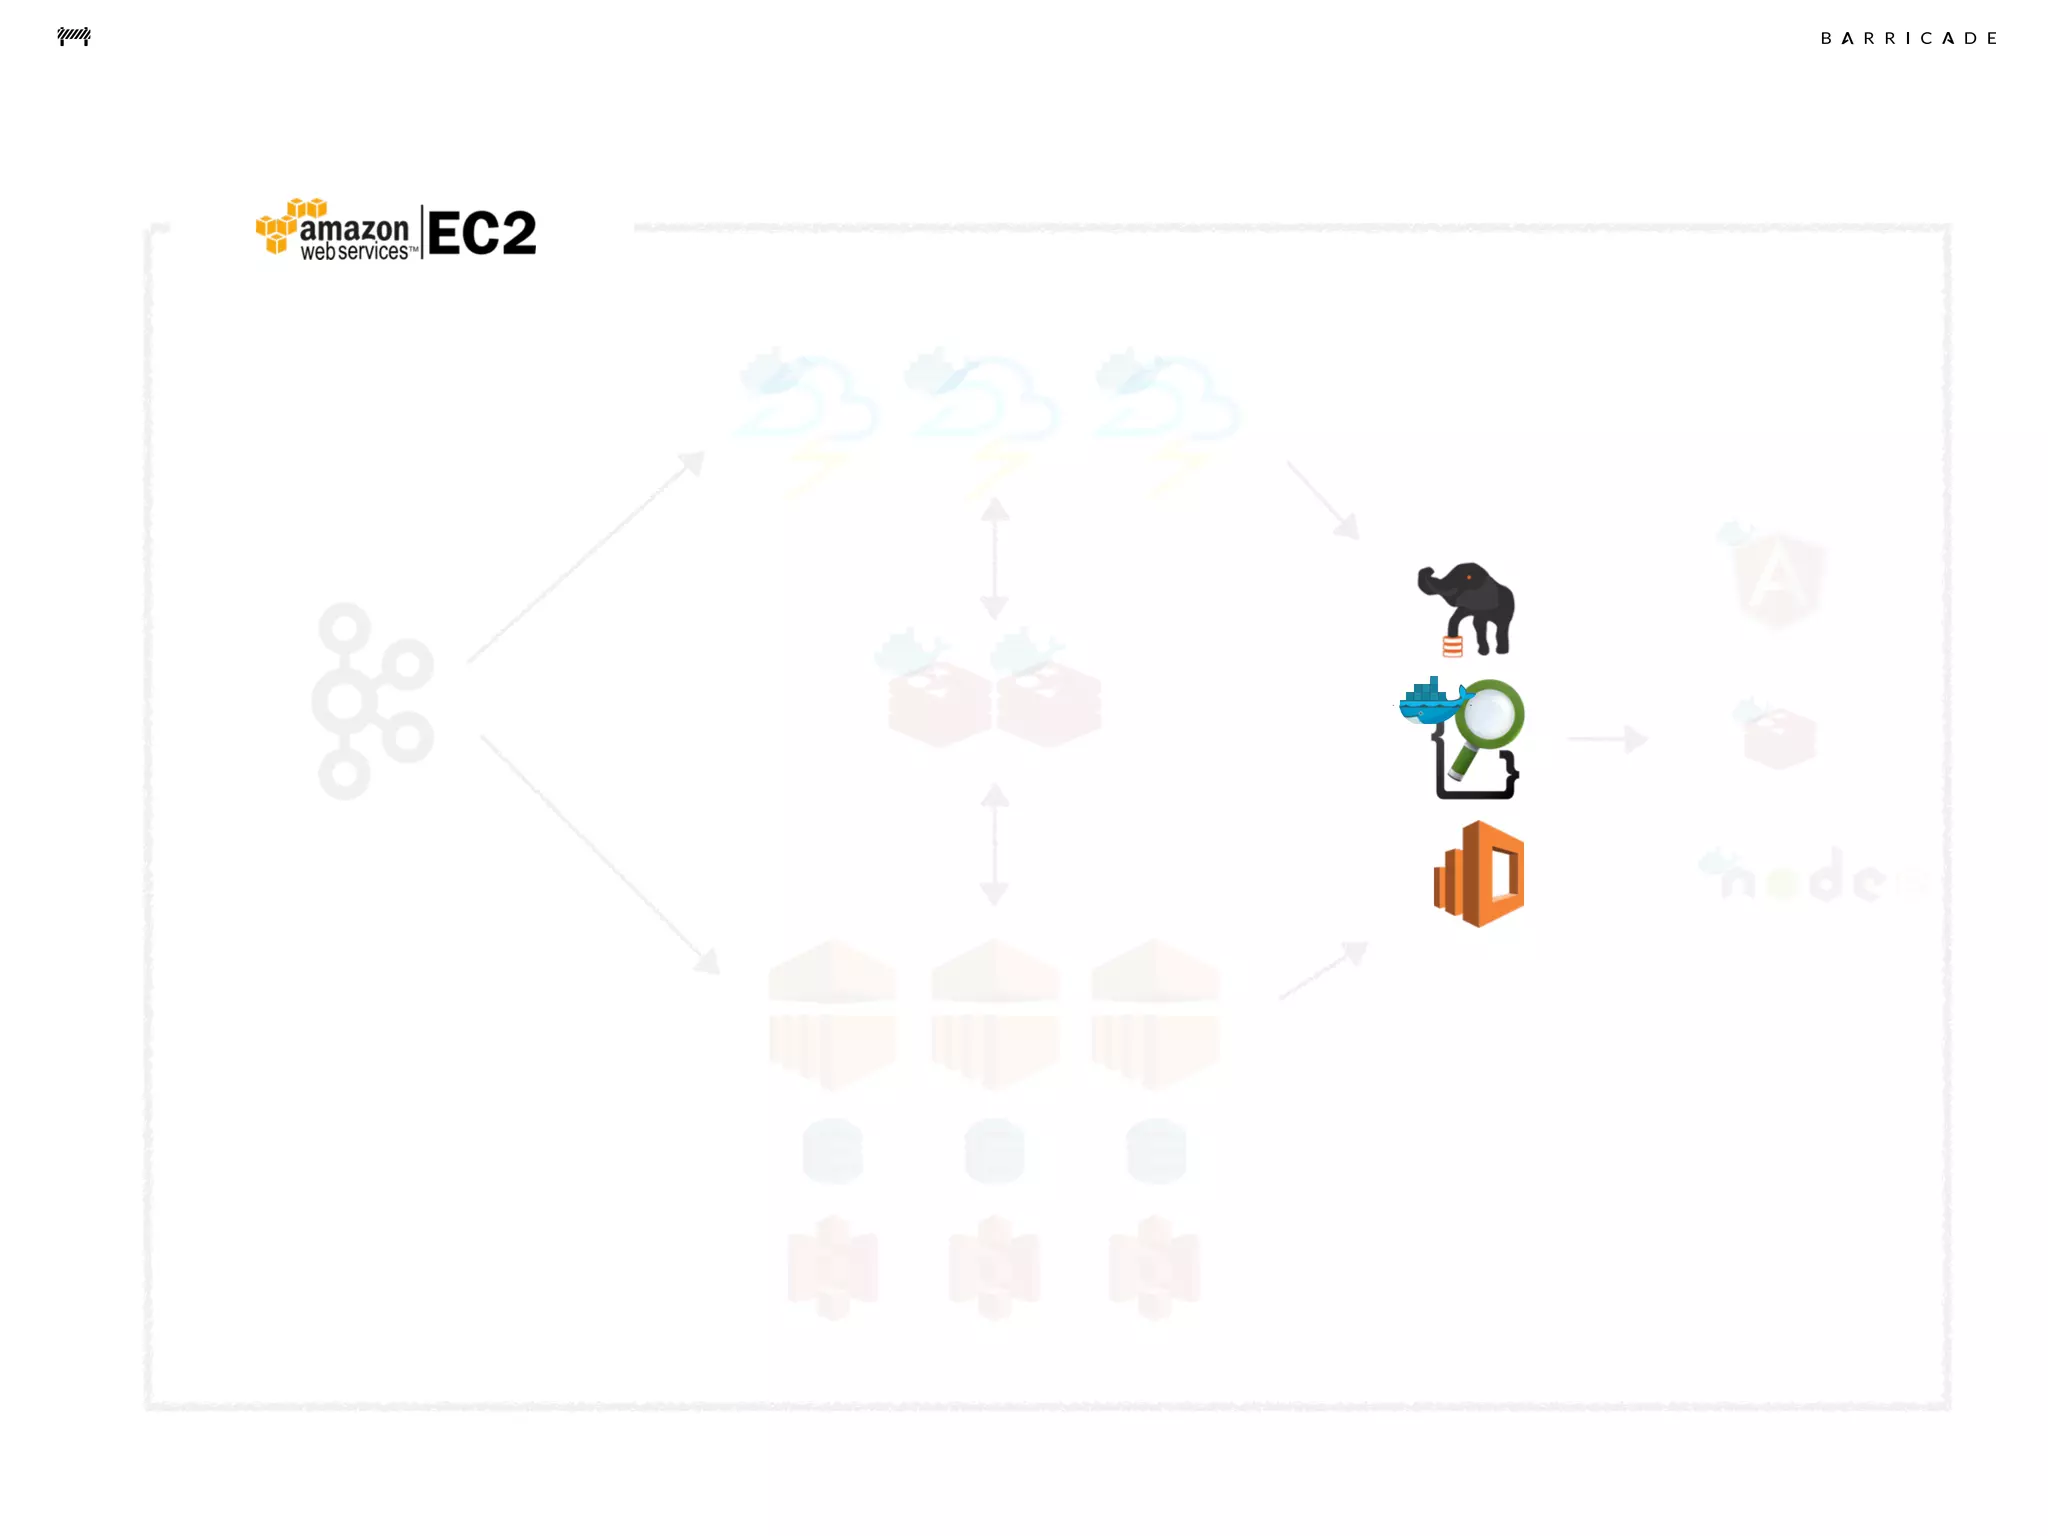
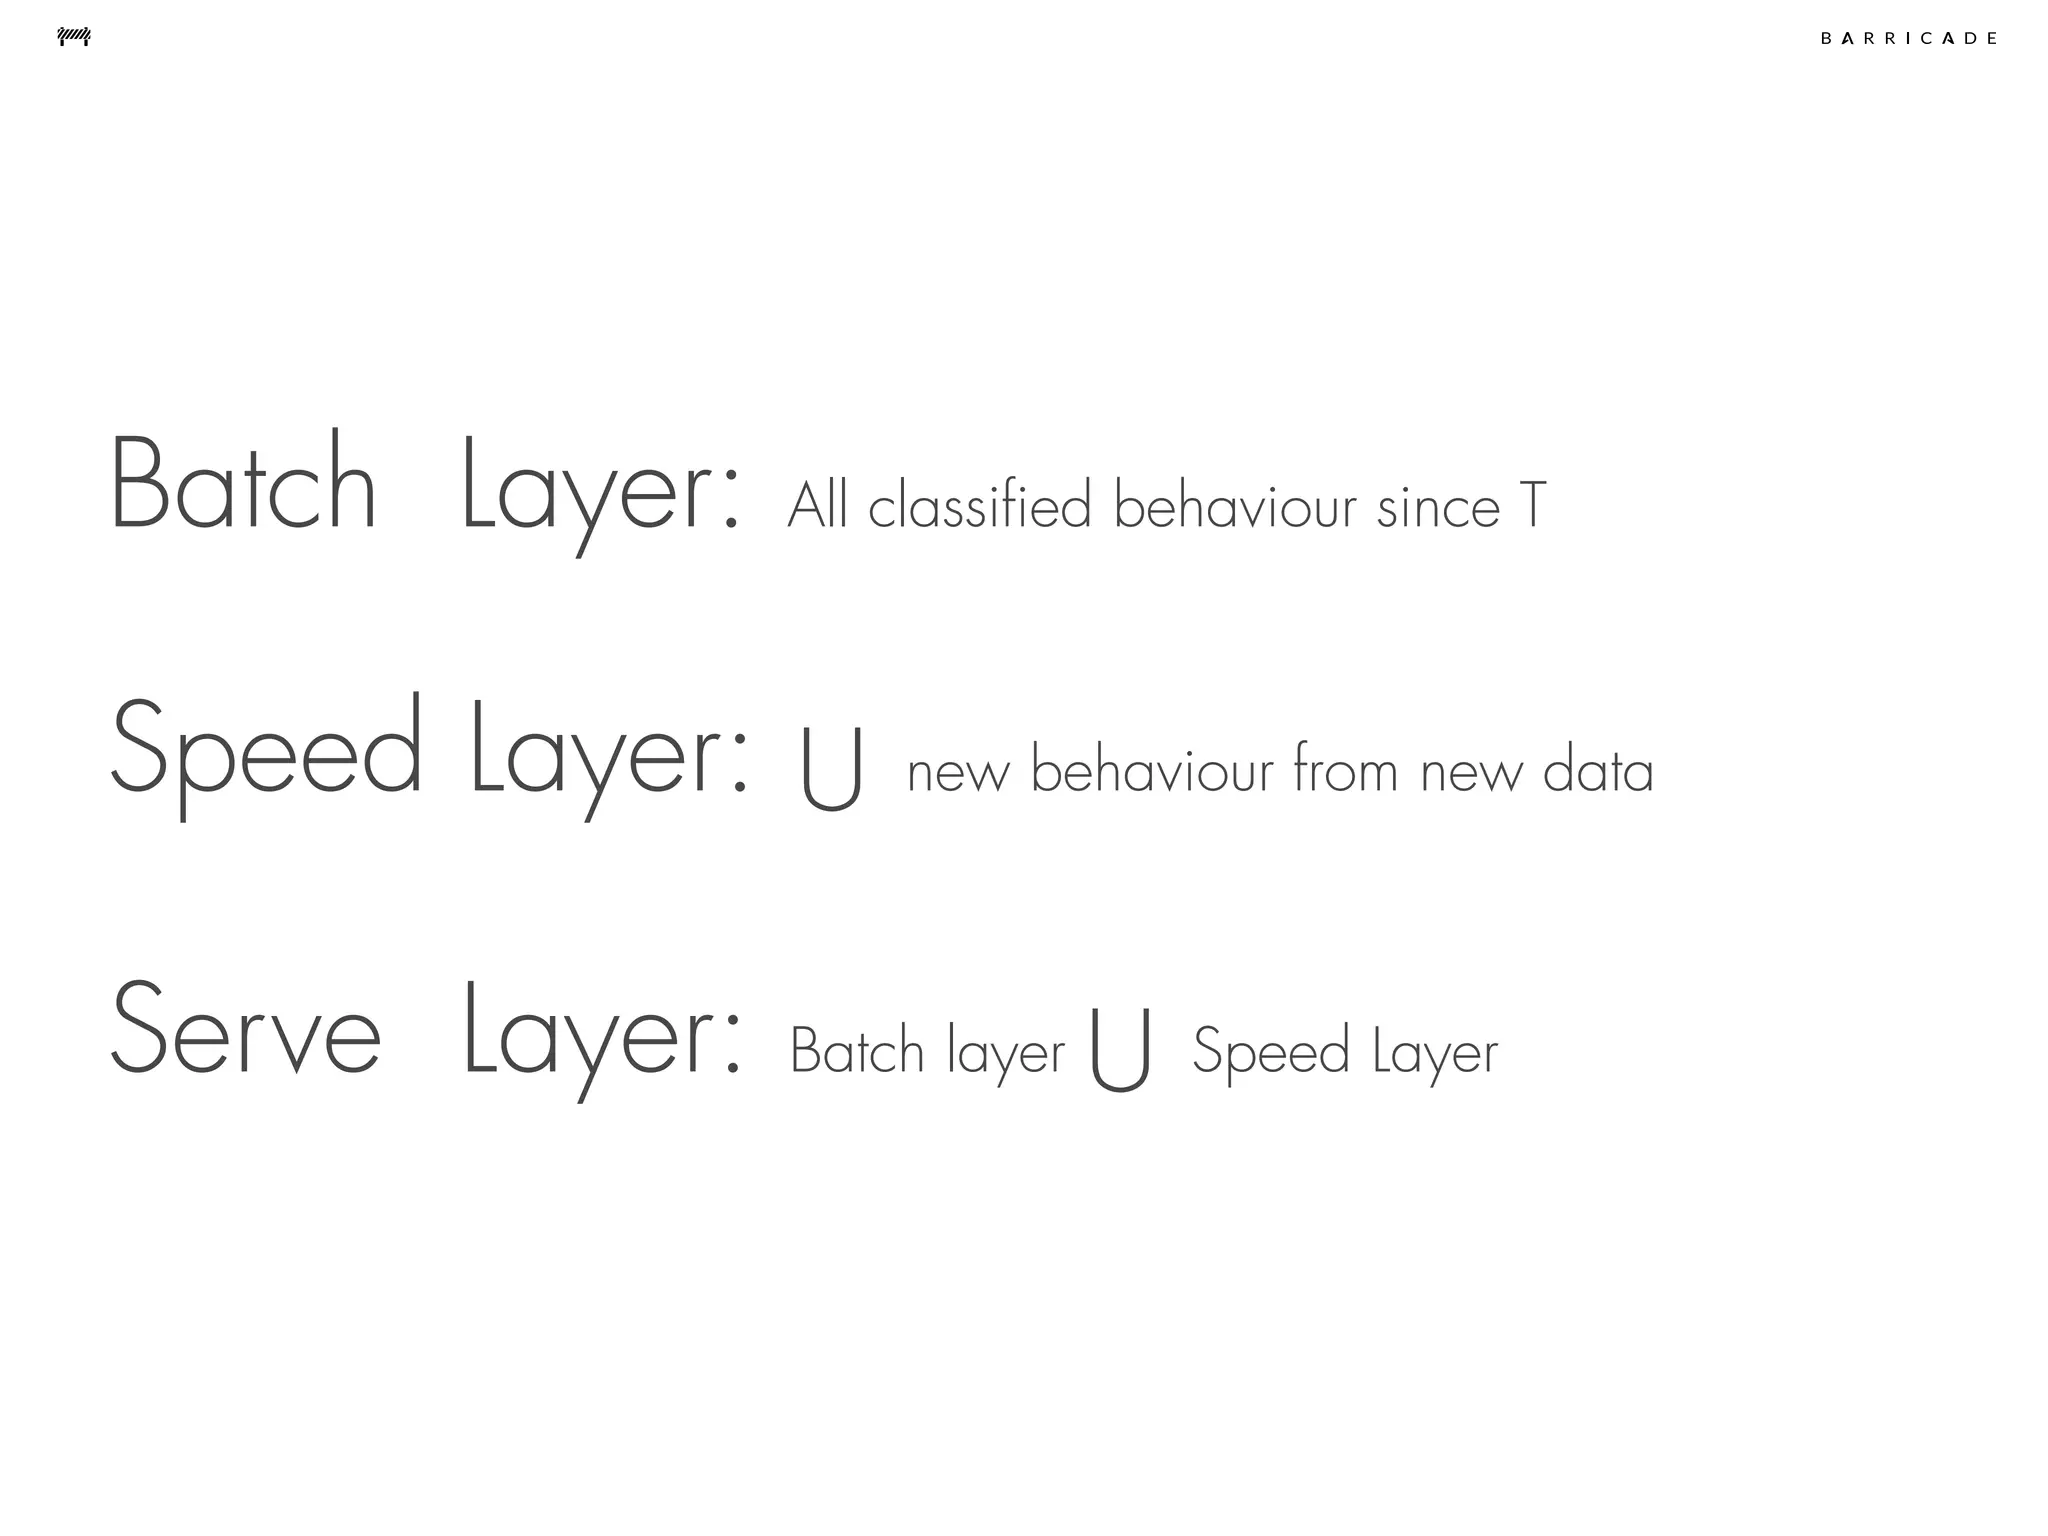
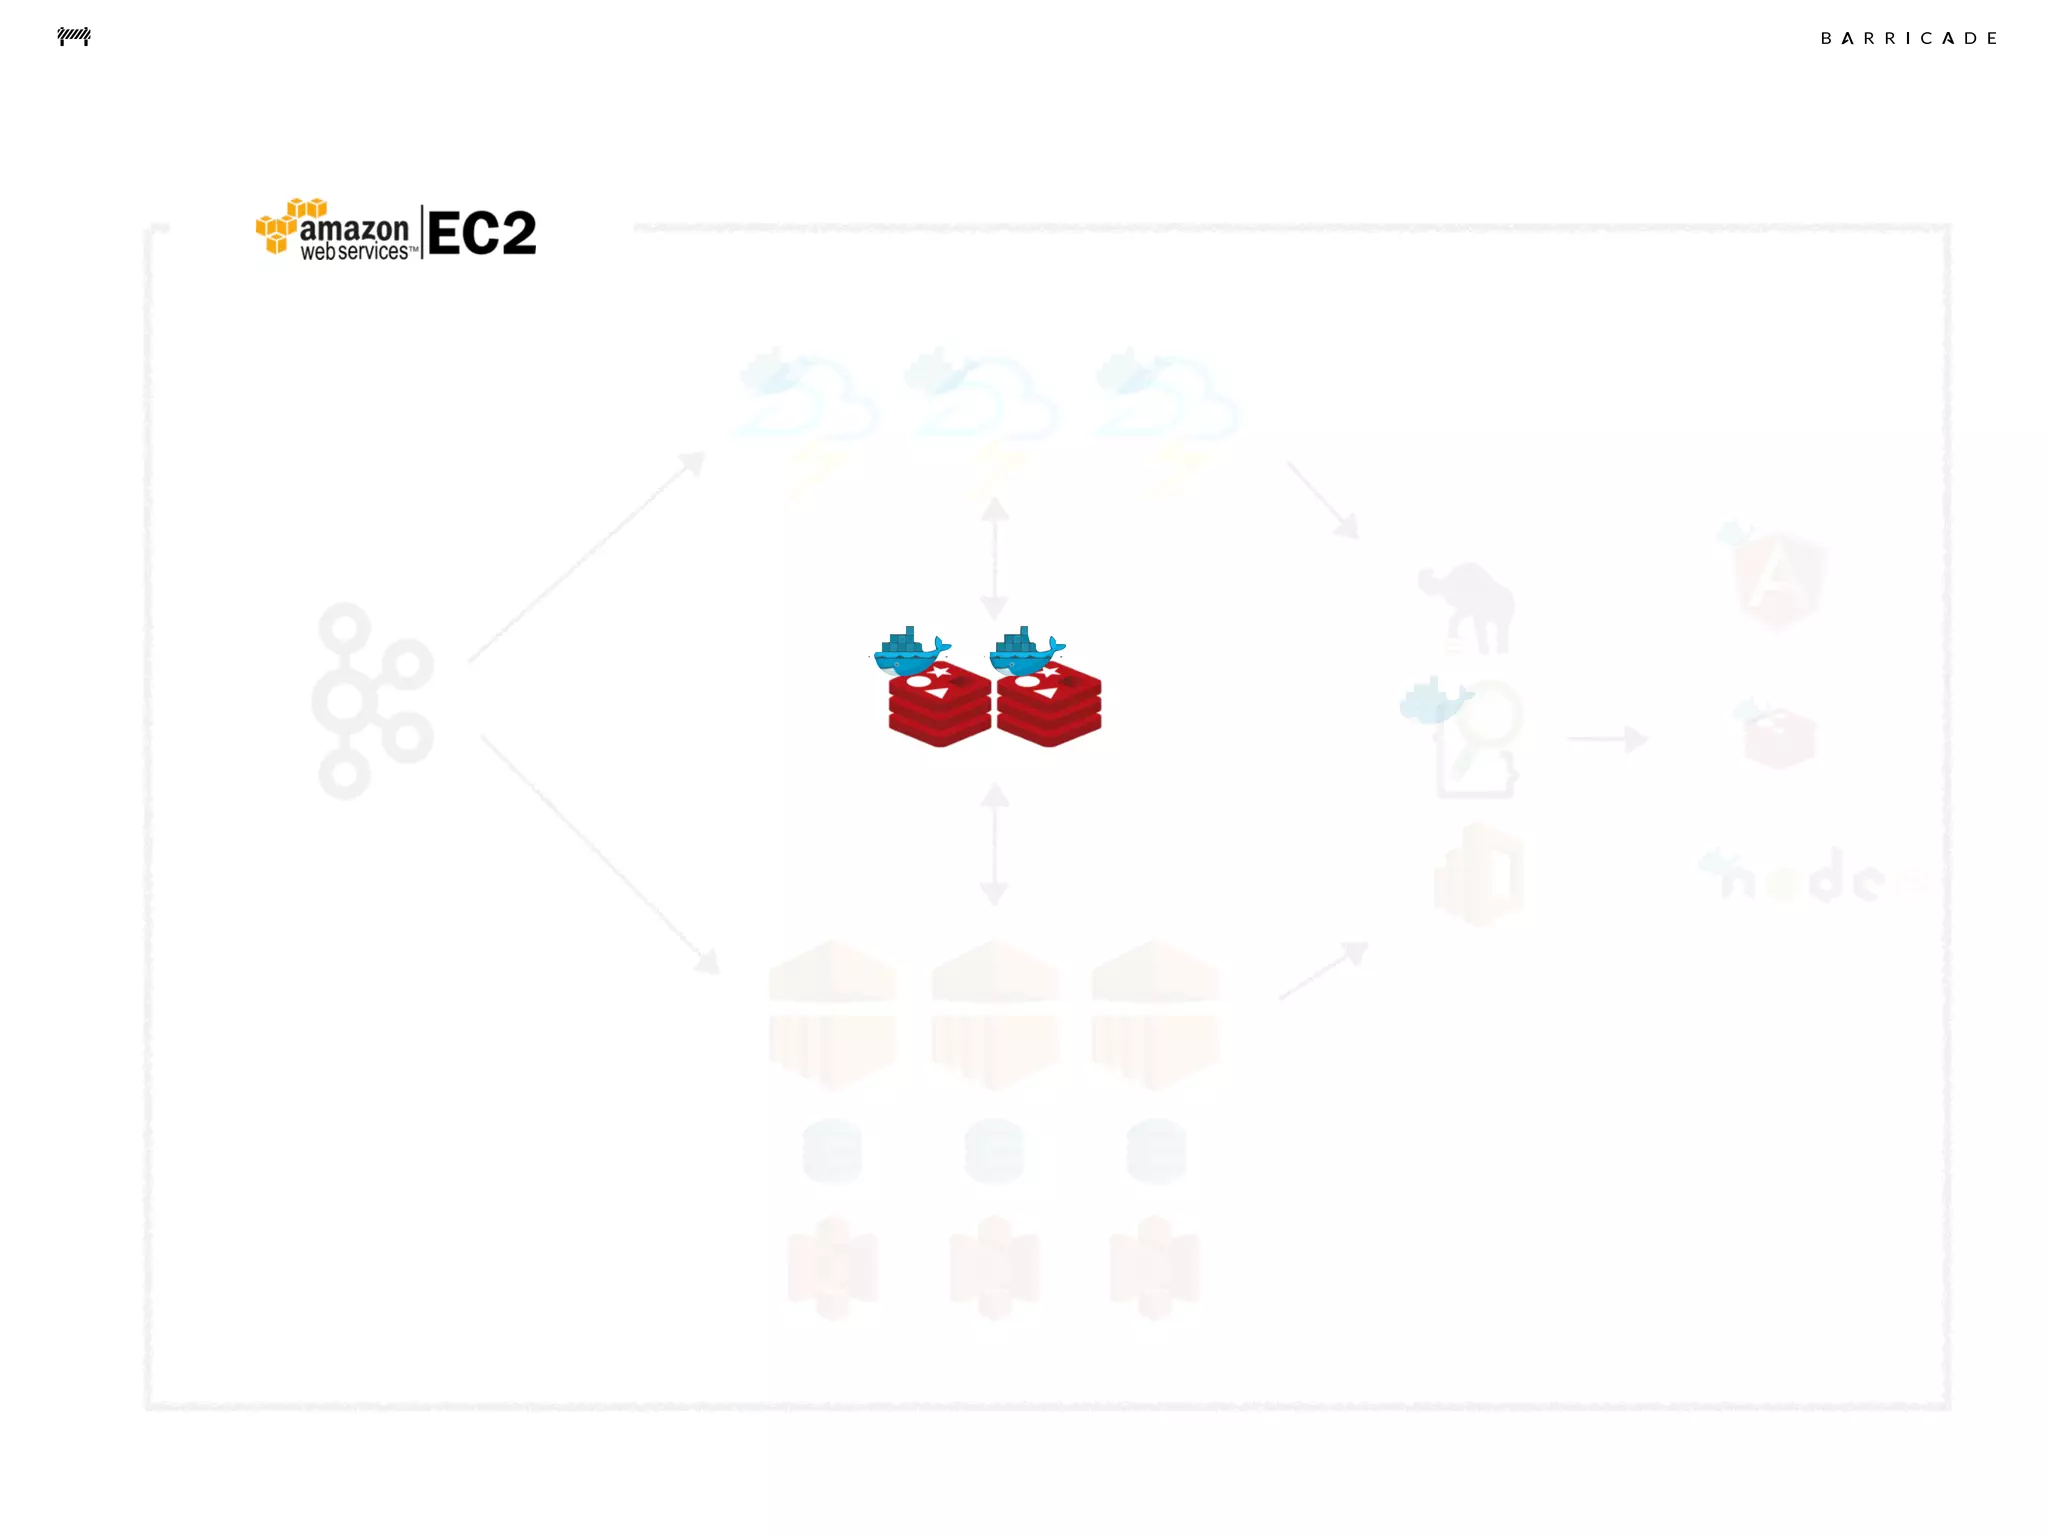


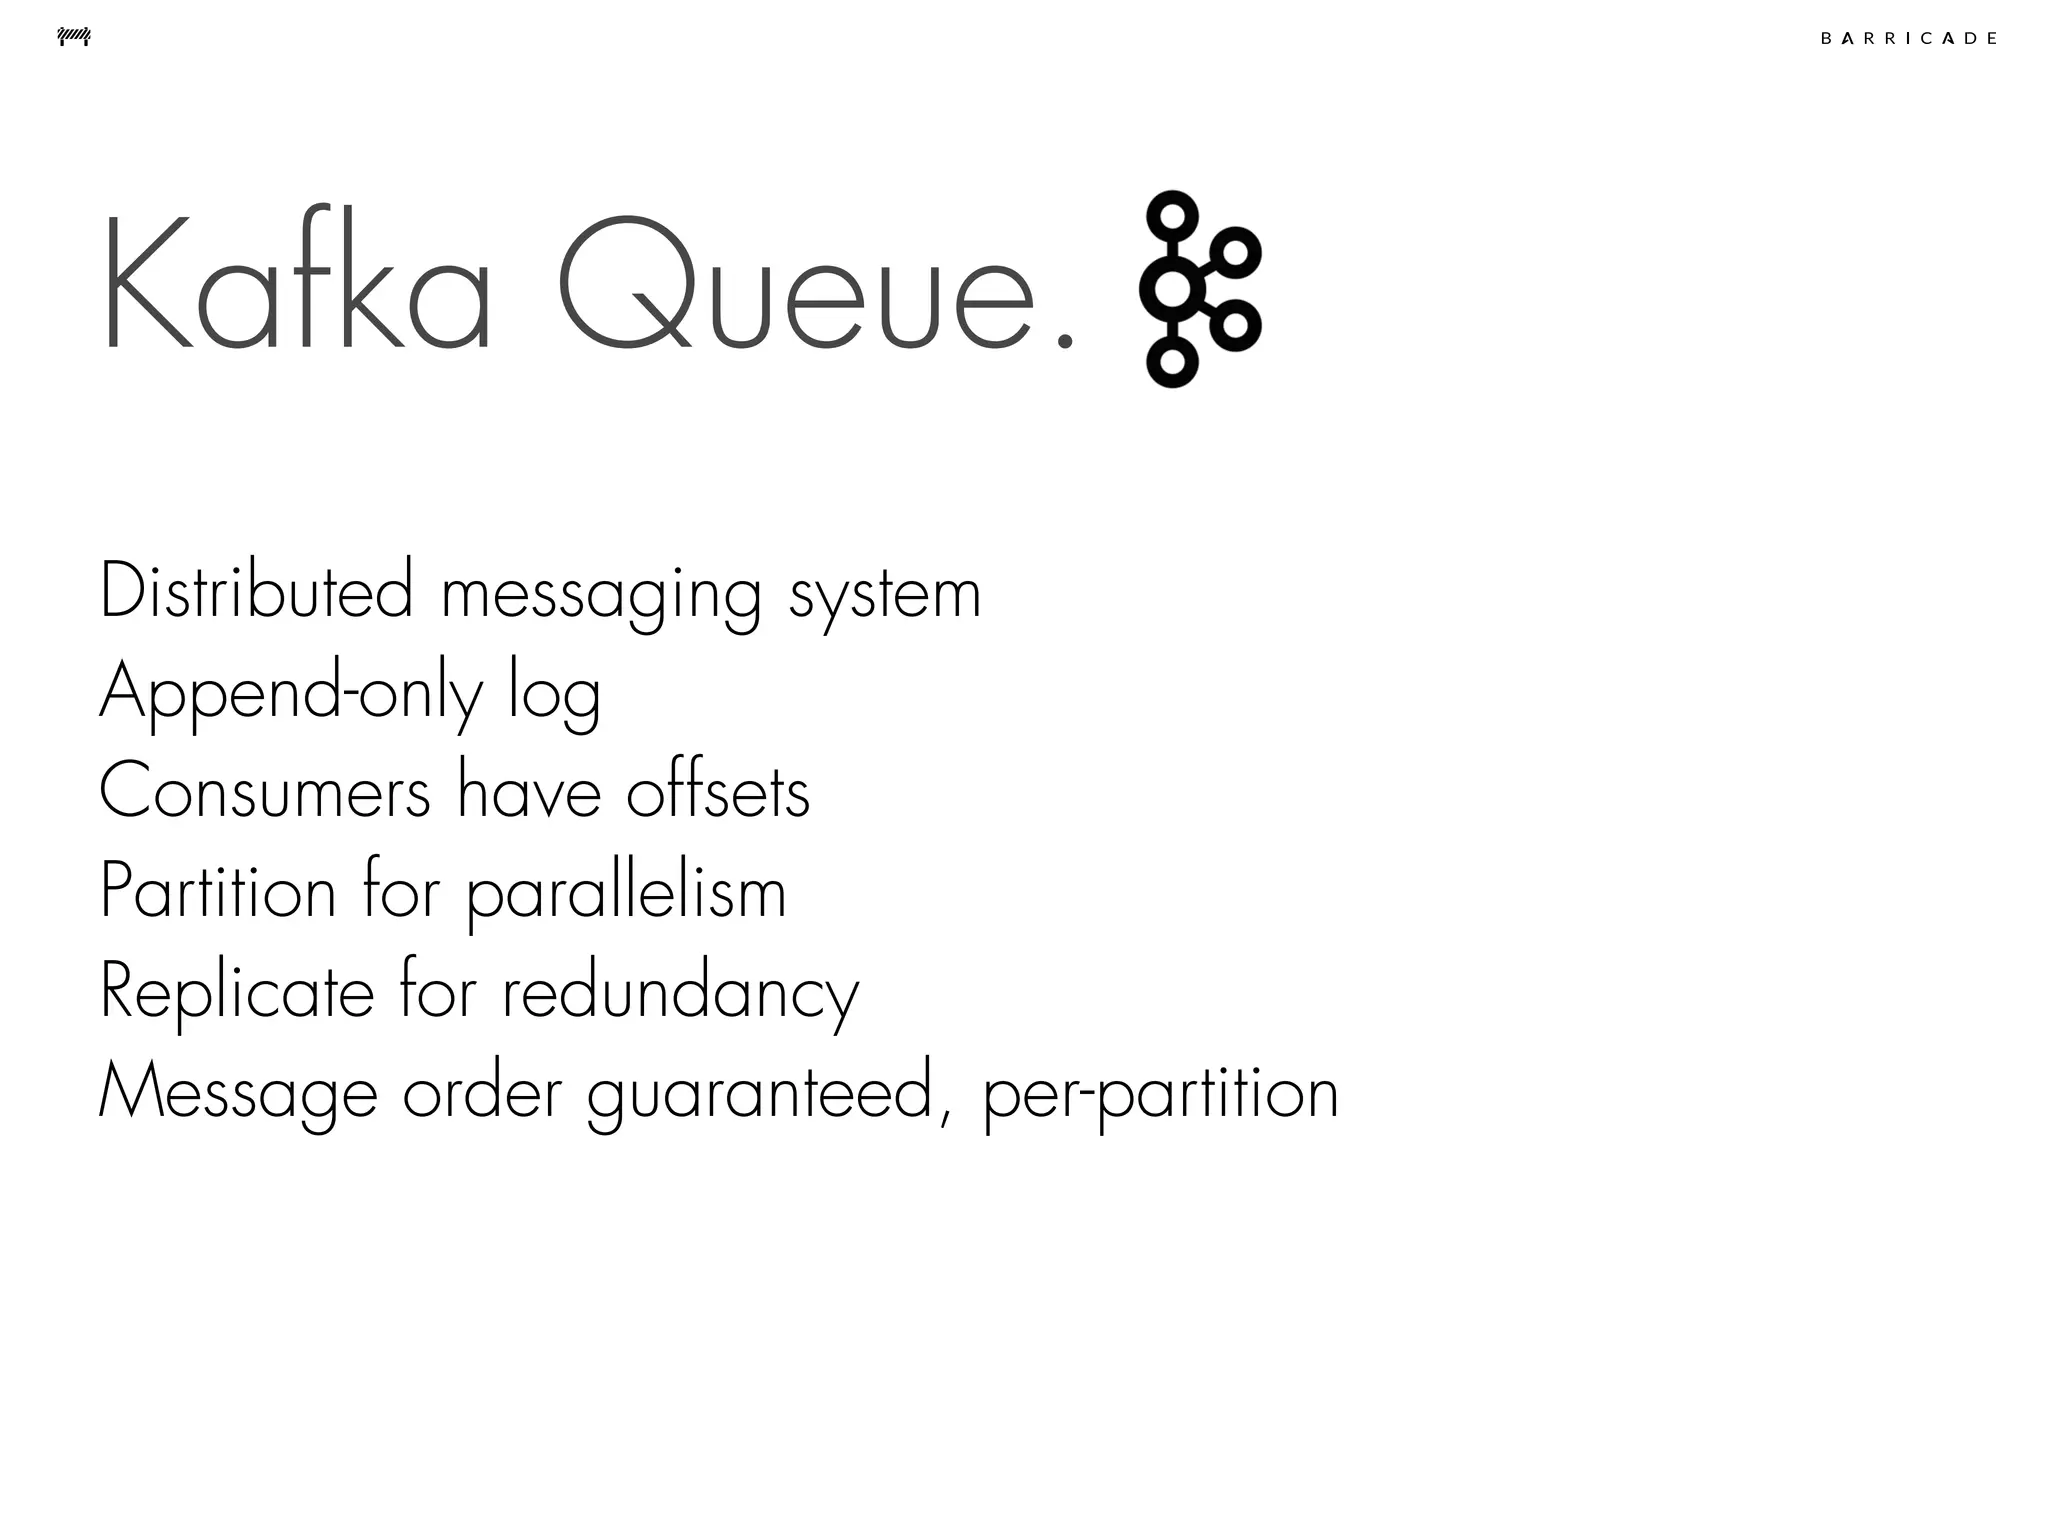
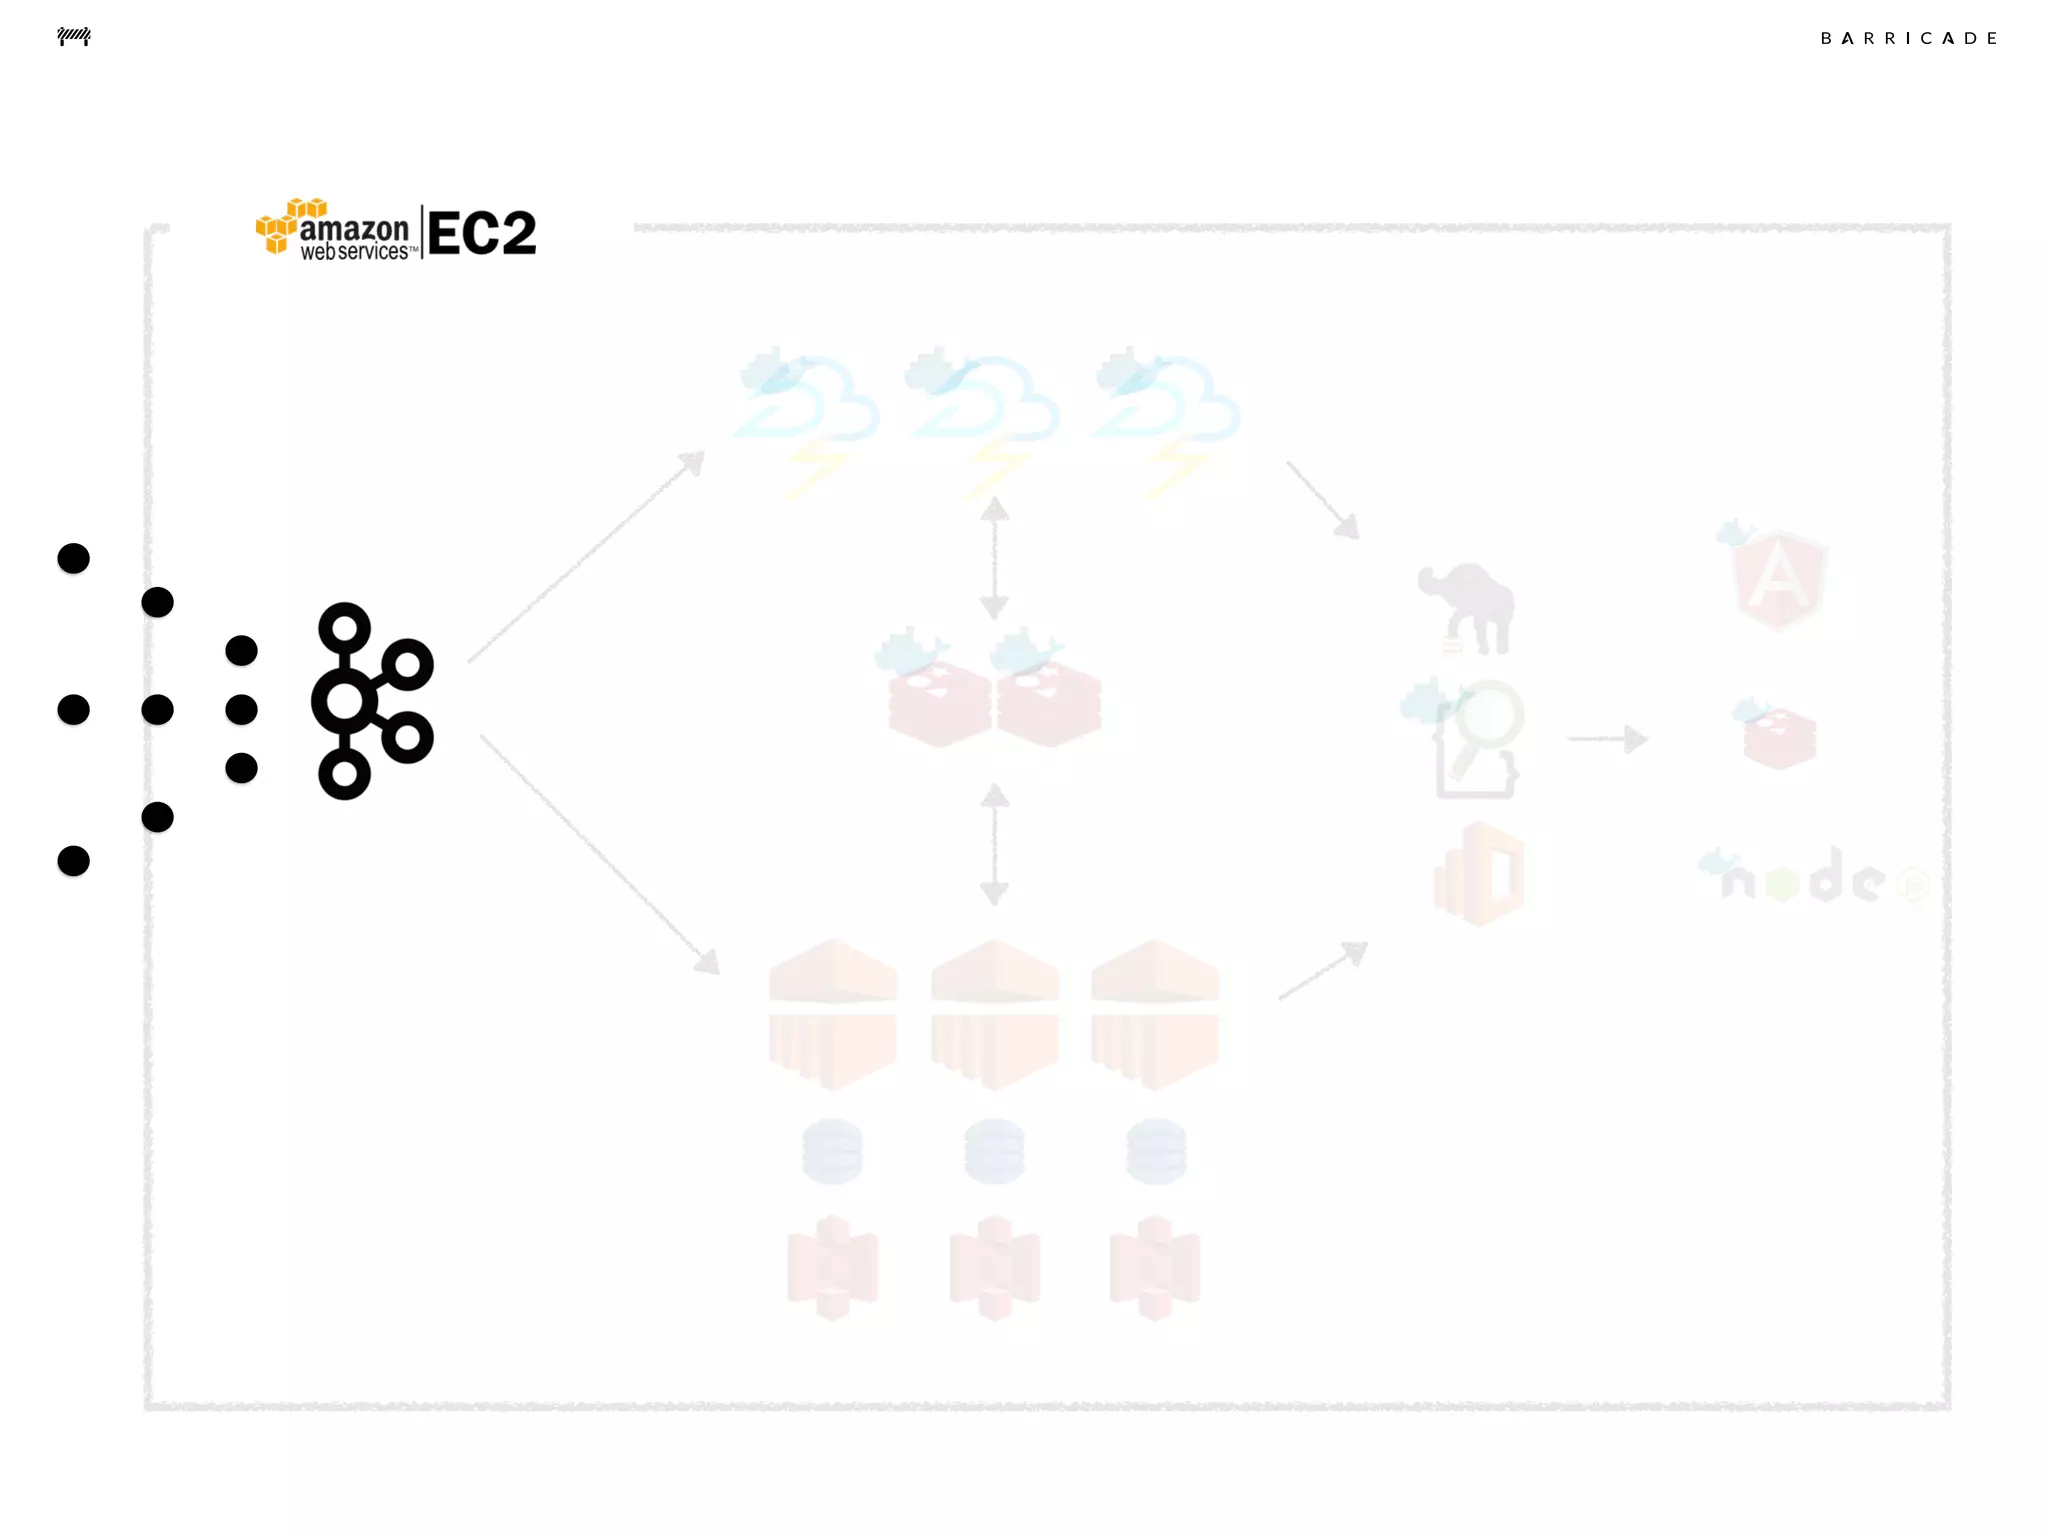
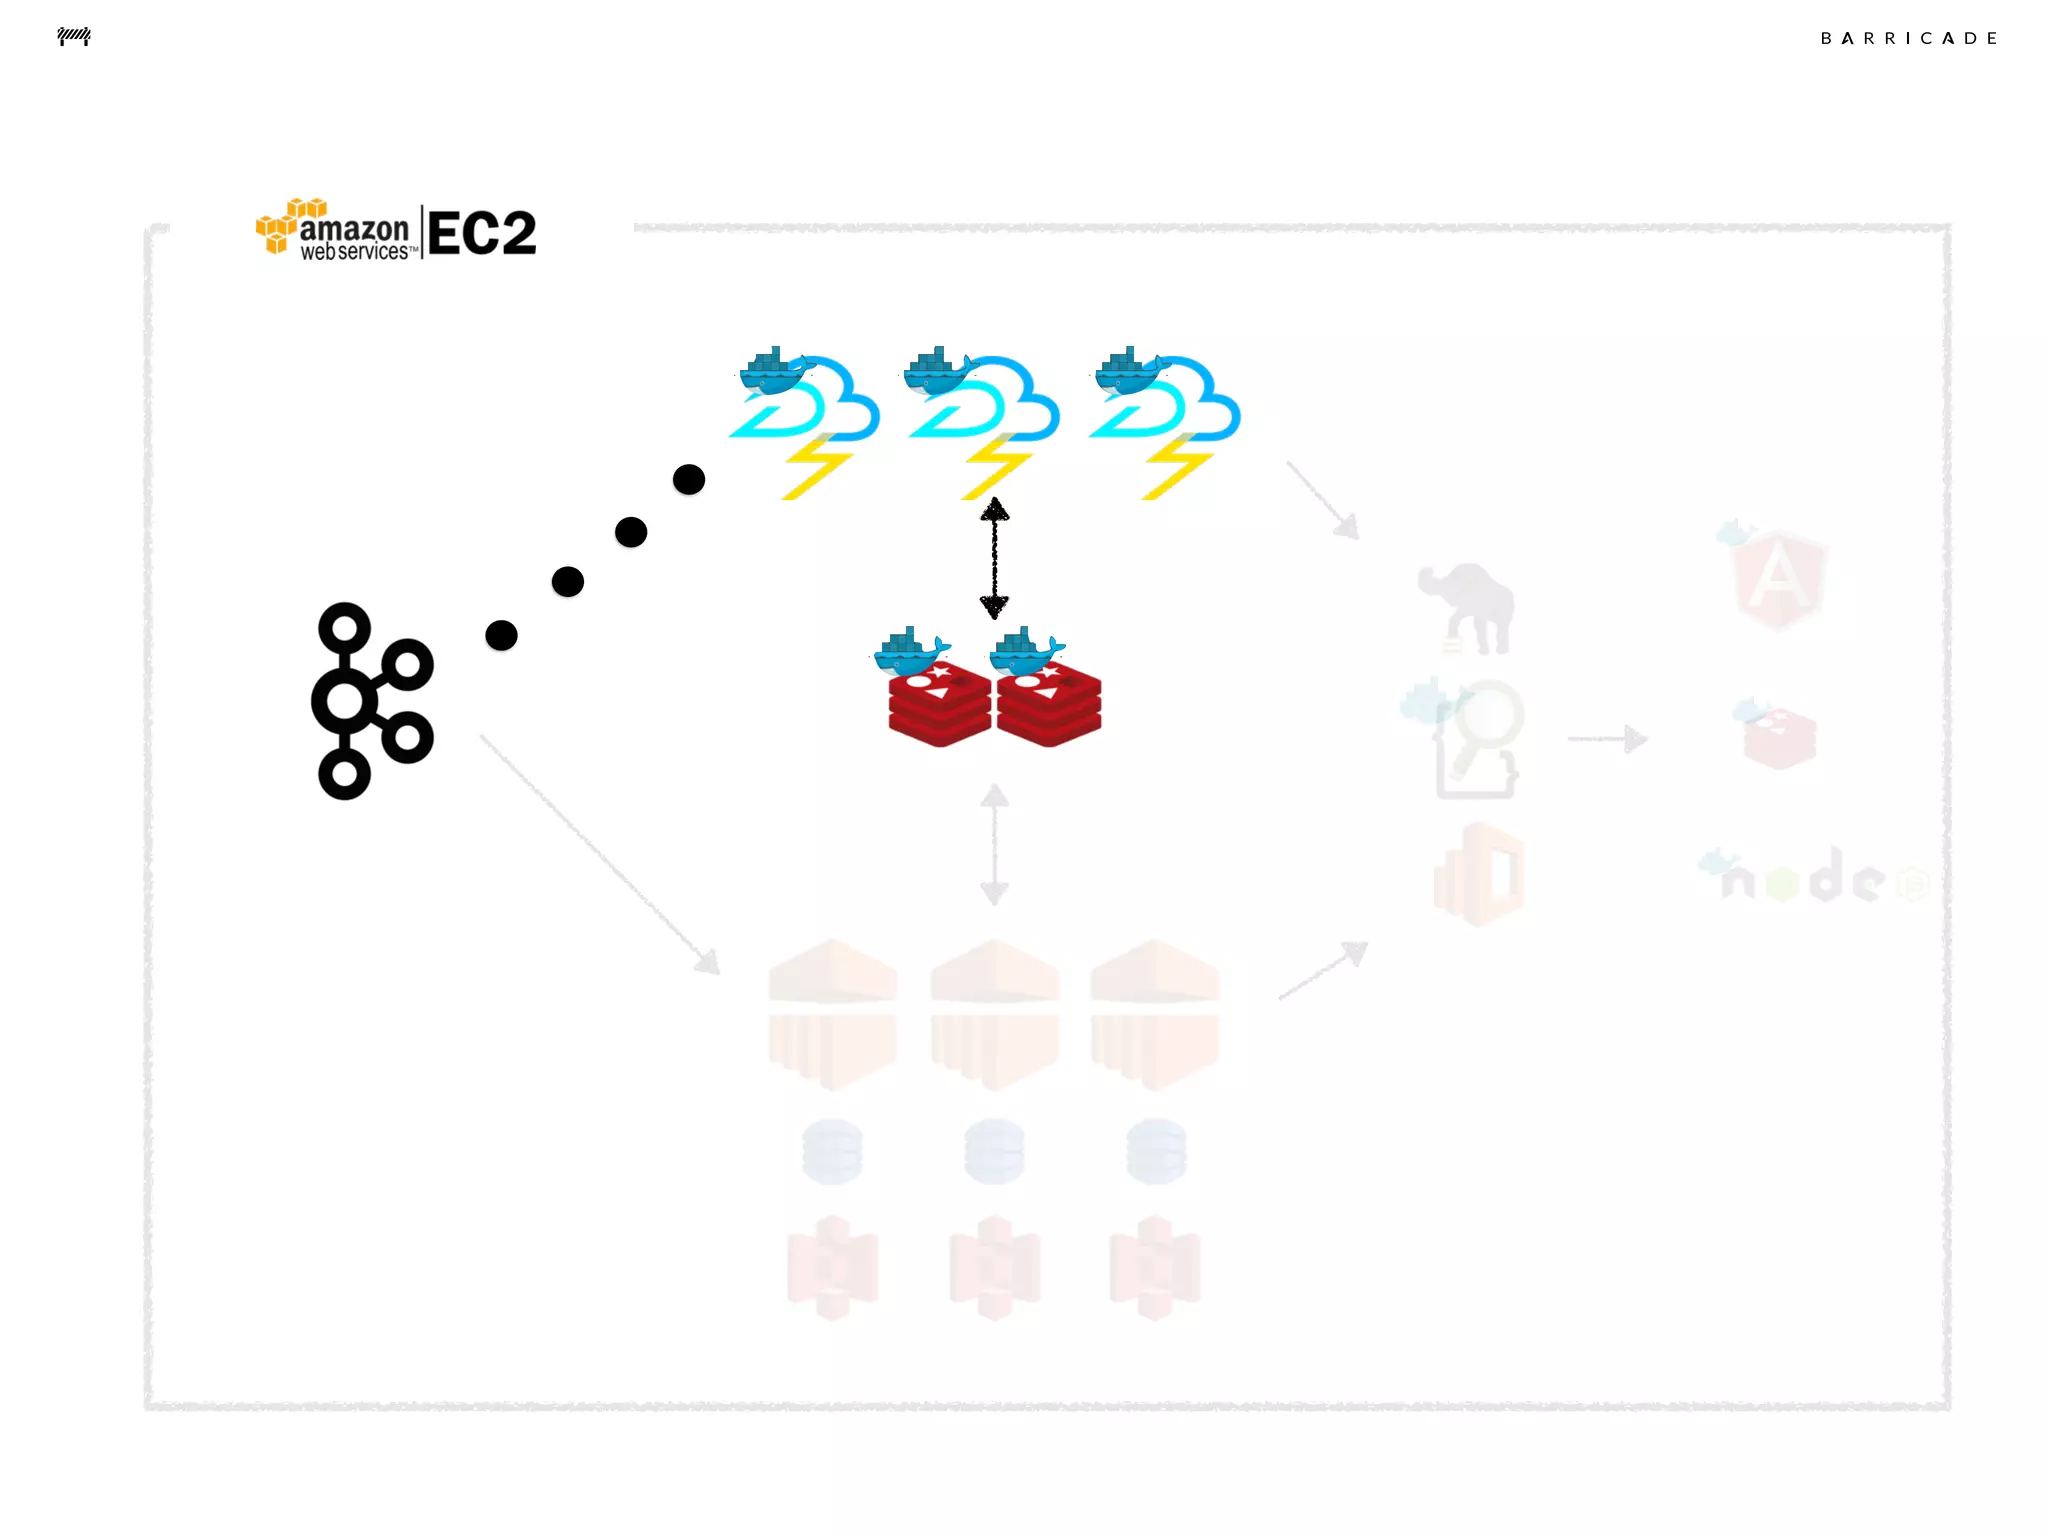
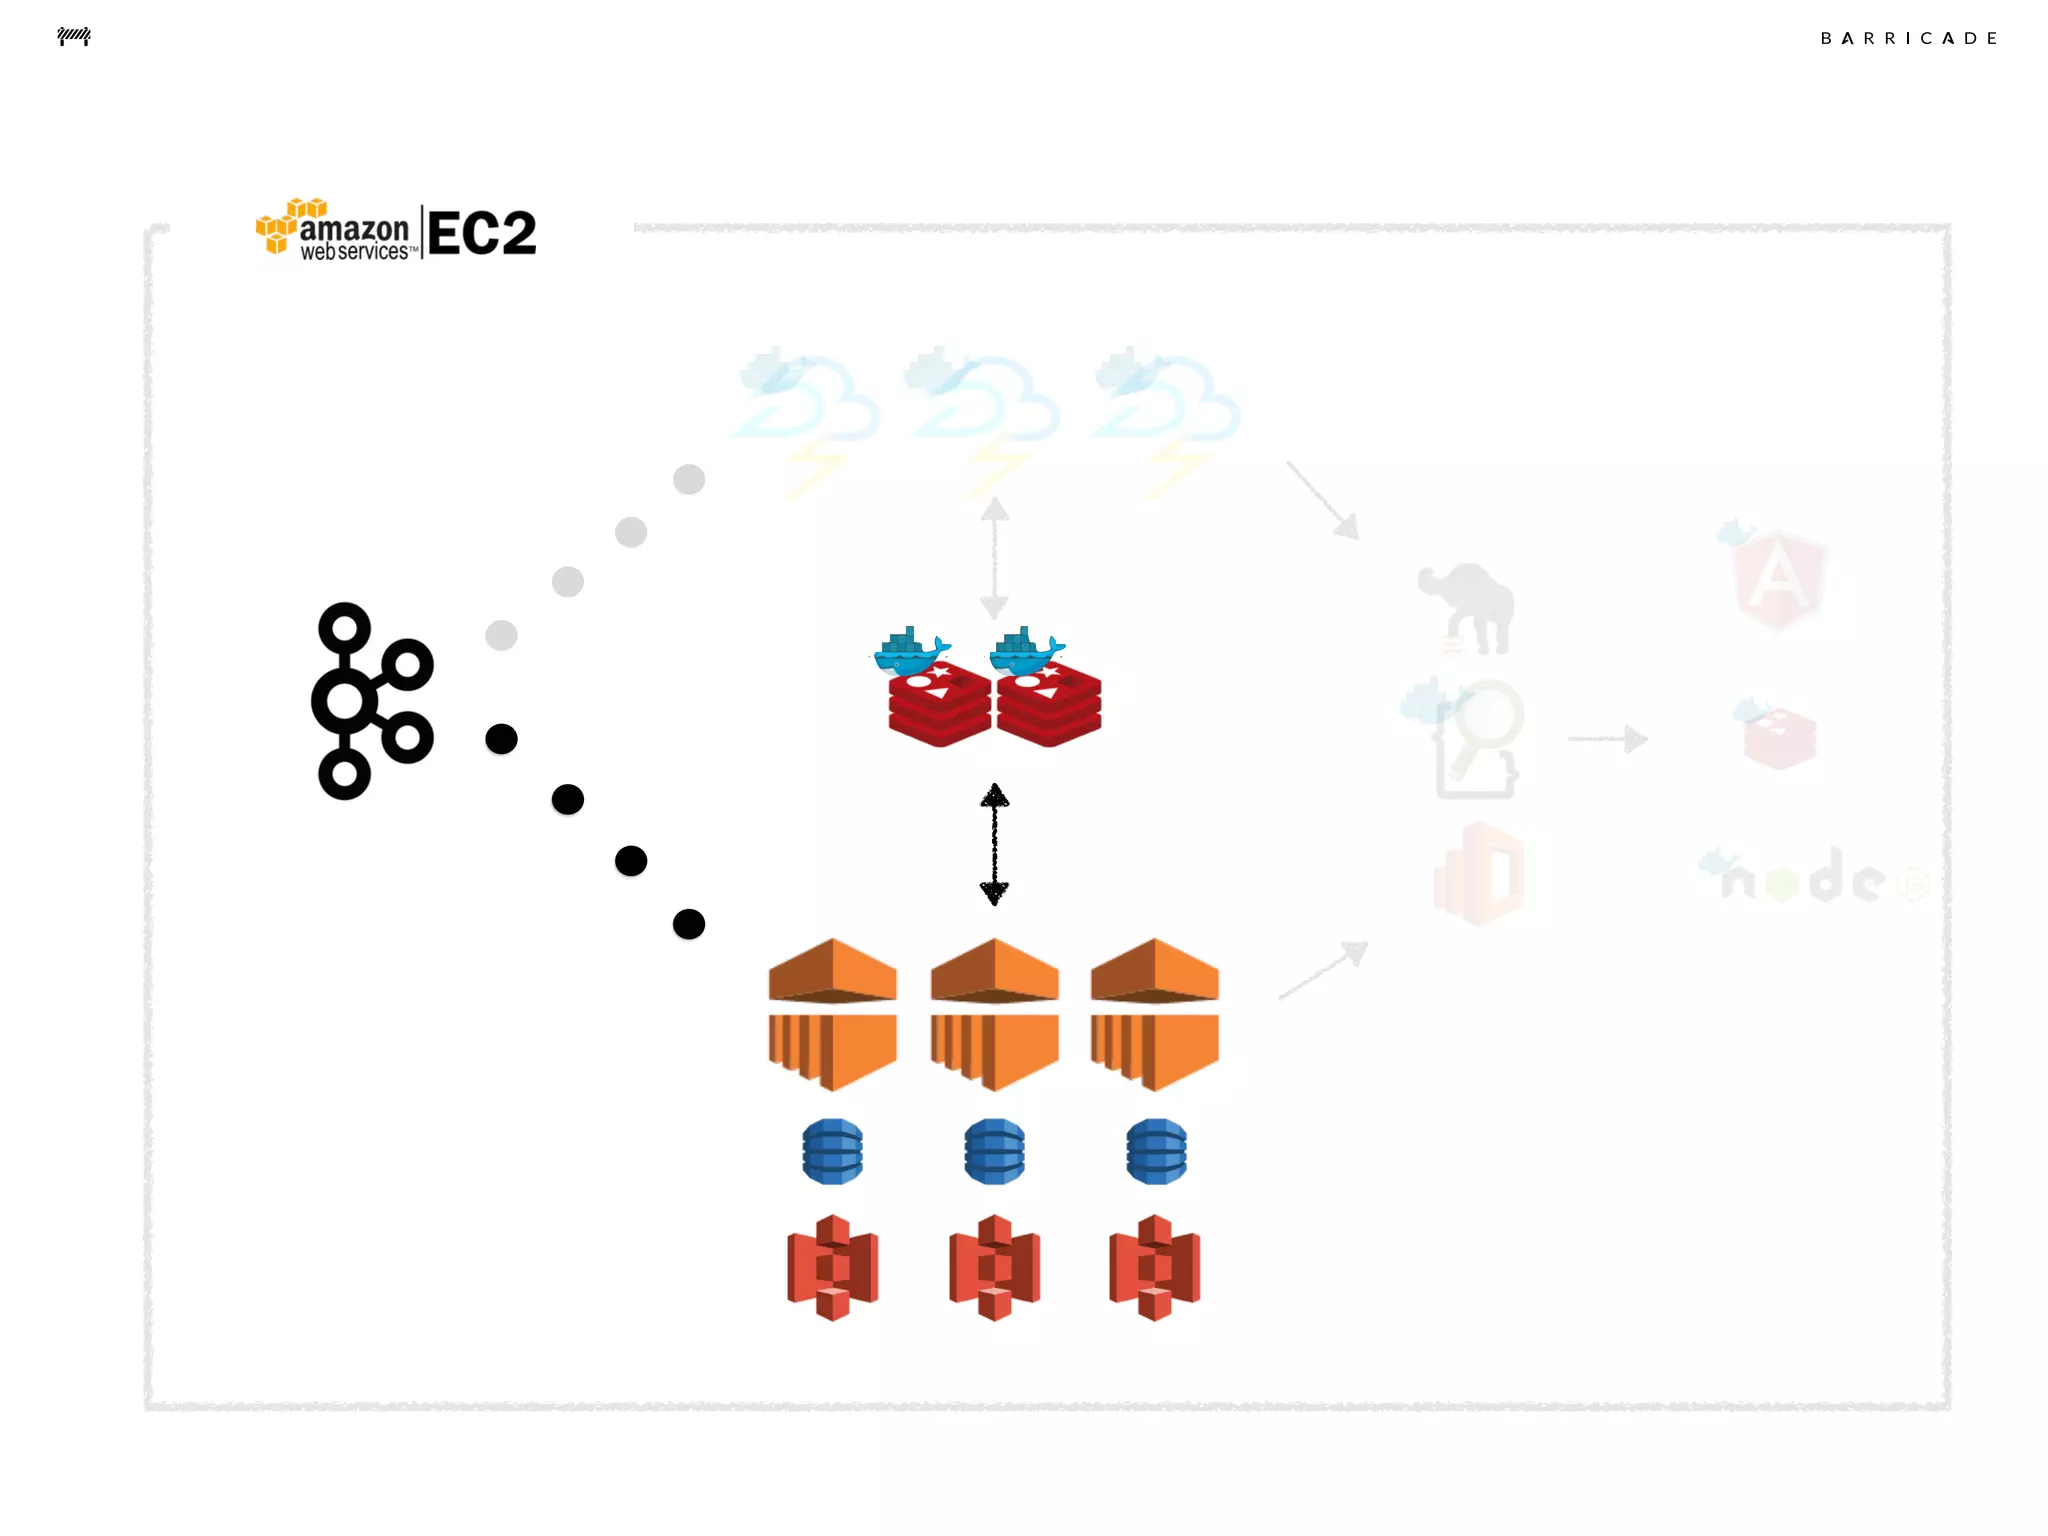
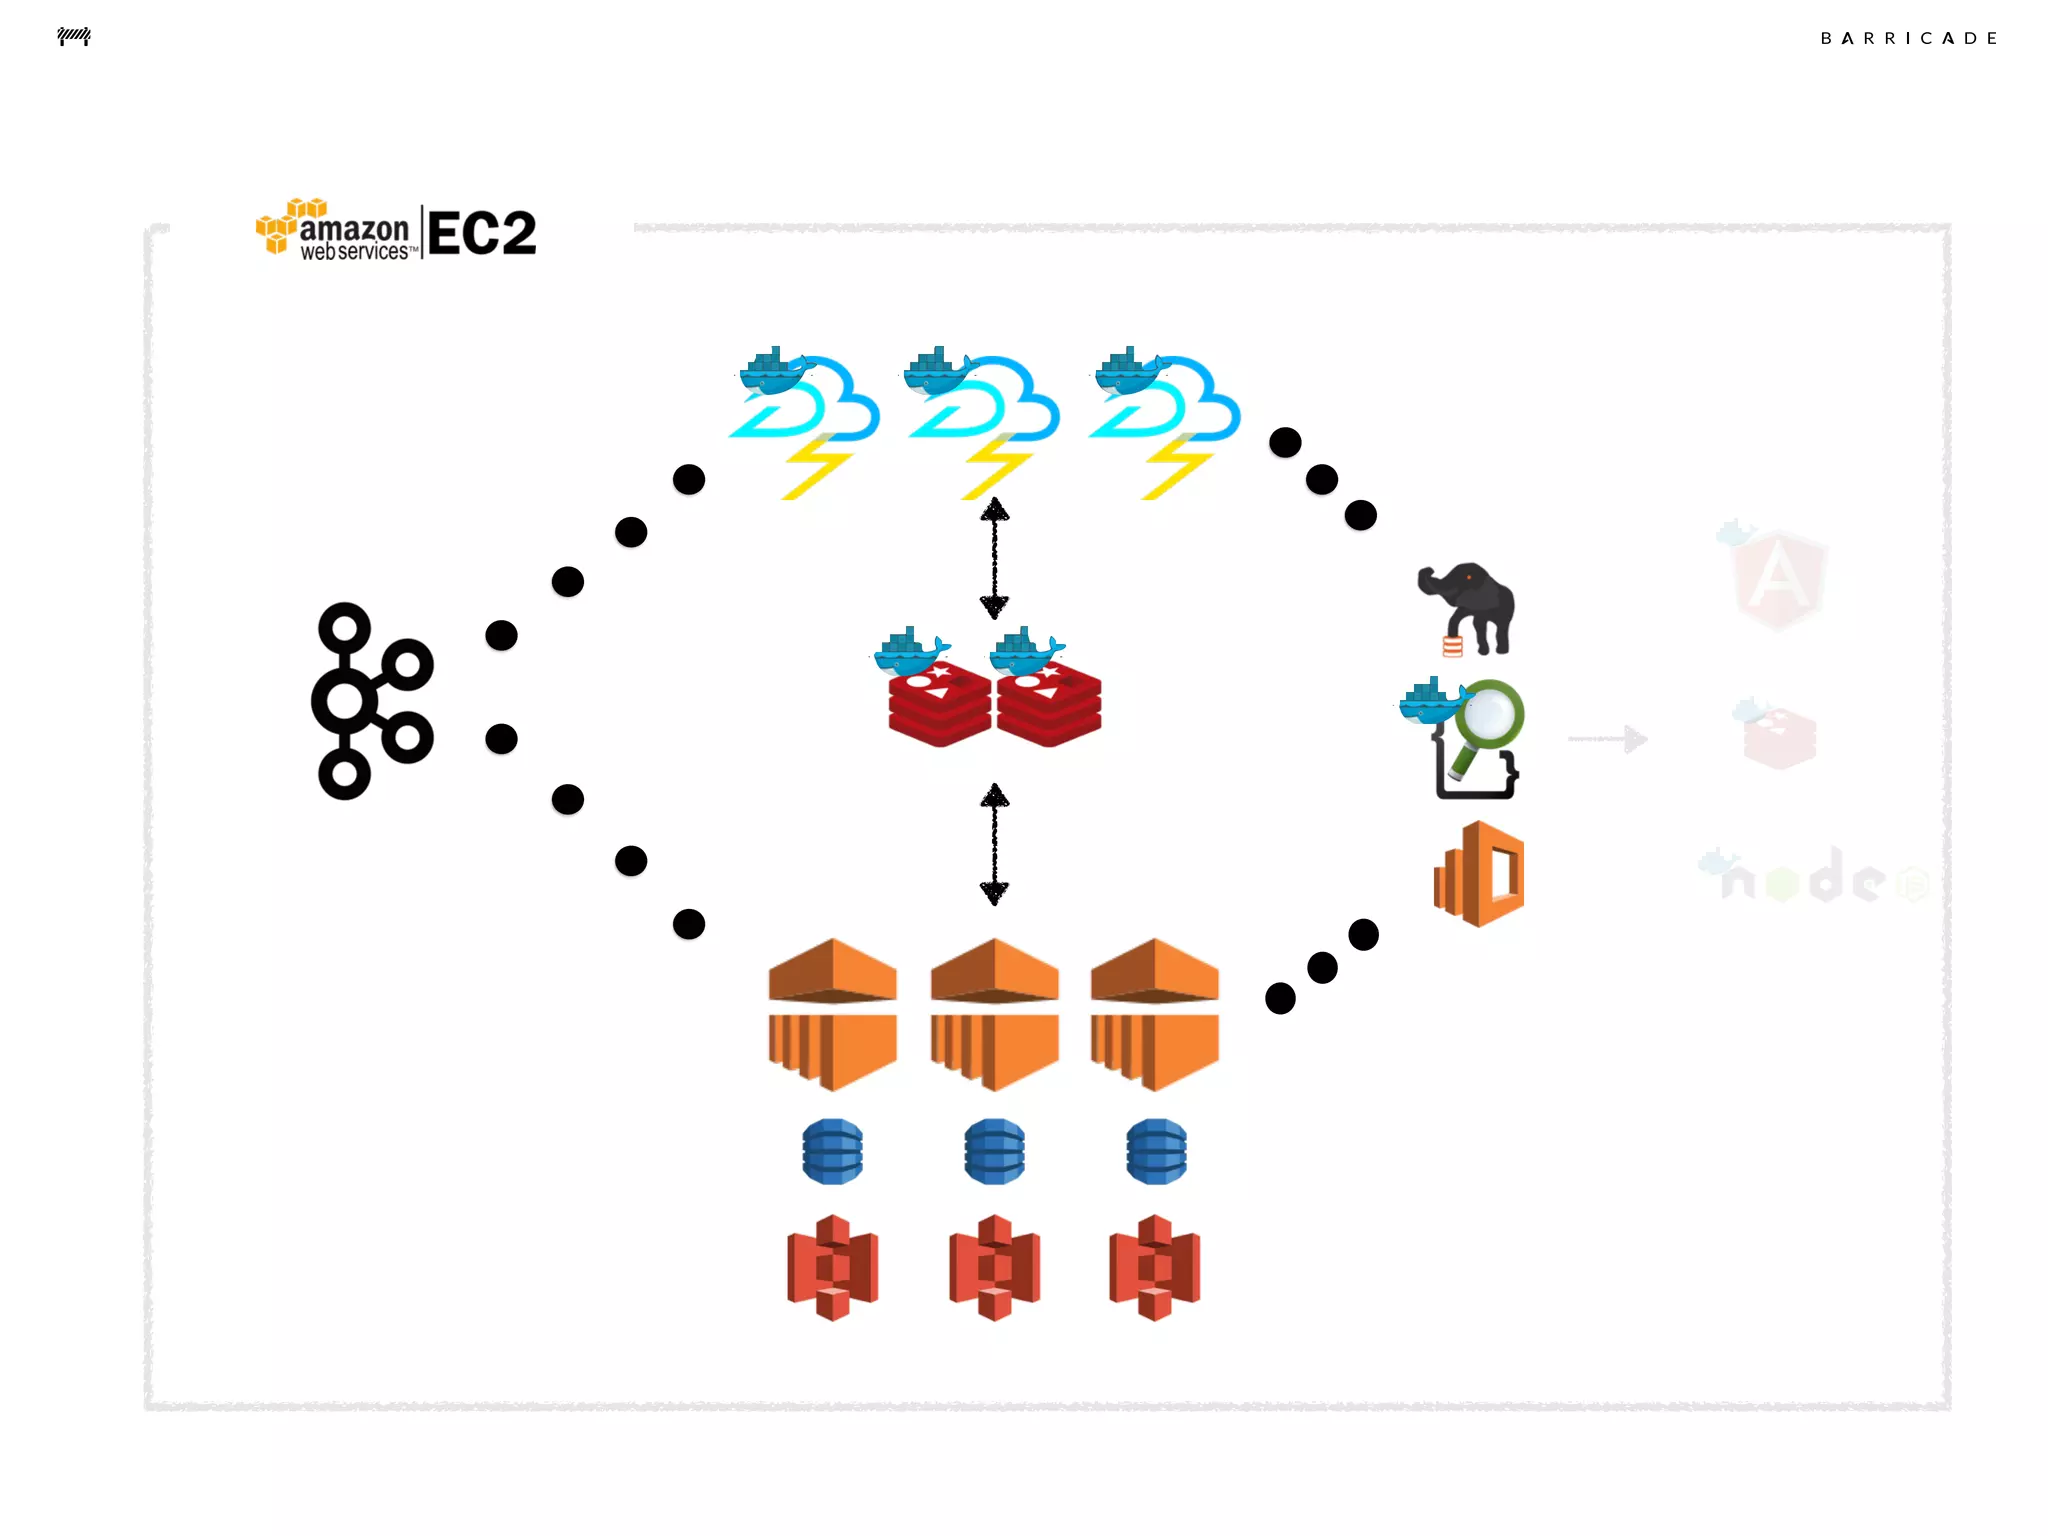
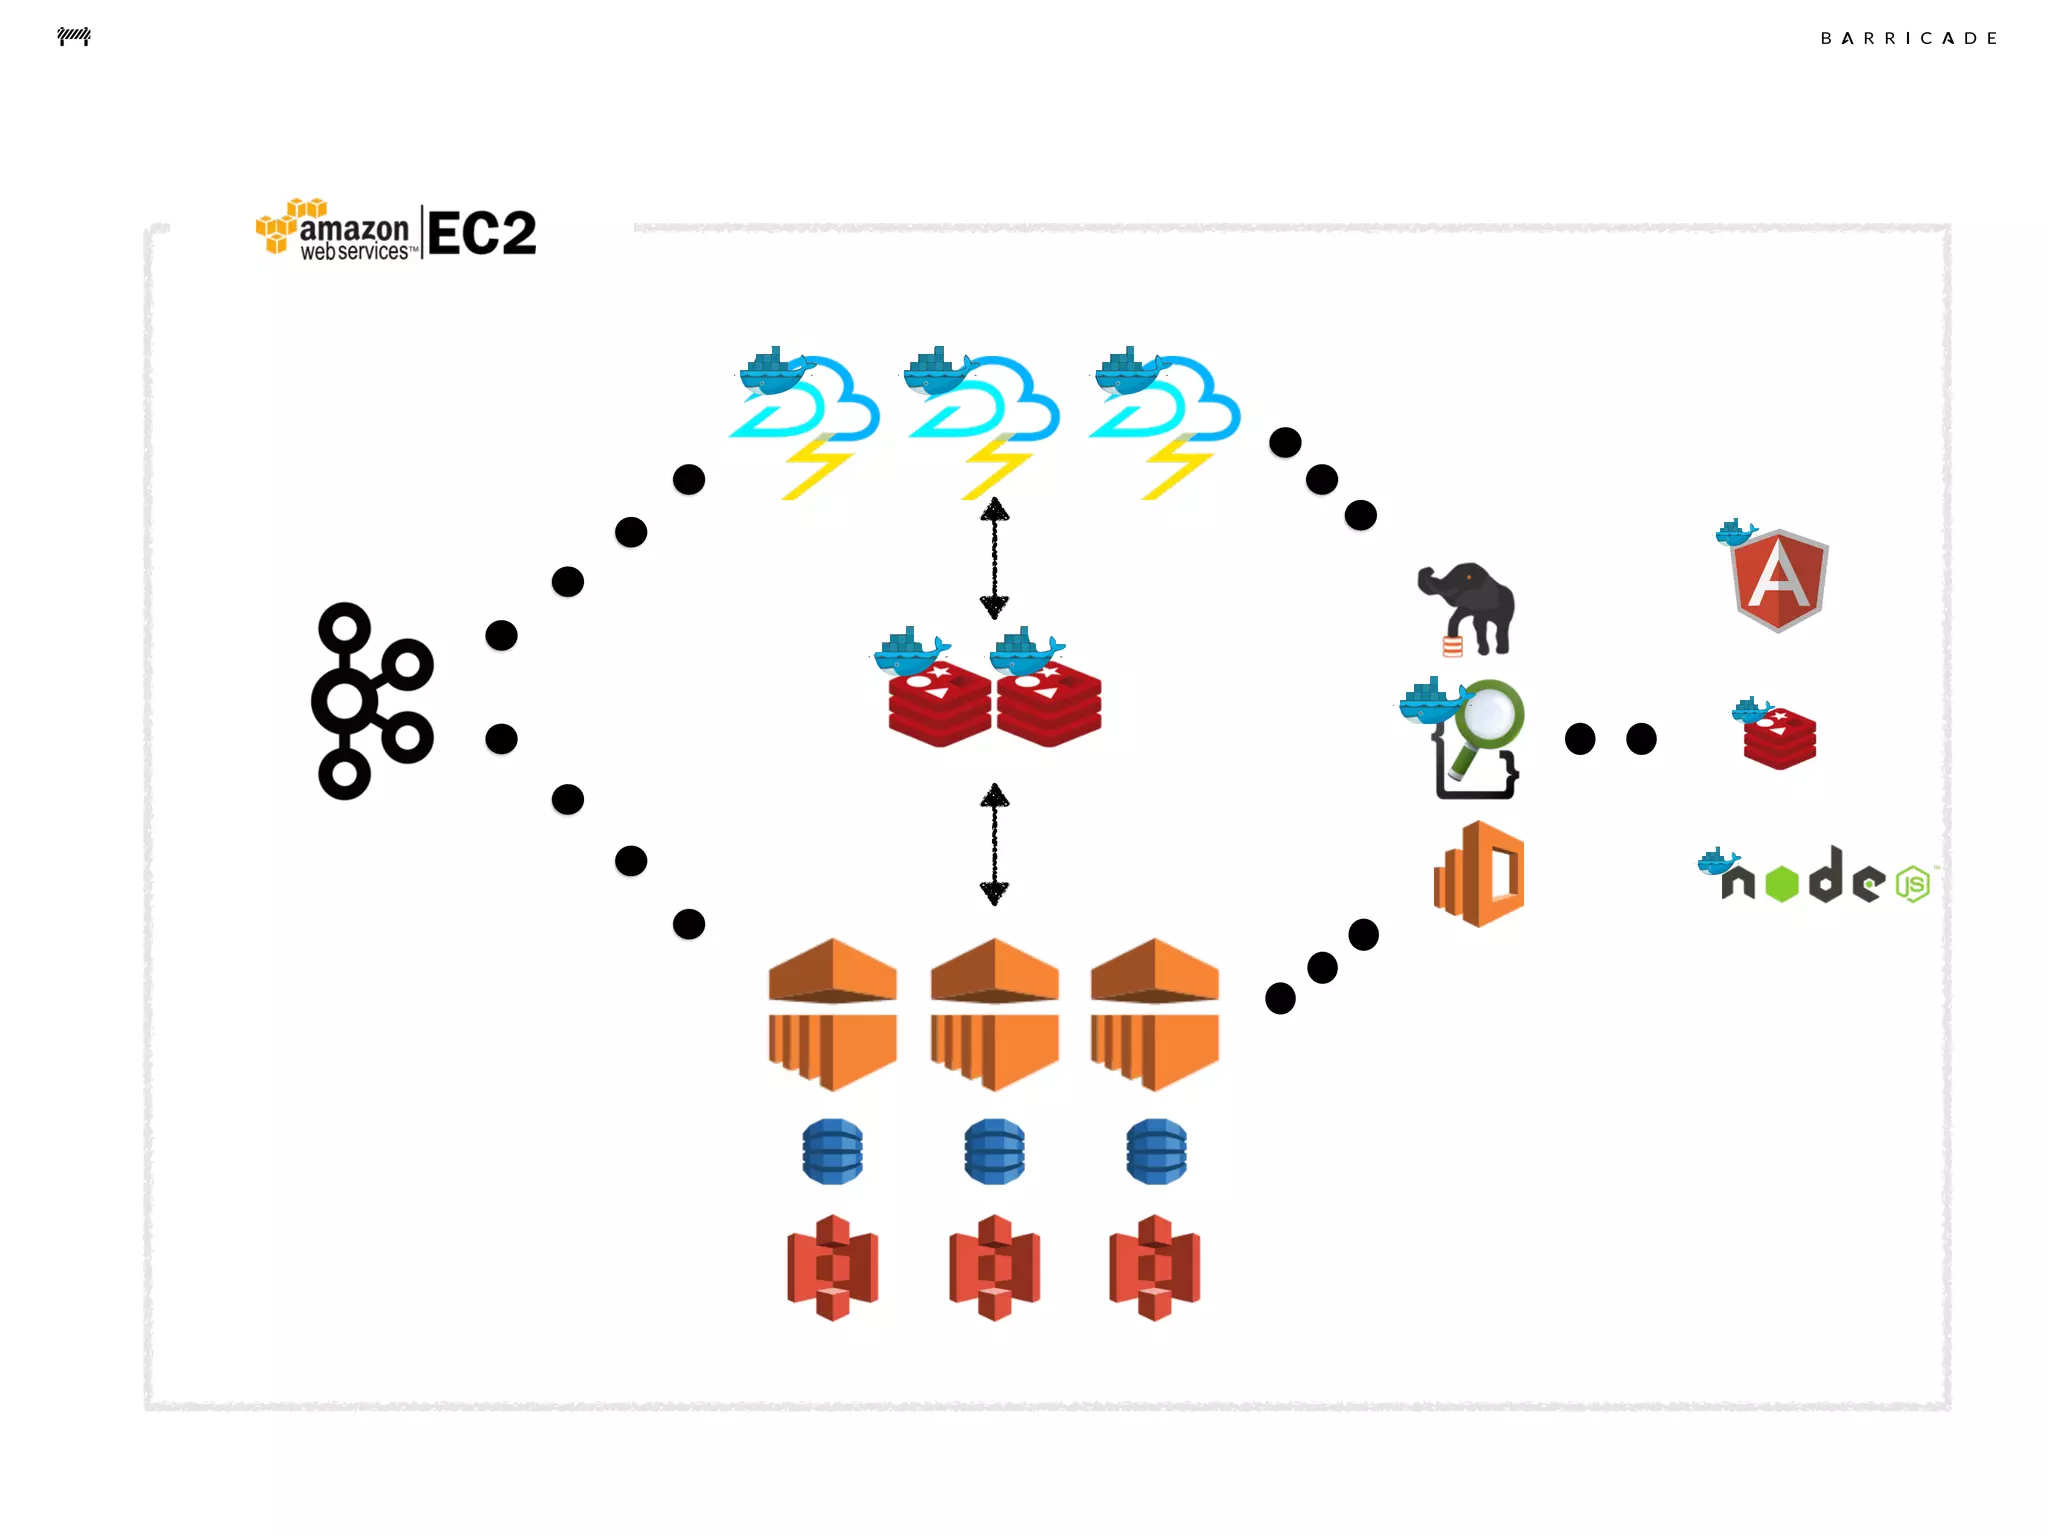
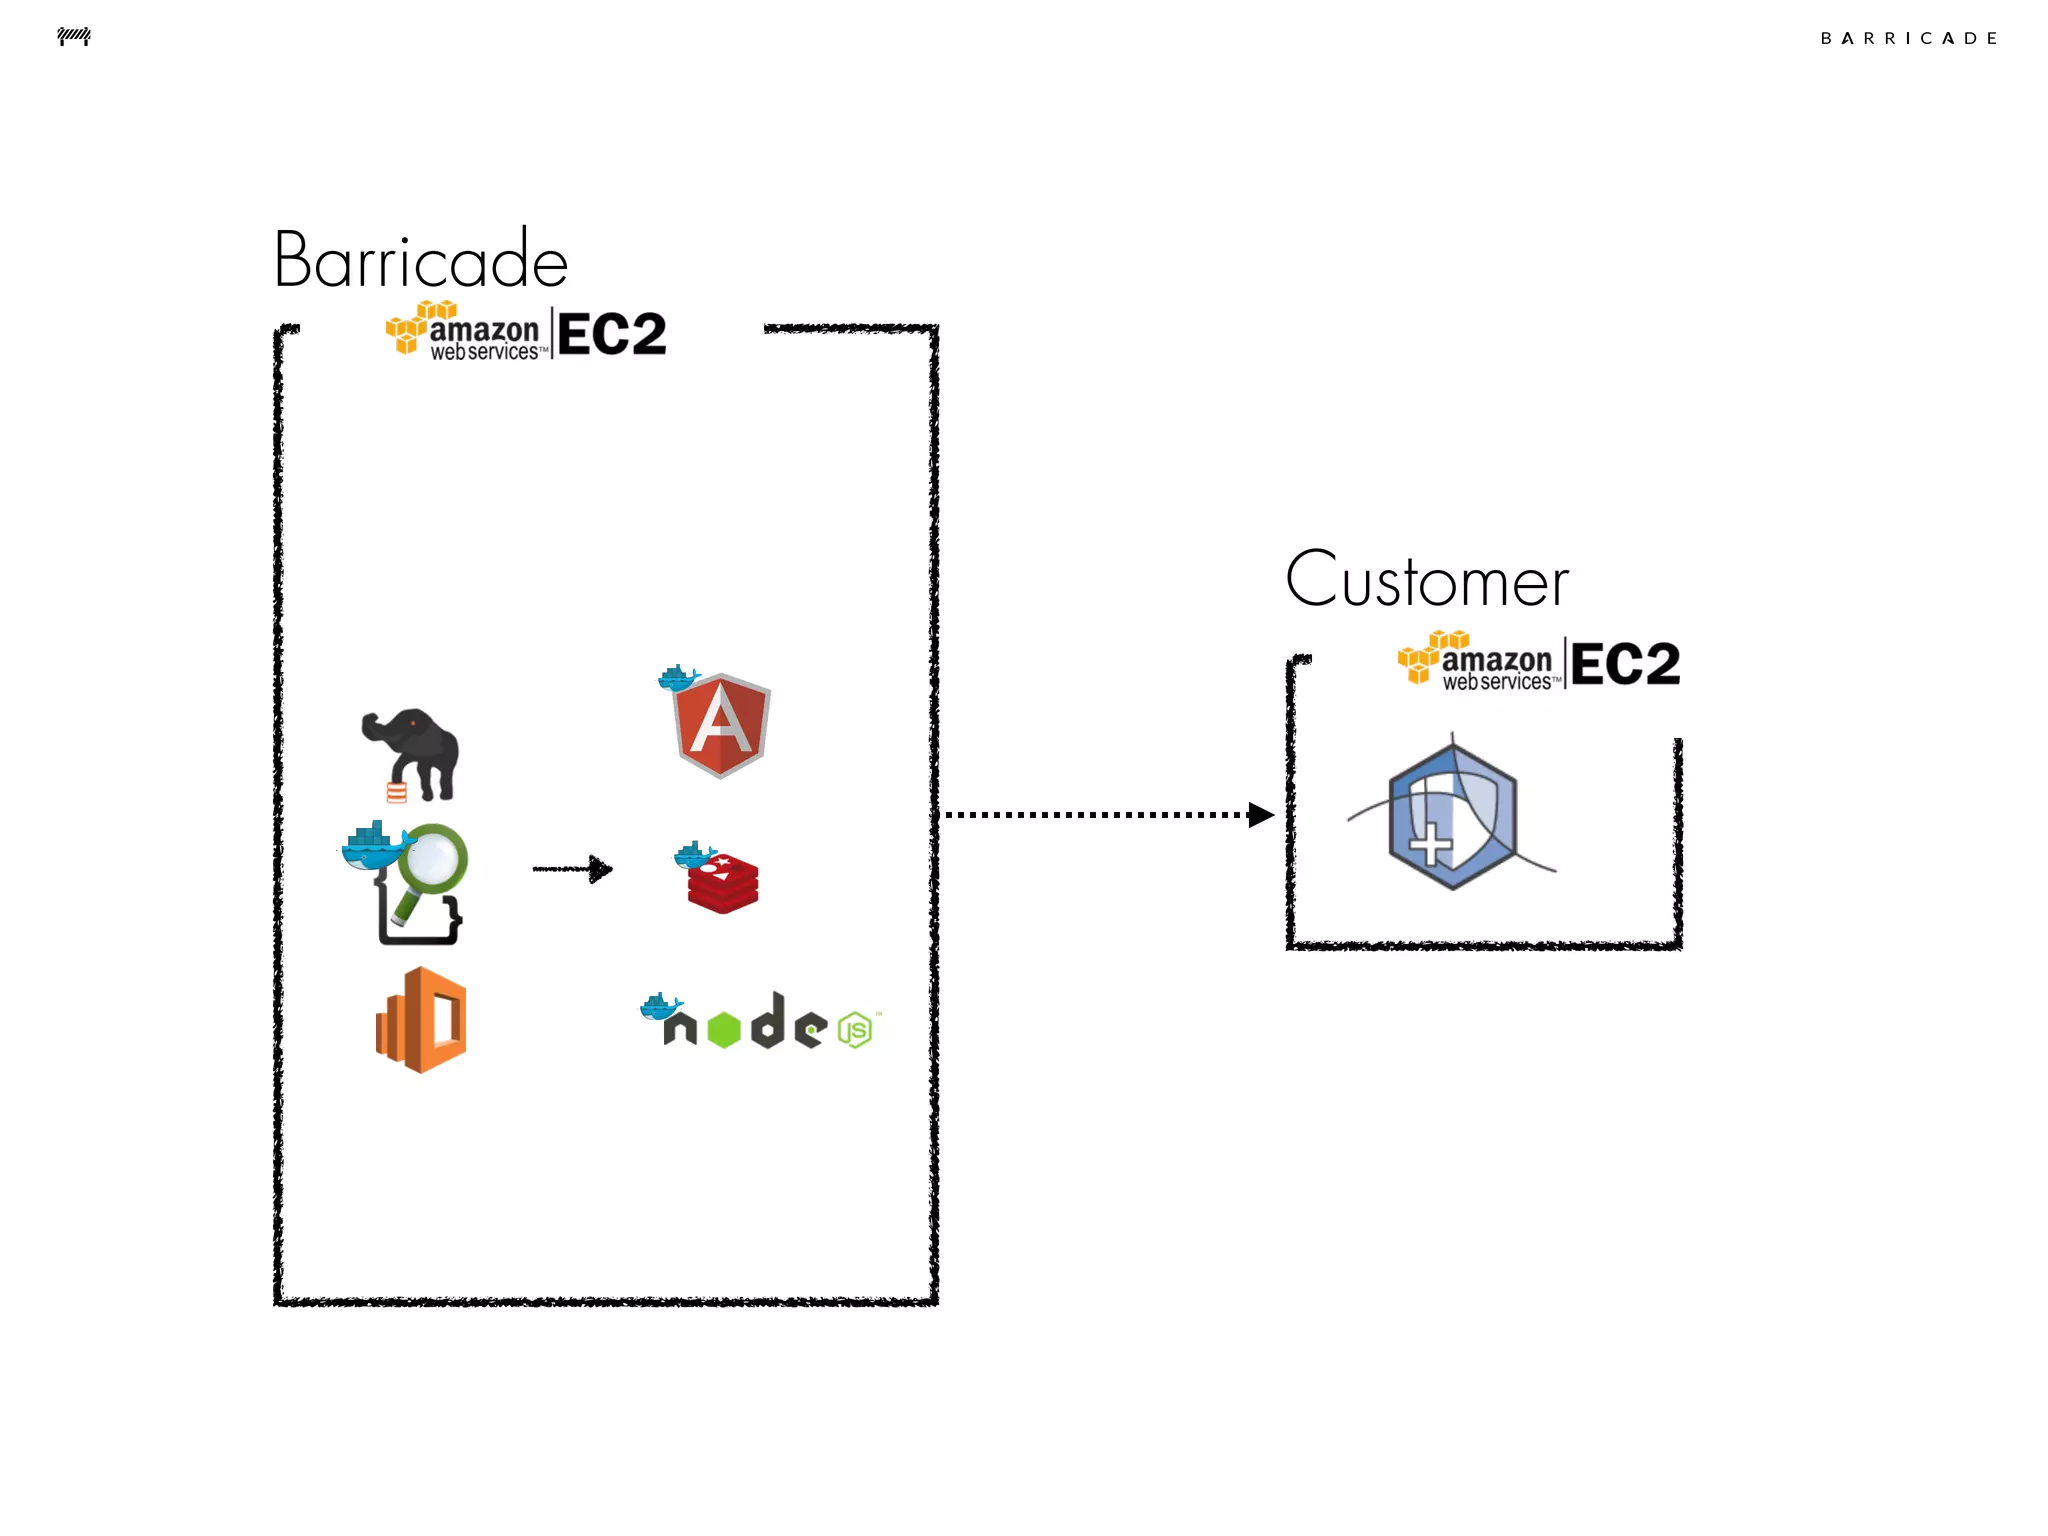


The document discusses the challenges of data science, emphasizing the need for data hacking, analysis, and expertise while maintaining focus on purpose. It outlines a pragmatic approach involving questioning, analyzing data, and sharing findings within a collaborative team structure, particularly in the context of fraud prevention. The author highlights the complexities of scaling data science at barricade.io, mentioning the use of lambda architecture and distributed messaging systems for effective data handling.


![Smseminar2304 [kompatibilitetsmodus]](https://cdn.slidesharecdn.com/ss_thumbnails/smseminar2304kompatibilitetsmodus-100426060004-phpapp01-thumbnail.jpg?width=640&height=640&fit=bounds)


![[DSC Europe 25] Goran Obradovic - The Rise of Sovereign AI: Building the Regi...](https://cdn.slidesharecdn.com/ss_thumbnails/7nw2xxixrxqdxvrb5wca-6-251205085714-ab09a2ac-thumbnail.jpg?width=640&height=640&fit=bounds)


![[DSC Europe 25] Dragana Ilic - AI for Big Data in Astronomy.pptx](https://cdn.slidesharecdn.com/ss_thumbnails/8palya86qaatvjhva1ms-2-dragana-ilic-ai-ilic-251208151906-652b819c-thumbnail.jpg?width=640&height=640&fit=bounds)


![[DSC Europe 25] Nikola Rajovic - Hardware Technologies Under the Hood: RISC-V...](https://cdn.slidesharecdn.com/ss_thumbnails/o2gptrmtoyqndgoshwgq-dsc2025-tenstorrent-rajovic-251205090438-814685f5-thumbnail.jpg?width=640&height=640&fit=bounds)


![[DSC Europe 25] Jim Sterne - Adopting Generative AI Capabilities Into the Ent...](https://cdn.slidesharecdn.com/ss_thumbnails/sxhpofuorcagxsaulkmt-3-251204082258-7e66bc48-thumbnail.jpg?width=640&height=640&fit=bounds)


![[DSC Europe 25] Dragan Vucic - Building the Learning Organization - How AI Tr...](https://cdn.slidesharecdn.com/ss_thumbnails/8brigo2sbu6qur6gxrra-7-251205085715-6ae07d24-thumbnail.jpg?width=640&height=640&fit=bounds)