Download to read offline

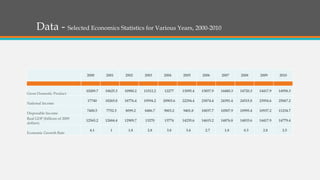


Gross domestic product, national income, disposable income, and real GDP all gradually increased from 2000 to 2010, with the exception of 2009 which saw a slight decrease due to the Great Recession. The economic growth rate peaked in 2000 at 4.1% before declining to a low of 1% in 2001 and then steadily increasing until reaching 3.8% in 2004, after which it gradually decreased to a low of 0.3% in 2008 during the Great Recession.


![Experiencing a new turning point - akkizidis s. nikolaos presentation [part-1]](https://cdn.slidesharecdn.com/ss_thumbnails/experiencinganewturningpoint-akkizidiss-180513213810-thumbnail.jpg?width=640&height=640&fit=bounds)


