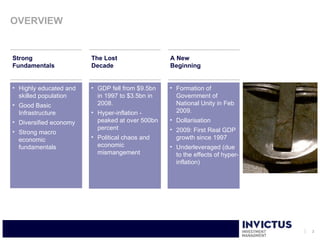
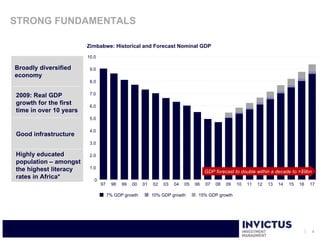
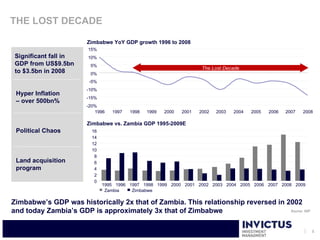
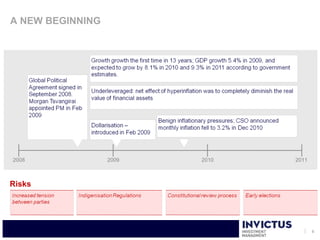
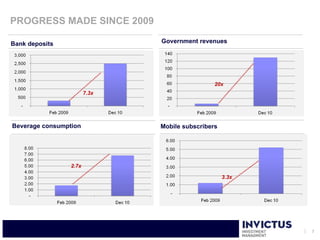
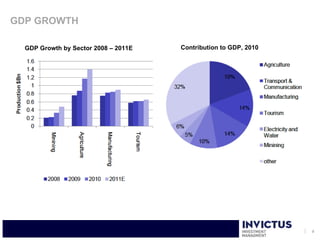
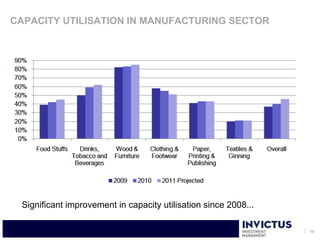
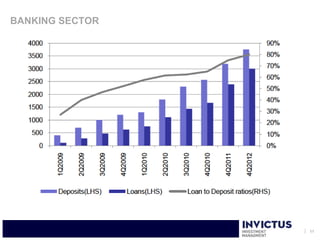
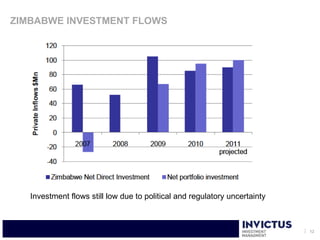
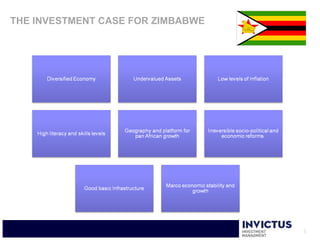
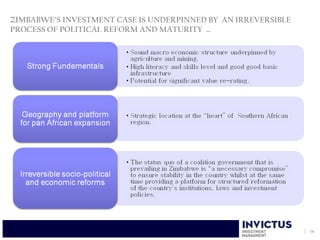
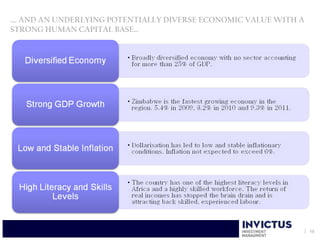
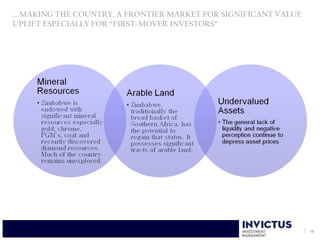
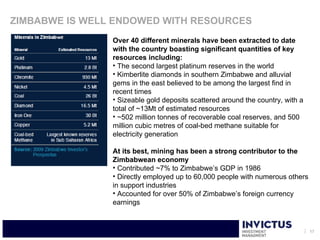
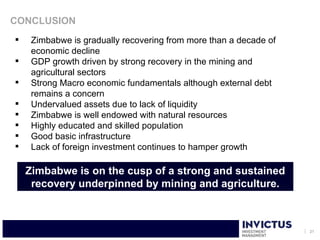
AFRICA RESOURCES
INVESTMENT CONGRESS
         The Zimbabwe investment opportunity
         Ritesh Anand –Invictus Asset Management


IRONMONGERS’ HALL, CITY OF LONDON ● TUESDAY-WEDNESDAY, 14-15 JUN
   2011
www.ObjectiveCapitalConferences.com                                1
Investment Landscape in Zimbabwe
       “A Fund Managers Perspective”


                           25 March 2011   Ritesh Anand
OVERVIEW


Strong                  The Lost                 A New
Fundamentals            Decade                   Beginning


• Highly educated and   • GDP fell from $9.5bn   • Formation of
  skilled population      in 1997 to $3.5bn in     Government of
• Good Basic              2008.                    National Unity in Feb
  Infrastructure        • Hyper-inflation -        2009.
• Diversified economy     peaked at over 500bn   • Dollarisation
                          percent                • 2009: First Real GDP
• Strong macro
  economic              • Political chaos and      growth since 1997
  fundamentals            economic               • Underleveraged (due
                          mismangement             to the effects of hyper-
                                                   inflation)


                                                                              3
STRONG FUNDAMENTALS

                        Zimbabwe: Historical and Forecast Nominal GDP
                        10.0

Broadly diversified      9.0
economy
                         8.0


2009: Real GDP           7.0

growth for the first     6.0
time in over 10 years
                         5.0

                         4.0
Good infrastructure
                         3.0

Highly educated          2.0
population – amongst
the highest literacy     1.0
                                                                                  GDP forecast to double within a decade to >$9bn
rates in Africa*           0
                               97    98   99   00   01   02   03   04   05   06   07   08   09   10   11   12   13   14   15   16   17

                                    7% GDP growth        10% GDP growth       15% GDP growth


                                                                                                                                    4
THE LOST DECADE

                       Zimbabwe YoY GDP growth 1996 to 2008
                       15%
 Significant fall in   10%
 GDP from US$9.5bn      5%
                                                                     The Lost Decade
 to $3.5bn in 2008      0%
                        -5%
                       -10%
 Hyper Inflation
                       -15%
 – over 500bn%
                       -20%
                          1996   1997   1998   1999   2000   2001   2002   2003   2004   2005   2006   2007   2008

                       Zimbabwe vs. Zambia GDP 1995-2009E
 Political Chaos         16
                         14
                         12
                         10
                          8
 Land acquisition         6
 program                  4
                          2
                          0
                              1995 1996 1997 1998 1999 2000 2001 2002 2003 2004 2005 2006 2007 2008 2009
                               Zambia    Zimbabwe

Zimbabwe’s GDP was historically 2x that of Zambia. This relationship reversed in 2002
and today Zambia’s GDP is approximately 3x that of Zimbabwe                       Source: IMF


                                                                                                                 5
A NEW BEGINNING


2008              2009   2010   2011


Risks


                                       6
PROGRESS MADE SINCE 2009

Bank deposits                  Government revenues


                                                20x
                        7.3x


Beverage consumption           Mobile subscribers


                 2.7x

                                                    3.3x


                                                           7
MACRO ECONOMIC INDICATORS
 KEY DATA AND FORECASTS


Real economy                         2008    2009    2010E    2011E    2012E
Nominal GDP               $bn        4.96    5.62     6.72     8.08     9.32
Real GDP Growth           YoY, %     -14.8    5.6      8.1      9.3      9.5
GDP per capita            $           423     479      573      689      794
External sector
Trade balance             % of GDP   -19.6   -28.8    -15.2    -14.7    -12.9
Current account balance   % of GDP   -15.7   -16.5    -15.5    -10.6     -9.6
Fiscal sector
Government revenue        % of GDP    3.3      22     32.1     33.4     33.5
Government expenditure    % of GDP    6.4      25       29       31     32.1
Government balance        % of GDP    -3.1    -2.8     -3.1     -2.4     -1.4
Government gross debt     % of GDP    108     110       95       83       76
Monetary policy
Inflation                 %YoY, YE    n/a     -7.7     3.5      5.4      6.1


                                                                                8
GDP GROWTH

  GDP Growth by Sector 2008 – 2011E   Contribution to GDP, 2010


                                                                  9
CAPACITY UTILISATION IN MANUFACTURING SECTOR


 Significant improvement in capacity utilisation since 2008...

                                                                 10
BANKING SECTOR


                 11
ZIMBABWE INVESTMENT FLOWS


   Investment flows still low due to political and regulatory uncertainty


                                                                            12
THE INVESTMENT CASE FOR ZIMBABWE
ZIMBABWE’S INVESTMENT CASE IS UNDERPINNED BY AN IRREVERSIBLE
PROCESS OF POLITICAL REFORM AND MATURITY …


                                                               14
…. AND AN UNDERLYING POTENTIALLY DIVERSE ECONOMIC VALUE WITH A
STRONG HUMAN CAPITAL BASE…


                                                                 15
….MAKING THE COUNTRY, A FRONTIER MARKET FOR SIGNIFICANT VALUE
UPLIFT ESPECIALLY FOR “FIRST-MOVER INVESTORS”


                                                                16
ZIMBABWE IS WELL ENDOWED WITH RESOURCES
                Over 40 different minerals have been extracted to date
                with the country boasting significant quantities of key
                resources including:
                • The second largest platinum reserves in the world
                • Kimberlite diamonds in southern Zimbabwe and alluvial
                gems in the east believed to be among the largest find in
                recent times
                • Sizeable gold deposits scattered around the country, with a
                total of ~13Mt of estimated resources
                • ~502 million tonnes of recoverable coal reserves, and 500
                million cubic metres of coal-bed methane suitable for
                electricity generation

                At its best, mining has been a strong contributor to the
                Zimbabwean economy
                • Contributed ~7% to Zimbabwe’s GDP in 1986
                • Directly employed up to 60,000 people with numerous others
                in support industries
                • Accounted for over 50% of Zimbabwe’s foreign currency
                earnings


                                                                                17
ZIMBABWE STOCK EXCHANGE

The ZSE is a relatively well established, tradable,
well regulated exchange by regional standards
                                                             ZSE Market Cap U$ Billion

    Market Cap    $4.41bln USD (June 2011)


 Average Daily
                  $2.8mln (5 months of 2011)
        Trade

    Settlement    Settlement risk exists because of the
          Risk    use of physical scrip and the lack of a
                  meaningful guarantee fund. The
                  leading custodians, Stanbic,
                  however, is internationally reputable.
                                                             Top Ten Companies by Market Cap ( Aug 10)

    Exploration   Despite a perceived lack of
          Risk    ownership rights within Zimbabwe
                  this has primarily been limited to
                  farmland, and mineral rights to a
                  lesser degree. Indigenization
                  legislation will eventually be mitigated
                  through a compromise agreement.


                                                                                                         18
ZIMBABWE STOCK EXCHANGE (ZSE)

SSA 2009 data

                       Turnover      Market cap      GDP     Market cap   Turnover %
            Country       ($mn)           ($mn)      ($bn)      to GDP      of market
      Botswana-DCI                        4,278         11         40%            n/a
              Kenya         477          10,503         30         35%            5%
             Malawi          20           1,477          5         30%            1%
           Mauritius        347           5,028          9         55%            7%
            Namibia                         940          9         10%            n/a
             Nigeria      4,091          32,739        165         20%           12%
                 SA     331,289         799,065        277        288%           41%
           Tanzania          37           3,830         22         17%            1%
            Uganda            9           3,751         15         24%            0%
             Zambia          44           5,273         14         38%            1%
         Zimbabwe*          571           4,186      3.556        118%           14%


Zimbabwe: 3rd Largest Market in SSA by market volumes in 2009


                                                                                   19
KEY CONCERNS

    Political Uncertainty
    Early elections – without a clear roadmap for elections
    External Debt
    Wage Pressures
    Supply side constraints – mainly power
    Insufficient foreign investment
    Concerns around Indigenisation
    Skills drain


                                                               20
CONCLUSION
    Zimbabwe is gradually recovering from more than a decade of
     economic decline
    GDP growth driven by strong recovery in the mining and
     agricultural sectors
    Strong Macro economic fundamentals although external debt
     remains a concern
    Undervalued assets due to lack of liquidity
    Zimbabwe is well endowed with natural resources
    Highly educated and skilled population
    Good basic infrastructure
    Lack of foreign investment continues to hamper growth

    Zimbabwe is on the cusp of a strong and sustained
     recovery underpinned by mining and agriculture.


                                                                   21
BACKGROUND TO INVICTUS INVESTMENT
MANAGEMENT
Invictus Investment Management Group (IIMG) was established
in 2010 by Ritesh Anand, with a goal of building a world class,
enduring investment advisory and management business focussed
on sub-Saharan Africa. Invictus Capital will initially focus
corporate advisory and capital raising in Zimbabwe, primarily in
the mining sector. Invictus Investments will focus on both listed
and unlisted investment opportunities in Zimbabwe. Ritesh Anand
has over 12 years international investment experience including 7
years at the world’s leading medical research endowment, the
Wellcome Trust. Invictus Investments’ investment philosophy is to
create long-term value through rigorous analysis and thorough due
diligence. Our investment process will incorporate risk
management into every investment decision, using both qualitative
and quantitative approaches. IIM has a successful track record of
investing in Zimbabwe and has built a strong team of investment
partners who will be based on the ground in Zimbabwe.


                                                                    22
THANK YOU


            23

The Zimbabwe investment opportunity

  • 1.
    AFRICA RESOURCES INVESTMENT CONGRESS The Zimbabwe investment opportunity Ritesh Anand –Invictus Asset Management IRONMONGERS’ HALL, CITY OF LONDON ● TUESDAY-WEDNESDAY, 14-15 JUN 2011 www.ObjectiveCapitalConferences.com 1
  • 2.
    Investment Landscape inZimbabwe “A Fund Managers Perspective” 25 March 2011 Ritesh Anand
  • 3.
    OVERVIEW Strong The Lost A New Fundamentals Decade Beginning • Highly educated and • GDP fell from $9.5bn • Formation of skilled population in 1997 to $3.5bn in Government of • Good Basic 2008. National Unity in Feb Infrastructure • Hyper-inflation - 2009. • Diversified economy peaked at over 500bn • Dollarisation percent • 2009: First Real GDP • Strong macro economic • Political chaos and growth since 1997 fundamentals economic • Underleveraged (due mismangement to the effects of hyper- inflation) 3
  • 4.
    STRONG FUNDAMENTALS Zimbabwe: Historical and Forecast Nominal GDP 10.0 Broadly diversified 9.0 economy 8.0 2009: Real GDP 7.0 growth for the first 6.0 time in over 10 years 5.0 4.0 Good infrastructure 3.0 Highly educated 2.0 population – amongst the highest literacy 1.0 GDP forecast to double within a decade to >$9bn rates in Africa* 0 97 98 99 00 01 02 03 04 05 06 07 08 09 10 11 12 13 14 15 16 17 7% GDP growth 10% GDP growth 15% GDP growth 4
  • 5.
    THE LOST DECADE Zimbabwe YoY GDP growth 1996 to 2008 15% Significant fall in 10% GDP from US$9.5bn 5% The Lost Decade to $3.5bn in 2008 0% -5% -10% Hyper Inflation -15% – over 500bn% -20% 1996 1997 1998 1999 2000 2001 2002 2003 2004 2005 2006 2007 2008 Zimbabwe vs. Zambia GDP 1995-2009E Political Chaos 16 14 12 10 8 Land acquisition 6 program 4 2 0 1995 1996 1997 1998 1999 2000 2001 2002 2003 2004 2005 2006 2007 2008 2009 Zambia Zimbabwe Zimbabwe’s GDP was historically 2x that of Zambia. This relationship reversed in 2002 and today Zambia’s GDP is approximately 3x that of Zimbabwe Source: IMF 5
  • 6.
    A NEW BEGINNING 2008 2009 2010 2011 Risks 6
  • 7.
    PROGRESS MADE SINCE2009 Bank deposits Government revenues 20x 7.3x Beverage consumption Mobile subscribers 2.7x 3.3x 7
  • 8.
    MACRO ECONOMIC INDICATORS KEY DATA AND FORECASTS Real economy 2008 2009 2010E 2011E 2012E Nominal GDP $bn 4.96 5.62 6.72 8.08 9.32 Real GDP Growth YoY, % -14.8 5.6 8.1 9.3 9.5 GDP per capita $ 423 479 573 689 794 External sector Trade balance % of GDP -19.6 -28.8 -15.2 -14.7 -12.9 Current account balance % of GDP -15.7 -16.5 -15.5 -10.6 -9.6 Fiscal sector Government revenue % of GDP 3.3 22 32.1 33.4 33.5 Government expenditure % of GDP 6.4 25 29 31 32.1 Government balance % of GDP -3.1 -2.8 -3.1 -2.4 -1.4 Government gross debt % of GDP 108 110 95 83 76 Monetary policy Inflation %YoY, YE n/a -7.7 3.5 5.4 6.1 8
  • 9.
    GDP GROWTH GDP Growth by Sector 2008 – 2011E Contribution to GDP, 2010 9
  • 10.
    CAPACITY UTILISATION INMANUFACTURING SECTOR Significant improvement in capacity utilisation since 2008... 10
  • 11.
  • 12.
    ZIMBABWE INVESTMENT FLOWS Investment flows still low due to political and regulatory uncertainty 12
  • 13.
    THE INVESTMENT CASEFOR ZIMBABWE
  • 14.
    ZIMBABWE’S INVESTMENT CASEIS UNDERPINNED BY AN IRREVERSIBLE PROCESS OF POLITICAL REFORM AND MATURITY … 14
  • 15.
    …. AND ANUNDERLYING POTENTIALLY DIVERSE ECONOMIC VALUE WITH A STRONG HUMAN CAPITAL BASE… 15
  • 16.
    ….MAKING THE COUNTRY,A FRONTIER MARKET FOR SIGNIFICANT VALUE UPLIFT ESPECIALLY FOR “FIRST-MOVER INVESTORS” 16
  • 17.
    ZIMBABWE IS WELLENDOWED WITH RESOURCES Over 40 different minerals have been extracted to date with the country boasting significant quantities of key resources including: • The second largest platinum reserves in the world • Kimberlite diamonds in southern Zimbabwe and alluvial gems in the east believed to be among the largest find in recent times • Sizeable gold deposits scattered around the country, with a total of ~13Mt of estimated resources • ~502 million tonnes of recoverable coal reserves, and 500 million cubic metres of coal-bed methane suitable for electricity generation At its best, mining has been a strong contributor to the Zimbabwean economy • Contributed ~7% to Zimbabwe’s GDP in 1986 • Directly employed up to 60,000 people with numerous others in support industries • Accounted for over 50% of Zimbabwe’s foreign currency earnings 17
  • 18.
    ZIMBABWE STOCK EXCHANGE TheZSE is a relatively well established, tradable, well regulated exchange by regional standards ZSE Market Cap U$ Billion Market Cap $4.41bln USD (June 2011) Average Daily $2.8mln (5 months of 2011) Trade Settlement Settlement risk exists because of the Risk use of physical scrip and the lack of a meaningful guarantee fund. The leading custodians, Stanbic, however, is internationally reputable. Top Ten Companies by Market Cap ( Aug 10) Exploration Despite a perceived lack of Risk ownership rights within Zimbabwe this has primarily been limited to farmland, and mineral rights to a lesser degree. Indigenization legislation will eventually be mitigated through a compromise agreement. 18
  • 19.
    ZIMBABWE STOCK EXCHANGE(ZSE) SSA 2009 data Turnover Market cap GDP Market cap Turnover % Country ($mn) ($mn) ($bn) to GDP of market Botswana-DCI 4,278 11 40% n/a Kenya 477 10,503 30 35% 5% Malawi 20 1,477 5 30% 1% Mauritius 347 5,028 9 55% 7% Namibia 940 9 10% n/a Nigeria 4,091 32,739 165 20% 12% SA 331,289 799,065 277 288% 41% Tanzania 37 3,830 22 17% 1% Uganda 9 3,751 15 24% 0% Zambia 44 5,273 14 38% 1% Zimbabwe* 571 4,186 3.556 118% 14% Zimbabwe: 3rd Largest Market in SSA by market volumes in 2009 19
  • 20.
    KEY CONCERNS  Political Uncertainty  Early elections – without a clear roadmap for elections  External Debt  Wage Pressures  Supply side constraints – mainly power  Insufficient foreign investment  Concerns around Indigenisation  Skills drain 20
  • 21.
    CONCLUSION  Zimbabwe is gradually recovering from more than a decade of economic decline  GDP growth driven by strong recovery in the mining and agricultural sectors  Strong Macro economic fundamentals although external debt remains a concern  Undervalued assets due to lack of liquidity  Zimbabwe is well endowed with natural resources  Highly educated and skilled population  Good basic infrastructure  Lack of foreign investment continues to hamper growth Zimbabwe is on the cusp of a strong and sustained recovery underpinned by mining and agriculture. 21
  • 22.
    BACKGROUND TO INVICTUSINVESTMENT MANAGEMENT Invictus Investment Management Group (IIMG) was established in 2010 by Ritesh Anand, with a goal of building a world class, enduring investment advisory and management business focussed on sub-Saharan Africa. Invictus Capital will initially focus corporate advisory and capital raising in Zimbabwe, primarily in the mining sector. Invictus Investments will focus on both listed and unlisted investment opportunities in Zimbabwe. Ritesh Anand has over 12 years international investment experience including 7 years at the world’s leading medical research endowment, the Wellcome Trust. Invictus Investments’ investment philosophy is to create long-term value through rigorous analysis and thorough due diligence. Our investment process will incorporate risk management into every investment decision, using both qualitative and quantitative approaches. IIM has a successful track record of investing in Zimbabwe and has built a strong team of investment partners who will be based on the ground in Zimbabwe. 22
  • 23.