1. QUANTITY TECHNIQUES in ANALYSIS NOTES
FACTOR ANALYSIS:
File Used: Tech Survey.sav
Command: AnalyzeDimension ReductionFactor
(Note: Only Scale data to be used)
Now one new window will be opened. Drag Data into analysis box(undo Q2, Q5, Q10, Q26).
Click on Descriptives Tab, click √ on KMO & Bartlett’s test of sphericity. Continue.
Click on Extraction Tab, click √ on Scree Plot under the Display. Conitinue.
Click on Rotation Tab, Select Varimax under the Method. Continue.
Click on Options Tab, Click √ on Sorted by Size and on Suppress Small Coefficient and put the
value 0.40 under the Coefficient Display Format. Continue.
Click Okay.
Now Output window will generate the results.
Interpretation:
KMO and Bartlett's Test
Kaiser-Meyer-Olkin Measure of Sampling Adequacy.
.839
Bartlett's Test of
Approx. Chi-Square
1460.971
Sphericity
df
120
Sig.
.000
KMO is .839, the sampling size is said to be enough.( if less than 0.5 the Sample size is not said
to be enough). The Bartlett's Sig. value is .0(<0.05) Says the variable are matrix there is a
correlation between them. (If >0.05 says values are identity matrix, there is no correlation)
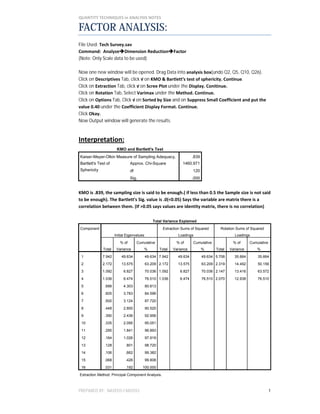
Total Variance Explained
Component
Extraction Sums of Squared
Initial Eigenvalues
Loadings
% of
Total
Rotation Sums of Squared
Cumulative
Variance
%
Loadings
% of
Total
Cumulative
Variance
%
% of
Total
Cumulative
Variance
%
1
7.942
49.634
49.634 7.942
49.634
49.634 5.706
35.664
35.664
2
2.172
13.575
63.209 2.172
13.575
63.209 2.319
14.492
50.156
3
1.092
6.827
70.036 1.092
6.827
70.036 2.147
13.416
63.572
4
1.036
6.474
76.510 1.036
6.474
76.510 2.070
12.938
76.510
5
.688
4.303
80.813
6
.605
3.783
84.596
7
.500
3.124
87.720
8
.448
2.800
90.520
9
.390
2.436
92.956
10
.335
2.095
95.051
11
.295
1.841
96.893
12
.164
1.026
97.919
13
.128
.801
98.720
14
.106
.662
99.382
15
.068
.426
99.808
16
.031
.192
100.000
Extraction Method: Principal Component Analysis.
PREPARED BY: NAVEED FAROOQ
1
2. QUANTITY TECHNIQUES in ANALYSIS NOTES
The Cumulative % is 76.51 at Component No. 4. This means 4 factors can be made.(The Criteria for this
is minimum 60%, if it is not fulfilled we will consider the Scree plot & Communalities).
(Note: The Initial Eigenvalues greater than 1 will be part of Extraction Sums of Squared Loadings & Rotation
Sums of Squared Loadings).
Factors Via Scree Plot & Communalities:
In Scree Plot from the component 5 the line is straight, this point is referred as Point of
Inflection. Before the point of inflection, points are called Significant Jumping Points. It tells us
how many factors is to be made.
Communalities
Initial
Extraction
If Cumulative % under the Total variance explained is less
than 60% we will exclude the values less than 0.5 by 1 by 1
Q31A1
1.000
.783
Q31A2
1.000
.834
Q31A3
1.000
.678
Q31A4
1.000
.635
After analyzing how many factors to be made, we will analyze
Q31A5
1.000
.828
which variables should be the part of the factors.
Q31A6
1.000
.640
Q31A7
1.000
.794
Q31A8
1.000
.812
Q31A9
1.000
.711
For this we analyze the Rotated Component Matrix.
3. QUANTITY TECHNIQUES in ANALYSIS NOTES
a
Rotated Component Matrix
Component
1
2
The No. of Columns in Component
3
4
shows there is need to make 4 Factors.
Q31A2
.891
Q31A8
.854
Q31A1
.846
The values which are part of 2 Component
Q31A5
.835
are called Cross Loadings.
Q31A7
.835
The Cross Loadings Values should be
Q31A3
.744
Q31A4
.670
Q31A6
.611
The values are called Factor Loadings.
excluded from the Factor.
.435
Q31A10
Method for this is (Sum the values
of 2 Component, the biggest value
will be excluded 1st by 1 by 1
.798
Q31A12
.753
Q31A9
.406
.667
Q31A11
.589
Q31B2
.869
Q31B1
.860
Q31B3
.887
Q31B4
.412
.865
Extraction Method: Principal Component Analysis.
Rotation Method: Varimax with Kaiser Normalization.
a. Rotation converged in 6 iterations.
a
Rotated Component Matrix
Component
1
After excluding the variables (Q31A9, Q31B1 & Q31B4),
2
Q31A8
Q31A2
.886
Q31A5
.880
Q31A7
.879
Q31A1
.855
Q31A3
.776
Q31A6
.714
Q31A4
.701
Q31B3
There variable can be gathered in 2 Factors Rotated
.895
.678
Component Matrix tells us which question will be the part of
which factor. In our particular case 2 factors will be made.
The factor 1 will consist of Q31A8, Q31A2, Q31A5, Q31A7,
Q31A1, Q31A3, Q31A6, Q31A4, & Q31B3. The Factor 2
will consist of Q31A12, Q31A11, Q31A10, & Q31B2.
Q31A12
.811
Q31A11
.705
Q31A10
.705
Q31B2
.620
PREPARED BY: NAVEED FAROOQ
3