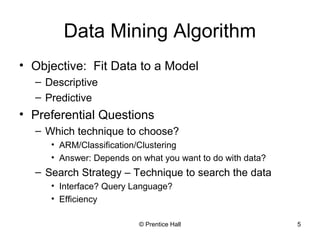
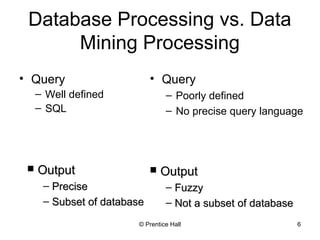
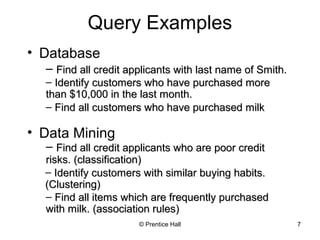
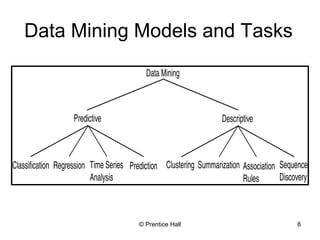
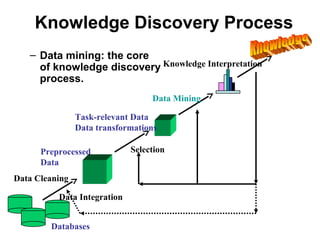
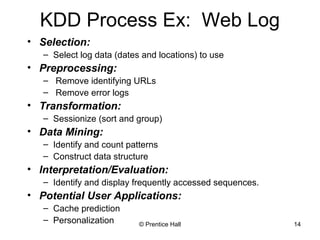
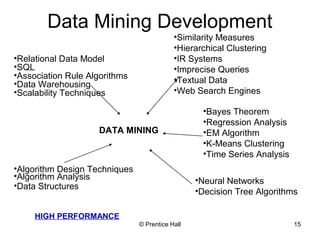
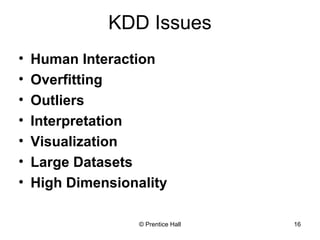
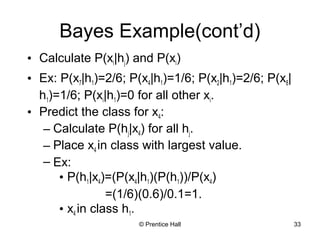
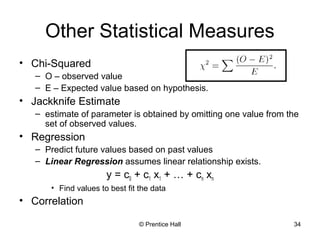
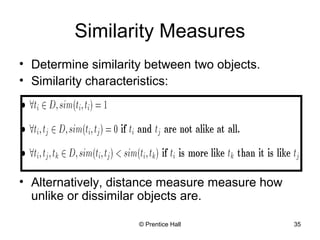
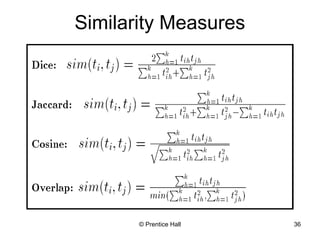
© Prentice Hall 1
CIS 674
Introduction to Data Mining
Srinivasan Parthasarathy
srini@cse.ohio-state.edu
Office Hours: TTH 2-3:18PM
DL317
© Prentice Hall 2
Introduction Outline
• Define data mining
• Data mining vs. databases
• Basic data mining tasks
• Data mining development
• Data mining issues
Goal:Goal: Provide an overview of data mining.Provide an overview of data mining.
© Prentice Hall 3
Introduction
• Data is produced at a phenomenal rate
• Our ability to store has grown
• Users expect more sophisticated
information
• How?
UNCOVER HIDDEN INFORMATIONUNCOVER HIDDEN INFORMATION
DATA MININGDATA MINING
© Prentice Hall 4
Data Mining
• Objective: Fit data to a model
• Potential Result: Higher-level meta
information that may not be obvious when
looking at raw data
• Similar terms
– Exploratory data analysis
– Data driven discovery
– Deductive learning
© Prentice Hall 5
Data Mining Algorithm
• Objective: Fit Data to a Model
– Descriptive
– Predictive
• Preferential Questions
– Which technique to choose?
• ARM/Classification/Clustering
• Answer: Depends on what you want to do with data?
– Search Strategy – Technique to search the data
• Interface? Query Language?
• Efficiency
© Prentice Hall 6
Database Processing vs. Data
Mining Processing
• Query
– Well defined
– SQL
• Query
– Poorly defined
– No precise query language
 OutputOutput
– PrecisePrecise
– Subset of databaseSubset of database
 OutputOutput
– FuzzyFuzzy
– Not a subset of databaseNot a subset of database
© Prentice Hall 7
Query Examples
• Database
• Data Mining
– Find all customers who have purchased milkFind all customers who have purchased milk
– Find all items which are frequently purchasedFind all items which are frequently purchased
with milk. (association rules)with milk. (association rules)
– Find all credit applicants with last name of Smith.Find all credit applicants with last name of Smith.
– Identify customers who have purchased moreIdentify customers who have purchased more
than $10,000 in the last month.than $10,000 in the last month.
– Find all credit applicants who are poor creditFind all credit applicants who are poor credit
risks. (classification)risks. (classification)
– Identify customers with similar buying habits.Identify customers with similar buying habits.
(Clustering)(Clustering)
© Prentice Hall 8
Data Mining Models and Tasks
© Prentice Hall 9
Basic Data Mining Tasks
• Classification maps data into predefined
groups or classes
– Supervised learning
– Pattern recognition
– Prediction
• Regression is used to map a data item to a
real valued prediction variable.
• Clustering groups similar data together into
clusters.
– Unsupervised learning
– Segmentation
– Partitioning
© Prentice Hall 10
Basic Data Mining Tasks
(cont’d)
• Summarization maps data into subsets with
associated simple descriptions.
– Characterization
– Generalization
• Link Analysis uncovers relationships among
data.
– Affinity Analysis
– Association Rules
– Sequential Analysis determines sequential patterns.
© Prentice Hall 11
Ex: Time Series Analysis
• Example: Stock Market
• Predict future values
• Determine similar patterns over time
• Classify behavior
© Prentice Hall 12
Data Mining vs. KDD
• Knowledge Discovery in Databases
(KDD): process of finding useful
information and patterns in data.
• Data Mining: Use of algorithms to extract
the information and patterns derived by
the KDD process.
Knowledge Discovery Process
– Data mining: the core
of knowledge discovery
process.
Data Cleaning
Data Integration
Databases
Preprocessed
Data
Task-relevant Data
Data transformations
Selection
Data Mining
Knowledge Interpretation
© Prentice Hall 14
KDD Process Ex: Web Log
• Selection:
– Select log data (dates and locations) to use
• Preprocessing:
– Remove identifying URLs
– Remove error logs
• Transformation:
– Sessionize (sort and group)
• Data Mining:
– Identify and count patterns
– Construct data structure
• Interpretation/Evaluation:
– Identify and display frequently accessed sequences.
• Potential User Applications:
– Cache prediction
– Personalization
© Prentice Hall 15
Data Mining Development
•Similarity Measures
•Hierarchical Clustering
•IR Systems
•Imprecise Queries
•Textual Data
•Web Search Engines
•Bayes Theorem
•Regression Analysis
•EM Algorithm
•K-Means Clustering
•Time Series Analysis
•Neural Networks
•Decision Tree Algorithms
•Algorithm Design Techniques
•Algorithm Analysis
•Data Structures
•Relational Data Model
•SQL
•Association Rule Algorithms
•Data Warehousing
•Scalability Techniques
HIGH PERFORMANCE
DATA MINING
© Prentice Hall 16
KDD Issues
• Human Interaction
• Overfitting
• Outliers
• Interpretation
• Visualization
• Large Datasets
• High Dimensionality
© Prentice Hall 17
KDD Issues (cont’d)
• Multimedia Data
• Missing Data
• Irrelevant Data
• Noisy Data
• Changing Data
• Integration
• Application
© Prentice Hall 18
Social Implications of DM
• Privacy
• Profiling
• Unauthorized use
© Prentice Hall 19
Data Mining Metrics
• Usefulness
• Return on Investment (ROI)
• Accuracy
• Space/Time
© Prentice Hall 20
Database Perspective on Data
Mining
• Scalability
• Real World Data
• Updates
• Ease of Use
© Prentice Hall 21
Outline of Today’s Class
• Statistical Basics
– Point Estimation
– Models Based on Summarization
– Bayes Theorem
– Hypothesis Testing
– Regression and Correlation
• Similarity Measures
© Prentice Hall 22
Point Estimation
• Point Estimate: estimate a population
parameter.
• May be made by calculating the parameter for a
sample.
• May be used to predict value for missing data.
• Ex:
– R contains 100 employees
– 99 have salary information
– Mean salary of these is $50,000
– Use $50,000 as value of remaining employee’s
salary.
Is this a good idea?
© Prentice Hall 23
Estimation Error
• Bias: Difference between expected value and
actual value.
• Mean Squared Error (MSE): expected value of
the squared difference between the estimate
and the actual value:
• Why square?
• Root Mean Square Error (RMSE)
© Prentice Hall 24
Jackknife Estimate
• Jackknife Estimate: estimate of parameter is
obtained by omitting one value from the set of
observed values.
– Treat the data like a population
– Take samples from this population
– Use these samples to estimate the parameter
• Let θ(hat) be an estimate on the entire pop.
• Let θ(j)(hat) be an estimator of the same form
with observation j deleted
• Allows you to examine the impact of outliers!
© Prentice Hall 25
Maximum Likelihood
Estimate (MLE)
• Obtain parameter estimates that maximize
the probability that the sample data occurs for
the specific model.
• Joint probability for observing the sample
data by multiplying the individual probabilities.
Likelihood function:
• Maximize L.
© Prentice Hall 26
MLE Example
• Coin toss five times: {H,H,H,H,T}
• Assuming a perfect coin with H and T equally
likely, the likelihood of this sequence is:
• However if the probability of a H is 0.8 then:
© Prentice Hall 27
MLE Example (cont’d)
• General likelihood formula:
• Estimate for p is then 4/5 = 0.8
© Prentice Hall 28
Expectation-Maximization (EM)
• Solves estimation with incomplete data.
• Obtain initial estimates for parameters.
• Iteratively use estimates for missing data
and continue until convergence.
© Prentice Hall 29
EM Example
© Prentice Hall 30
EM Algorithm
© Prentice Hall 31
Bayes Theorem Example
• Credit authorizations (hypotheses):
h1=authorize purchase, h2 = authorize after
further identification, h3=do not authorize,
h4= do not authorize but contact police
• Assign twelve data values for all
combinations of credit and income:
• From training data: P(h1) = 60%; P(h2)=20%;
P(h3)=10%; P(h4)=10%.
1 2 3 4
Excellent x1 x2 x3 x4
Good x5 x6 x7 x8
Bad x9 x10 x11 x12
© Prentice Hall 32
Bayes Example(cont’d)
• Training Data:
ID Income Credit Class xi
1 4 Excellent h1 x4
2 3 Good h1 x7
3 2 Excellent h1 x2
4 3 Good h1 x7
5 4 Good h1 x8
6 2 Excellent h1 x2
7 3 Bad h2 x11
8 2 Bad h2 x10
9 3 Bad h3 x11
10 1 Bad h4 x9
© Prentice Hall 33
Bayes Example(cont’d)
• Calculate P(xi|hj) and P(xi)
• Ex: P(x7|h1)=2/6; P(x4|h1)=1/6; P(x2|h1)=2/6; P(x8|
h1)=1/6; P(xi|h1)=0 for all other xi.
• Predict the class for x4:
– Calculate P(hj|x4) for all hj.
– Place x4 in class with largest value.
– Ex:
• P(h1|x4)=(P(x4|h1)(P(h1))/P(x4)
=(1/6)(0.6)/0.1=1.
• x4 in class h1.
© Prentice Hall 34
Other Statistical Measures
• Chi-Squared
– O – observed value
– E – Expected value based on hypothesis.
• Jackknife Estimate
– estimate of parameter is obtained by omitting one value from the
set of observed values.
• Regression
– Predict future values based on past values
– Linear Regression assumes linear relationship exists.
y = c0 + c1 x1 + … + cn xn
• Find values to best fit the data
• Correlation
© Prentice Hall 35
Similarity Measures
• Determine similarity between two objects.
• Similarity characteristics:
• Alternatively, distance measure measure how
unlike or dissimilar objects are.
© Prentice Hall 36
Similarity Measures
© Prentice Hall 37
Distance Measures
• Measure dissimilarity between objects
© Prentice Hall 38
Information Retrieval
• Information Retrieval (IR): retrieving desired
information from textual data.
• Library Science
• Digital Libraries
• Web Search Engines
• Traditionally keyword based
• Sample query:
Find all documents about “data mining”.
DM: Similarity measures;
Mine text/Web data.
© Prentice Hall 39
Information Retrieval (cont’d)
• Similarity: measure of how close a
query is to a document.
• Documents which are “close enough”
are retrieved.
• Metrics:
–Precision = |Relevant and Retrieved|
|Retrieved|
–Recall = |Relevant and Retrieved|
|Relevant|
© Prentice Hall 40
IR Query Result Measures and
Classification
IR Classification

data mining

  • 1.
    © Prentice Hall1 CIS 674 Introduction to Data Mining Srinivasan Parthasarathy srini@cse.ohio-state.edu Office Hours: TTH 2-3:18PM DL317
  • 2.
    © Prentice Hall2 Introduction Outline • Define data mining • Data mining vs. databases • Basic data mining tasks • Data mining development • Data mining issues Goal:Goal: Provide an overview of data mining.Provide an overview of data mining.
  • 3.
    © Prentice Hall3 Introduction • Data is produced at a phenomenal rate • Our ability to store has grown • Users expect more sophisticated information • How? UNCOVER HIDDEN INFORMATIONUNCOVER HIDDEN INFORMATION DATA MININGDATA MINING
  • 4.
    © Prentice Hall4 Data Mining • Objective: Fit data to a model • Potential Result: Higher-level meta information that may not be obvious when looking at raw data • Similar terms – Exploratory data analysis – Data driven discovery – Deductive learning
  • 5.
    © Prentice Hall5 Data Mining Algorithm • Objective: Fit Data to a Model – Descriptive – Predictive • Preferential Questions – Which technique to choose? • ARM/Classification/Clustering • Answer: Depends on what you want to do with data? – Search Strategy – Technique to search the data • Interface? Query Language? • Efficiency
  • 6.
    © Prentice Hall6 Database Processing vs. Data Mining Processing • Query – Well defined – SQL • Query – Poorly defined – No precise query language  OutputOutput – PrecisePrecise – Subset of databaseSubset of database  OutputOutput – FuzzyFuzzy – Not a subset of databaseNot a subset of database
  • 7.
    © Prentice Hall7 Query Examples • Database • Data Mining – Find all customers who have purchased milkFind all customers who have purchased milk – Find all items which are frequently purchasedFind all items which are frequently purchased with milk. (association rules)with milk. (association rules) – Find all credit applicants with last name of Smith.Find all credit applicants with last name of Smith. – Identify customers who have purchased moreIdentify customers who have purchased more than $10,000 in the last month.than $10,000 in the last month. – Find all credit applicants who are poor creditFind all credit applicants who are poor credit risks. (classification)risks. (classification) – Identify customers with similar buying habits.Identify customers with similar buying habits. (Clustering)(Clustering)
  • 8.
    © Prentice Hall8 Data Mining Models and Tasks
  • 9.
    © Prentice Hall9 Basic Data Mining Tasks • Classification maps data into predefined groups or classes – Supervised learning – Pattern recognition – Prediction • Regression is used to map a data item to a real valued prediction variable. • Clustering groups similar data together into clusters. – Unsupervised learning – Segmentation – Partitioning
  • 10.
    © Prentice Hall10 Basic Data Mining Tasks (cont’d) • Summarization maps data into subsets with associated simple descriptions. – Characterization – Generalization • Link Analysis uncovers relationships among data. – Affinity Analysis – Association Rules – Sequential Analysis determines sequential patterns.
  • 11.
    © Prentice Hall11 Ex: Time Series Analysis • Example: Stock Market • Predict future values • Determine similar patterns over time • Classify behavior
  • 12.
    © Prentice Hall12 Data Mining vs. KDD • Knowledge Discovery in Databases (KDD): process of finding useful information and patterns in data. • Data Mining: Use of algorithms to extract the information and patterns derived by the KDD process.
  • 13.
    Knowledge Discovery Process –Data mining: the core of knowledge discovery process. Data Cleaning Data Integration Databases Preprocessed Data Task-relevant Data Data transformations Selection Data Mining Knowledge Interpretation
  • 14.
    © Prentice Hall14 KDD Process Ex: Web Log • Selection: – Select log data (dates and locations) to use • Preprocessing: – Remove identifying URLs – Remove error logs • Transformation: – Sessionize (sort and group) • Data Mining: – Identify and count patterns – Construct data structure • Interpretation/Evaluation: – Identify and display frequently accessed sequences. • Potential User Applications: – Cache prediction – Personalization
  • 15.
    © Prentice Hall15 Data Mining Development •Similarity Measures •Hierarchical Clustering •IR Systems •Imprecise Queries •Textual Data •Web Search Engines •Bayes Theorem •Regression Analysis •EM Algorithm •K-Means Clustering •Time Series Analysis •Neural Networks •Decision Tree Algorithms •Algorithm Design Techniques •Algorithm Analysis •Data Structures •Relational Data Model •SQL •Association Rule Algorithms •Data Warehousing •Scalability Techniques HIGH PERFORMANCE DATA MINING
  • 16.
    © Prentice Hall16 KDD Issues • Human Interaction • Overfitting • Outliers • Interpretation • Visualization • Large Datasets • High Dimensionality
  • 17.
    © Prentice Hall17 KDD Issues (cont’d) • Multimedia Data • Missing Data • Irrelevant Data • Noisy Data • Changing Data • Integration • Application
  • 18.
    © Prentice Hall18 Social Implications of DM • Privacy • Profiling • Unauthorized use
  • 19.
    © Prentice Hall19 Data Mining Metrics • Usefulness • Return on Investment (ROI) • Accuracy • Space/Time
  • 20.
    © Prentice Hall20 Database Perspective on Data Mining • Scalability • Real World Data • Updates • Ease of Use
  • 21.
    © Prentice Hall21 Outline of Today’s Class • Statistical Basics – Point Estimation – Models Based on Summarization – Bayes Theorem – Hypothesis Testing – Regression and Correlation • Similarity Measures
  • 22.
    © Prentice Hall22 Point Estimation • Point Estimate: estimate a population parameter. • May be made by calculating the parameter for a sample. • May be used to predict value for missing data. • Ex: – R contains 100 employees – 99 have salary information – Mean salary of these is $50,000 – Use $50,000 as value of remaining employee’s salary. Is this a good idea?
  • 23.
    © Prentice Hall23 Estimation Error • Bias: Difference between expected value and actual value. • Mean Squared Error (MSE): expected value of the squared difference between the estimate and the actual value: • Why square? • Root Mean Square Error (RMSE)
  • 24.
    © Prentice Hall24 Jackknife Estimate • Jackknife Estimate: estimate of parameter is obtained by omitting one value from the set of observed values. – Treat the data like a population – Take samples from this population – Use these samples to estimate the parameter • Let θ(hat) be an estimate on the entire pop. • Let θ(j)(hat) be an estimator of the same form with observation j deleted • Allows you to examine the impact of outliers!
  • 25.
    © Prentice Hall25 Maximum Likelihood Estimate (MLE) • Obtain parameter estimates that maximize the probability that the sample data occurs for the specific model. • Joint probability for observing the sample data by multiplying the individual probabilities. Likelihood function: • Maximize L.
  • 26.
    © Prentice Hall26 MLE Example • Coin toss five times: {H,H,H,H,T} • Assuming a perfect coin with H and T equally likely, the likelihood of this sequence is: • However if the probability of a H is 0.8 then:
  • 27.
    © Prentice Hall27 MLE Example (cont’d) • General likelihood formula: • Estimate for p is then 4/5 = 0.8
  • 28.
    © Prentice Hall28 Expectation-Maximization (EM) • Solves estimation with incomplete data. • Obtain initial estimates for parameters. • Iteratively use estimates for missing data and continue until convergence.
  • 29.
    © Prentice Hall29 EM Example
  • 30.
    © Prentice Hall30 EM Algorithm
  • 31.
    © Prentice Hall31 Bayes Theorem Example • Credit authorizations (hypotheses): h1=authorize purchase, h2 = authorize after further identification, h3=do not authorize, h4= do not authorize but contact police • Assign twelve data values for all combinations of credit and income: • From training data: P(h1) = 60%; P(h2)=20%; P(h3)=10%; P(h4)=10%. 1 2 3 4 Excellent x1 x2 x3 x4 Good x5 x6 x7 x8 Bad x9 x10 x11 x12
  • 32.
    © Prentice Hall32 Bayes Example(cont’d) • Training Data: ID Income Credit Class xi 1 4 Excellent h1 x4 2 3 Good h1 x7 3 2 Excellent h1 x2 4 3 Good h1 x7 5 4 Good h1 x8 6 2 Excellent h1 x2 7 3 Bad h2 x11 8 2 Bad h2 x10 9 3 Bad h3 x11 10 1 Bad h4 x9
  • 33.
    © Prentice Hall33 Bayes Example(cont’d) • Calculate P(xi|hj) and P(xi) • Ex: P(x7|h1)=2/6; P(x4|h1)=1/6; P(x2|h1)=2/6; P(x8| h1)=1/6; P(xi|h1)=0 for all other xi. • Predict the class for x4: – Calculate P(hj|x4) for all hj. – Place x4 in class with largest value. – Ex: • P(h1|x4)=(P(x4|h1)(P(h1))/P(x4) =(1/6)(0.6)/0.1=1. • x4 in class h1.
  • 34.
    © Prentice Hall34 Other Statistical Measures • Chi-Squared – O – observed value – E – Expected value based on hypothesis. • Jackknife Estimate – estimate of parameter is obtained by omitting one value from the set of observed values. • Regression – Predict future values based on past values – Linear Regression assumes linear relationship exists. y = c0 + c1 x1 + … + cn xn • Find values to best fit the data • Correlation
  • 35.
    © Prentice Hall35 Similarity Measures • Determine similarity between two objects. • Similarity characteristics: • Alternatively, distance measure measure how unlike or dissimilar objects are.
  • 36.
    © Prentice Hall36 Similarity Measures
  • 37.
    © Prentice Hall37 Distance Measures • Measure dissimilarity between objects
  • 38.
    © Prentice Hall38 Information Retrieval • Information Retrieval (IR): retrieving desired information from textual data. • Library Science • Digital Libraries • Web Search Engines • Traditionally keyword based • Sample query: Find all documents about “data mining”. DM: Similarity measures; Mine text/Web data.
  • 39.
    © Prentice Hall39 Information Retrieval (cont’d) • Similarity: measure of how close a query is to a document. • Documents which are “close enough” are retrieved. • Metrics: –Precision = |Relevant and Retrieved| |Retrieved| –Recall = |Relevant and Retrieved| |Relevant|
  • 40.
    © Prentice Hall40 IR Query Result Measures and Classification IR Classification