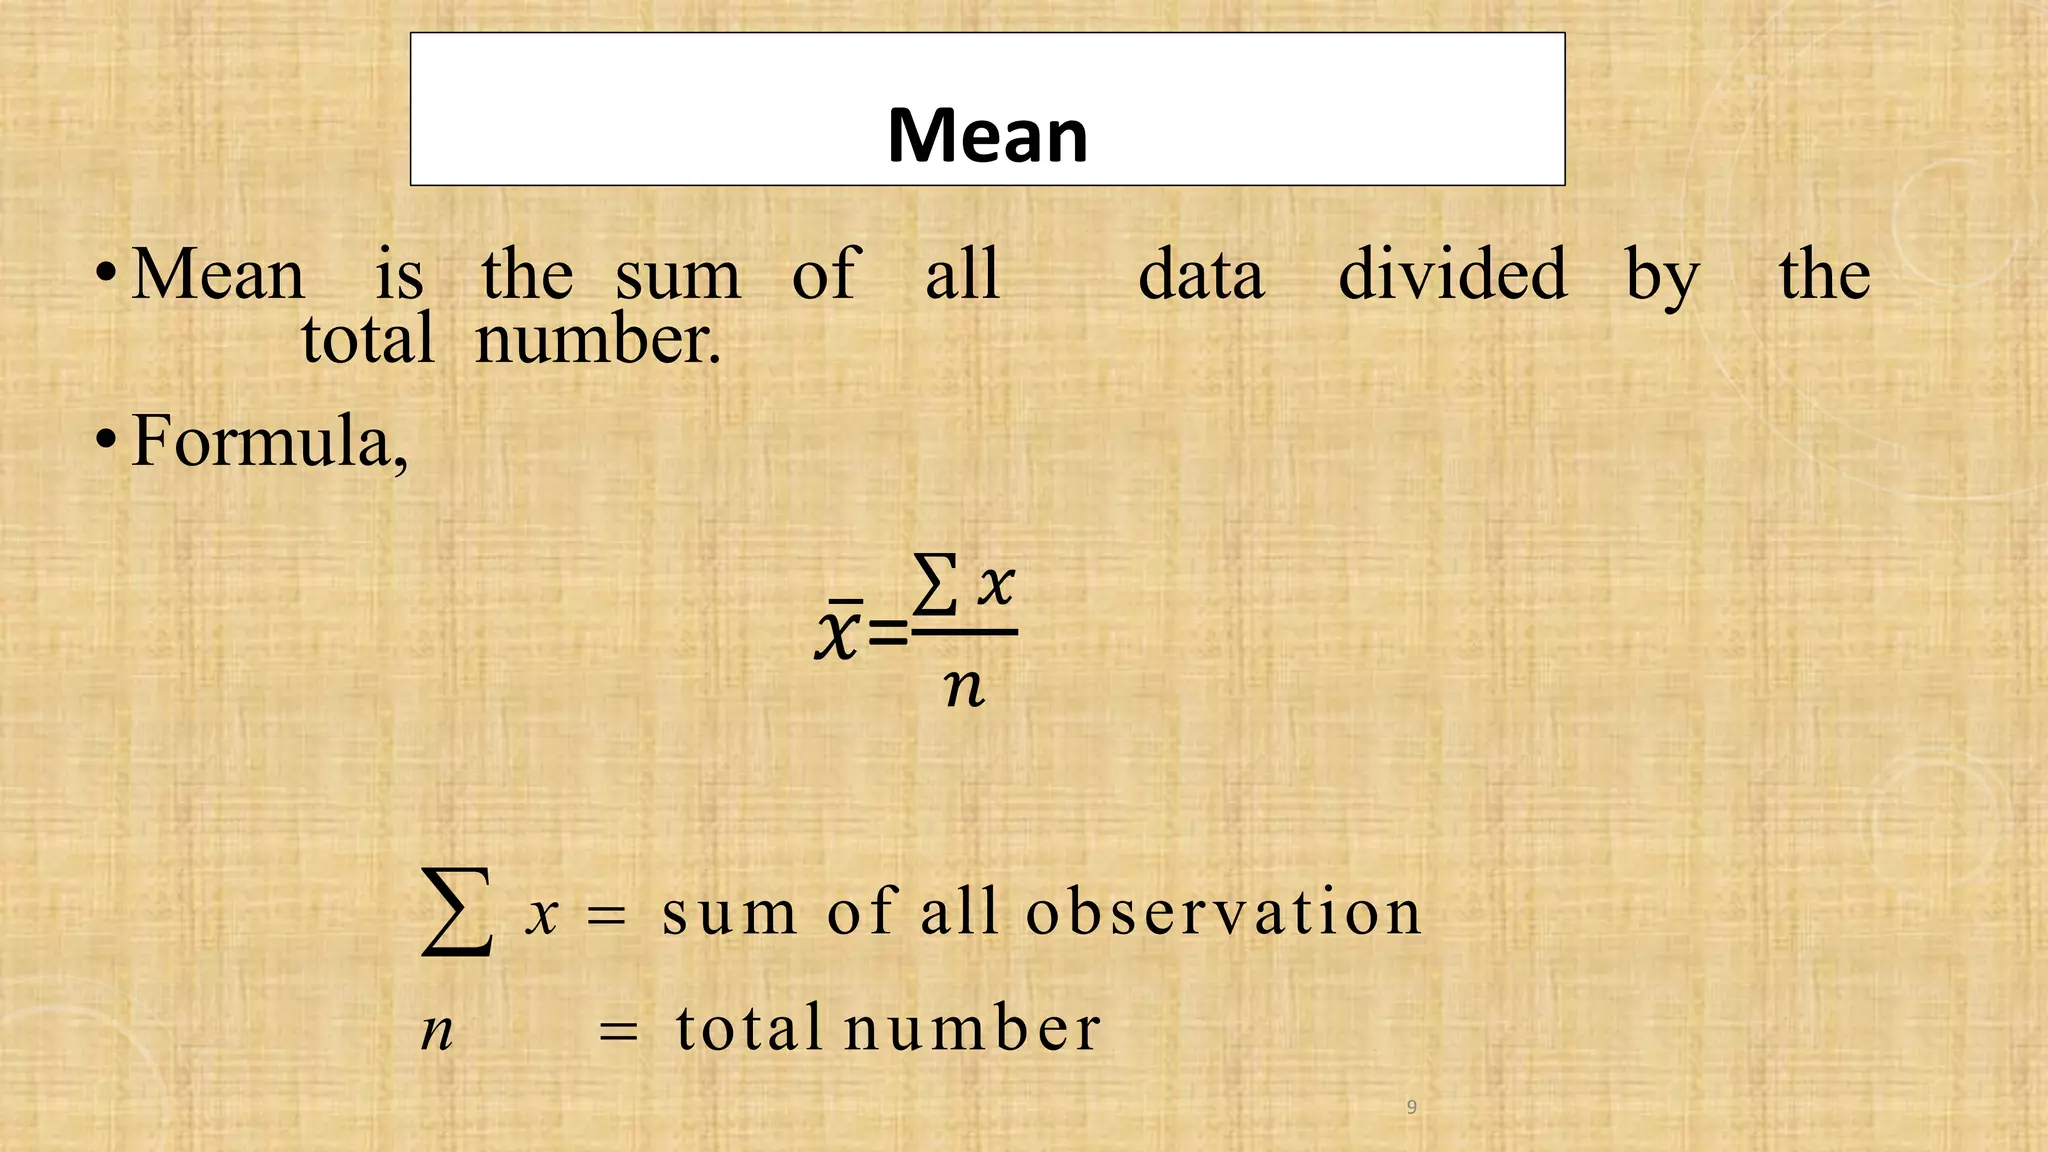
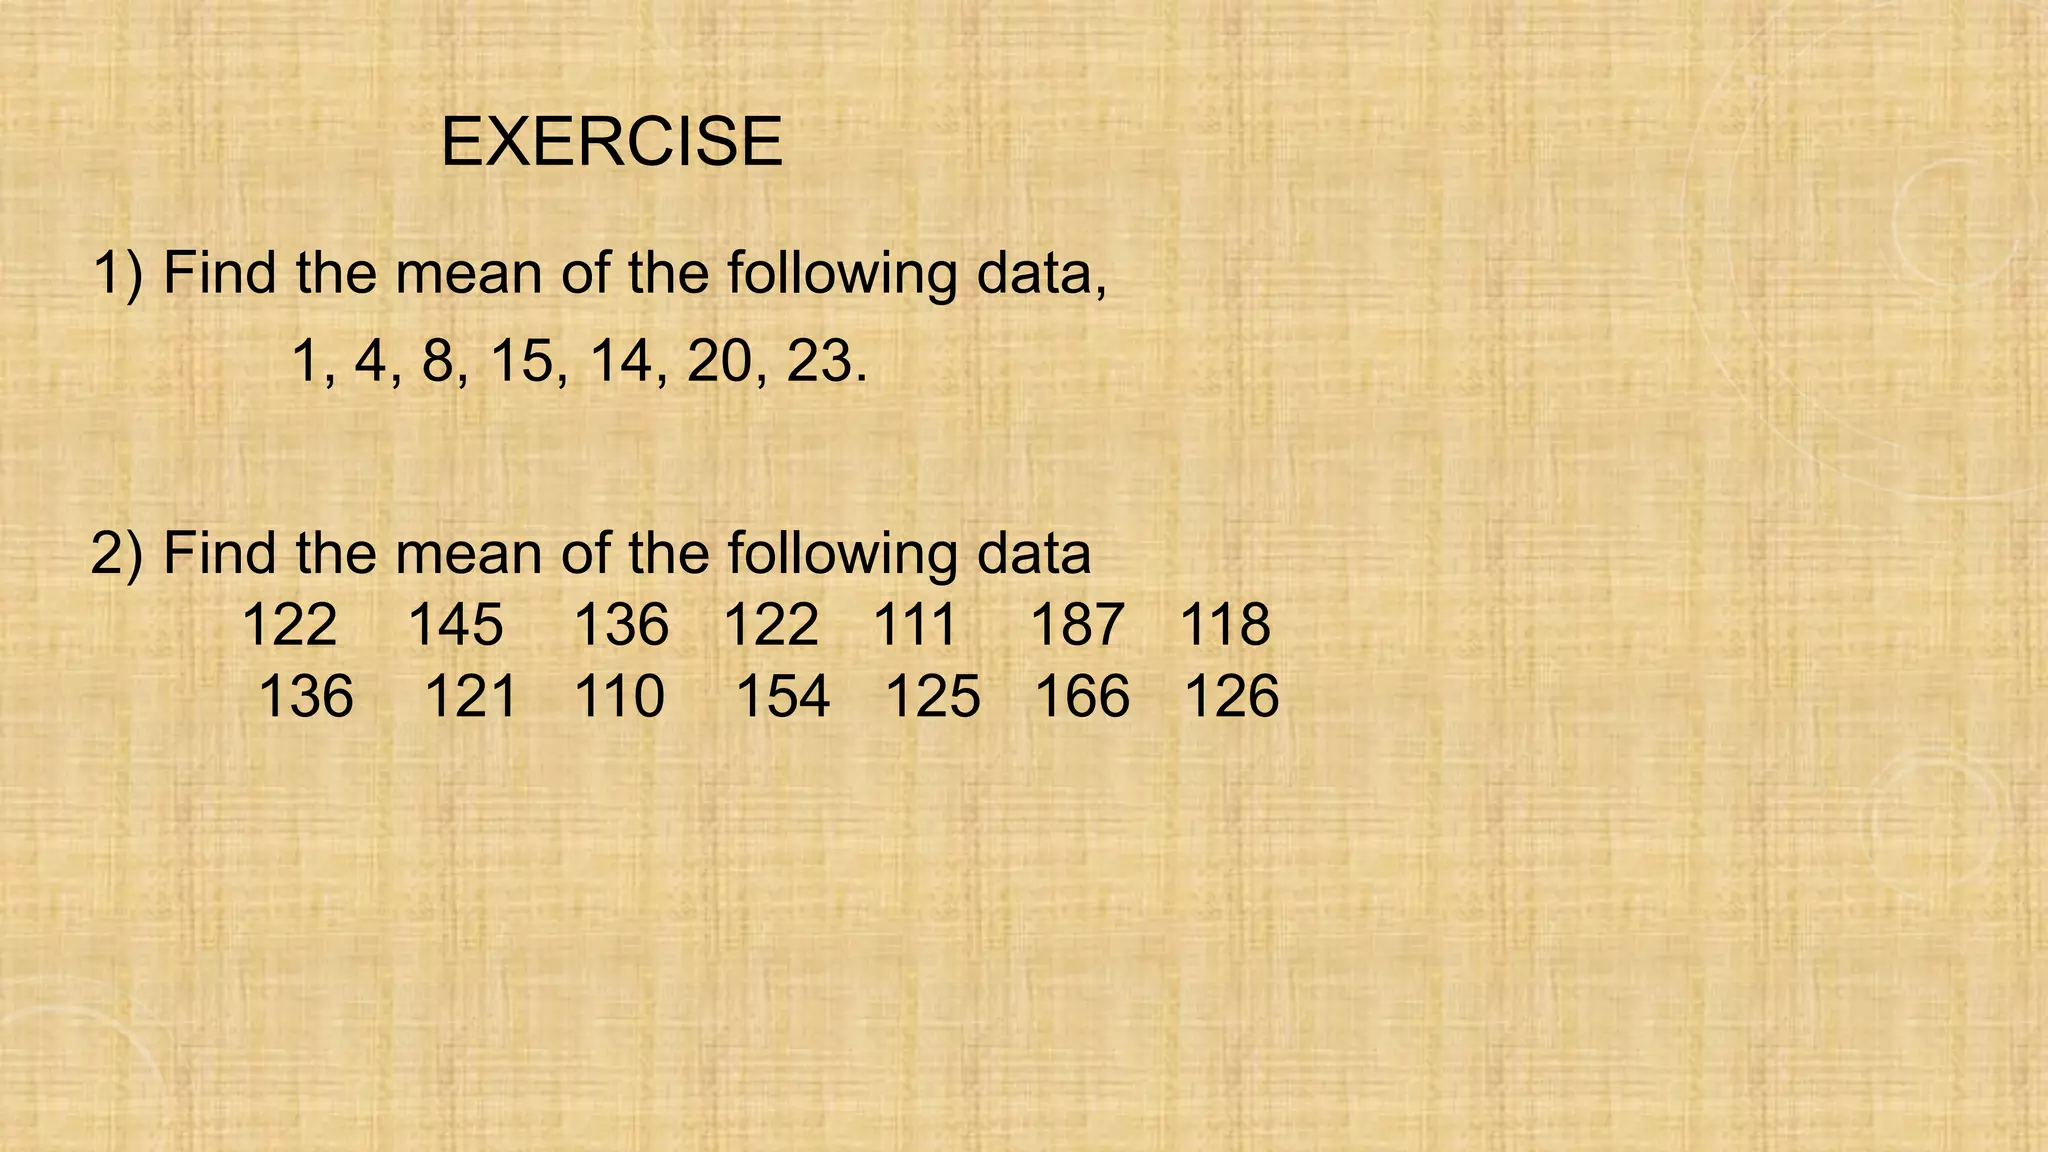
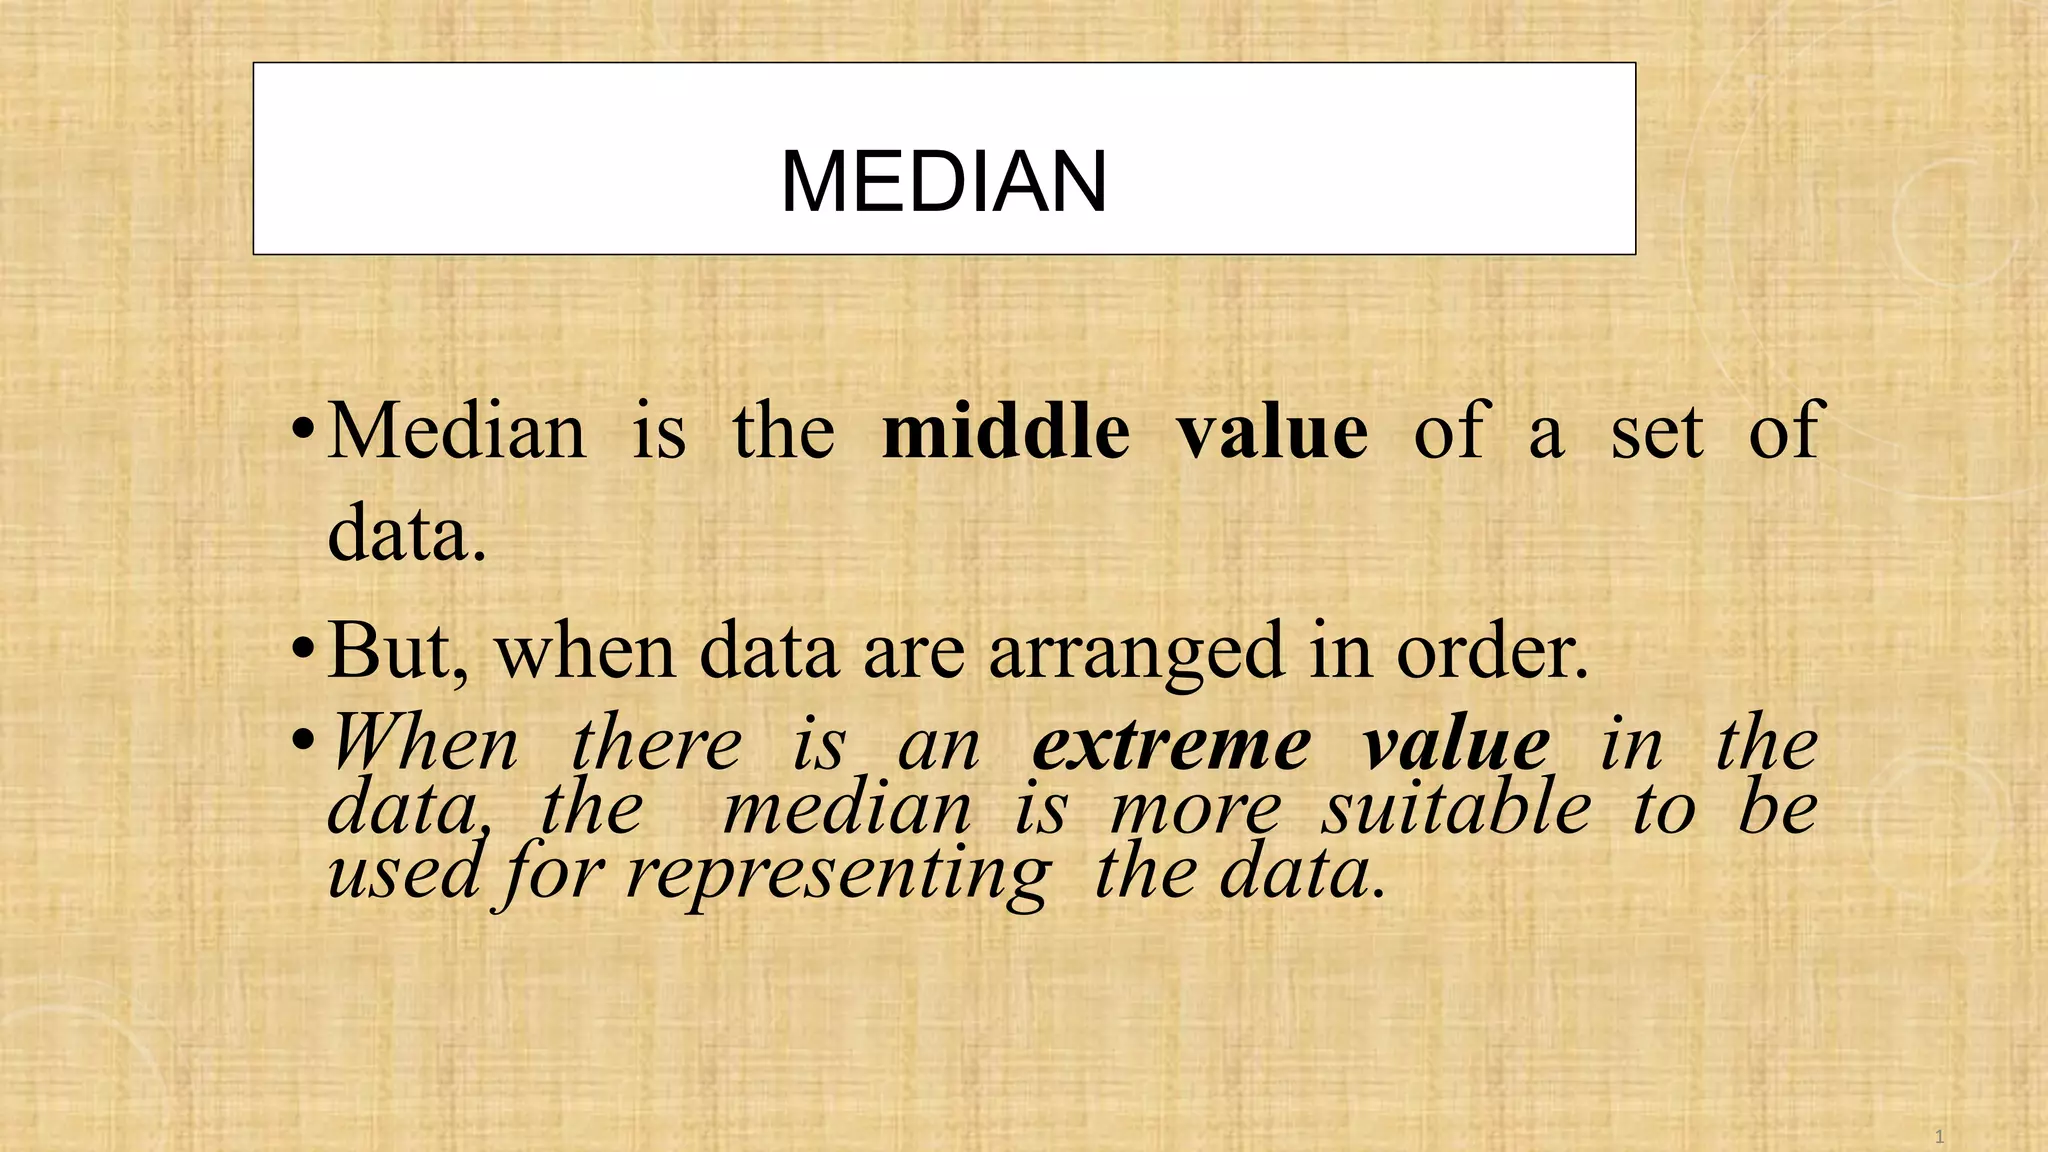
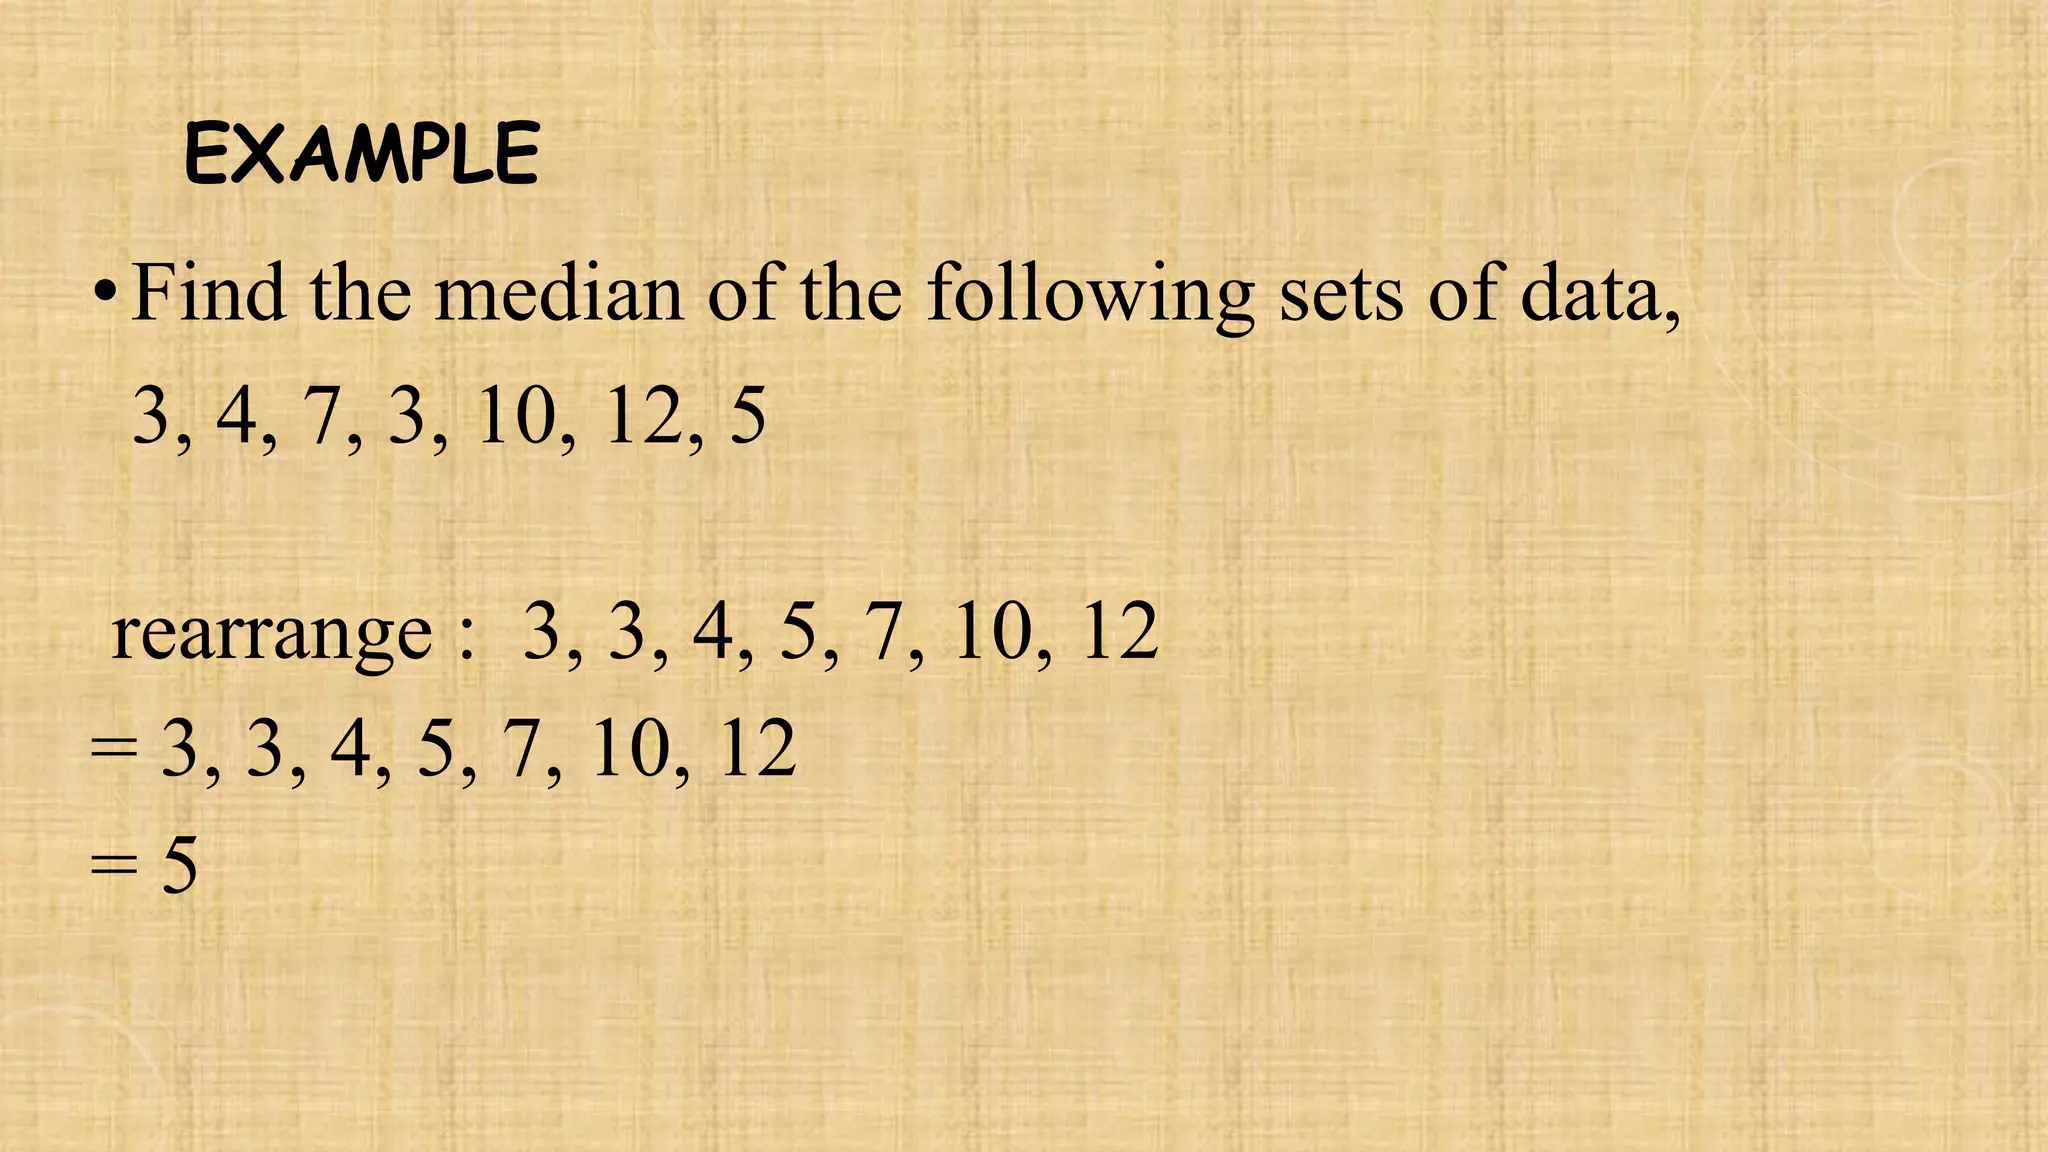
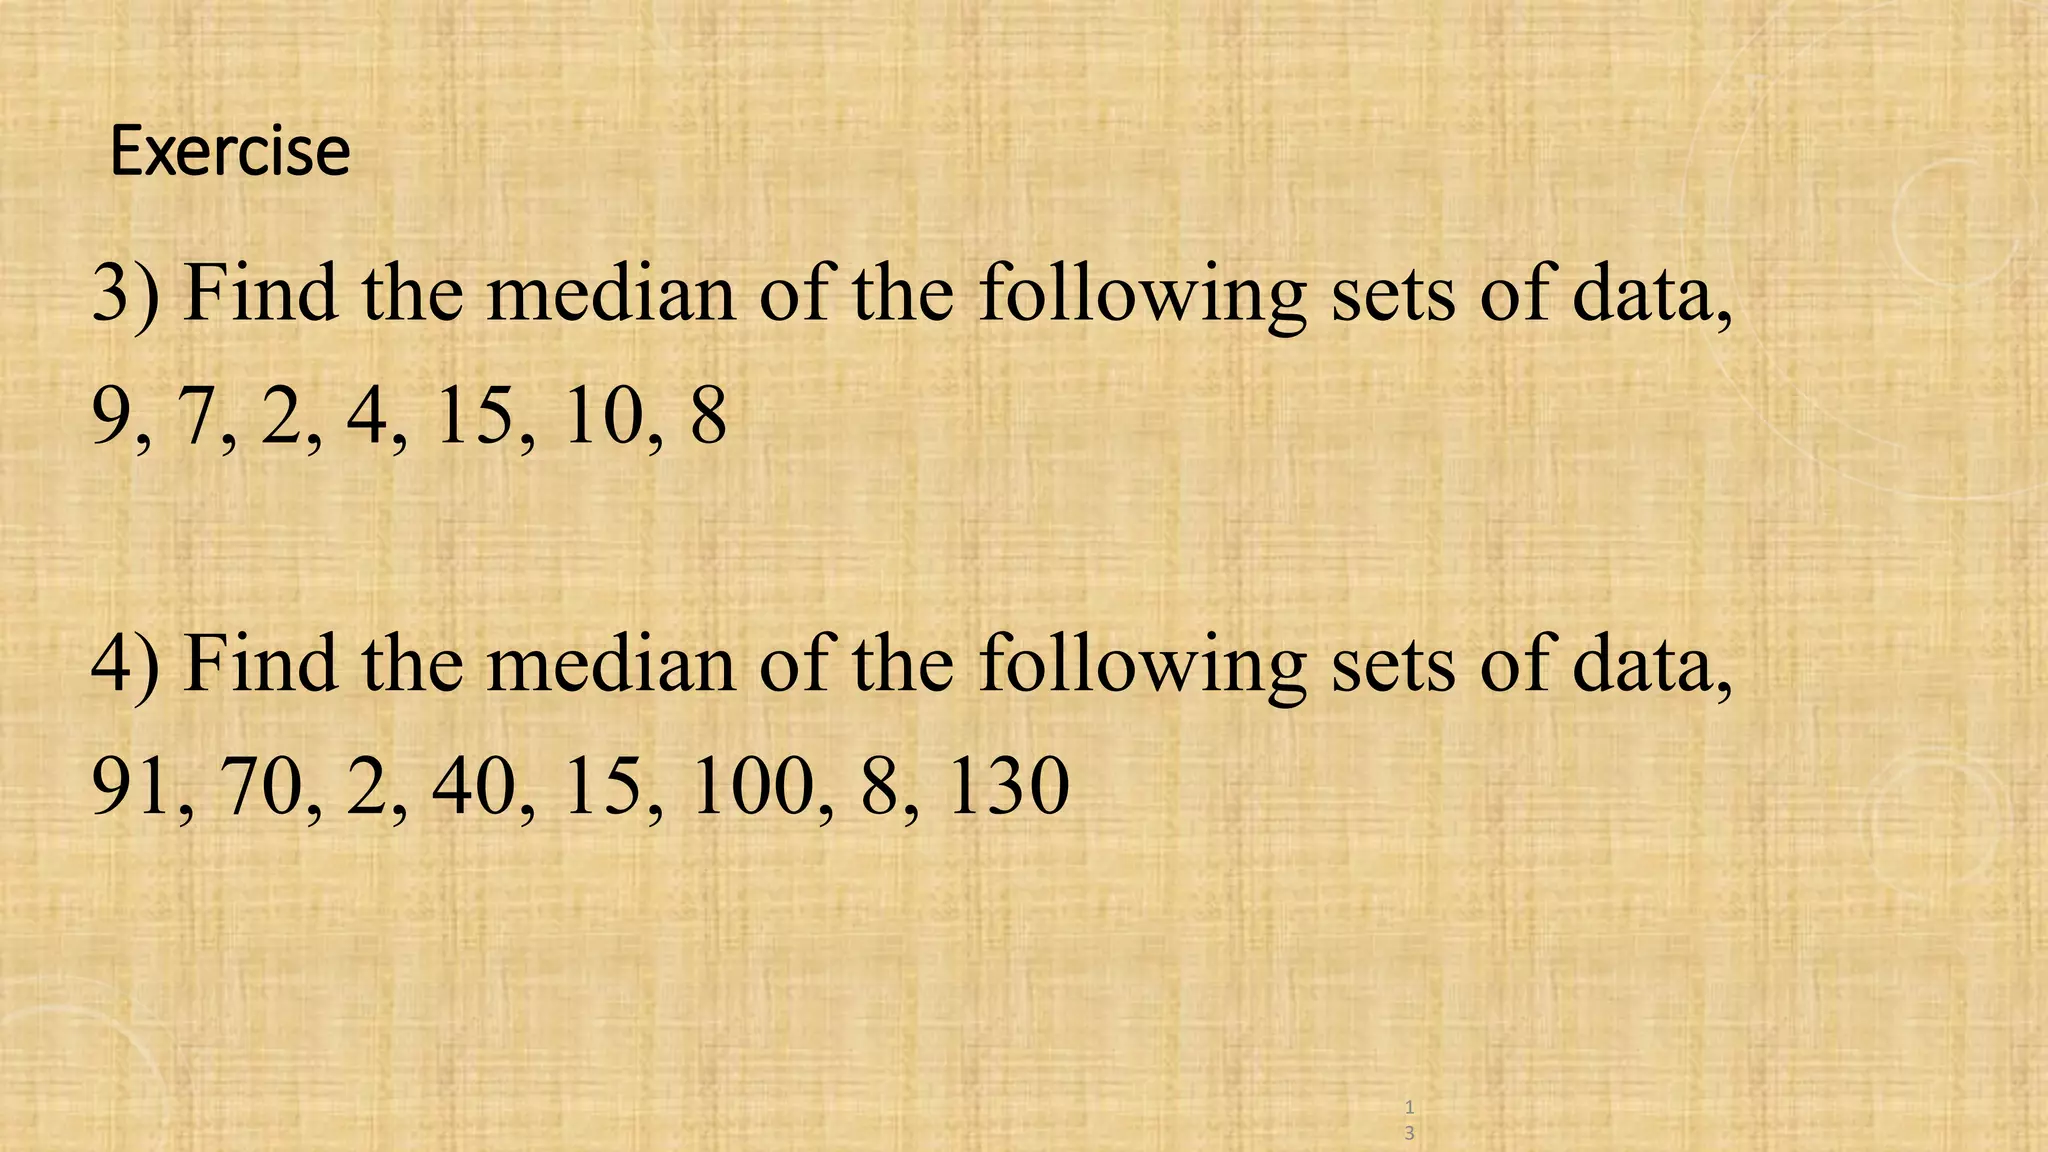
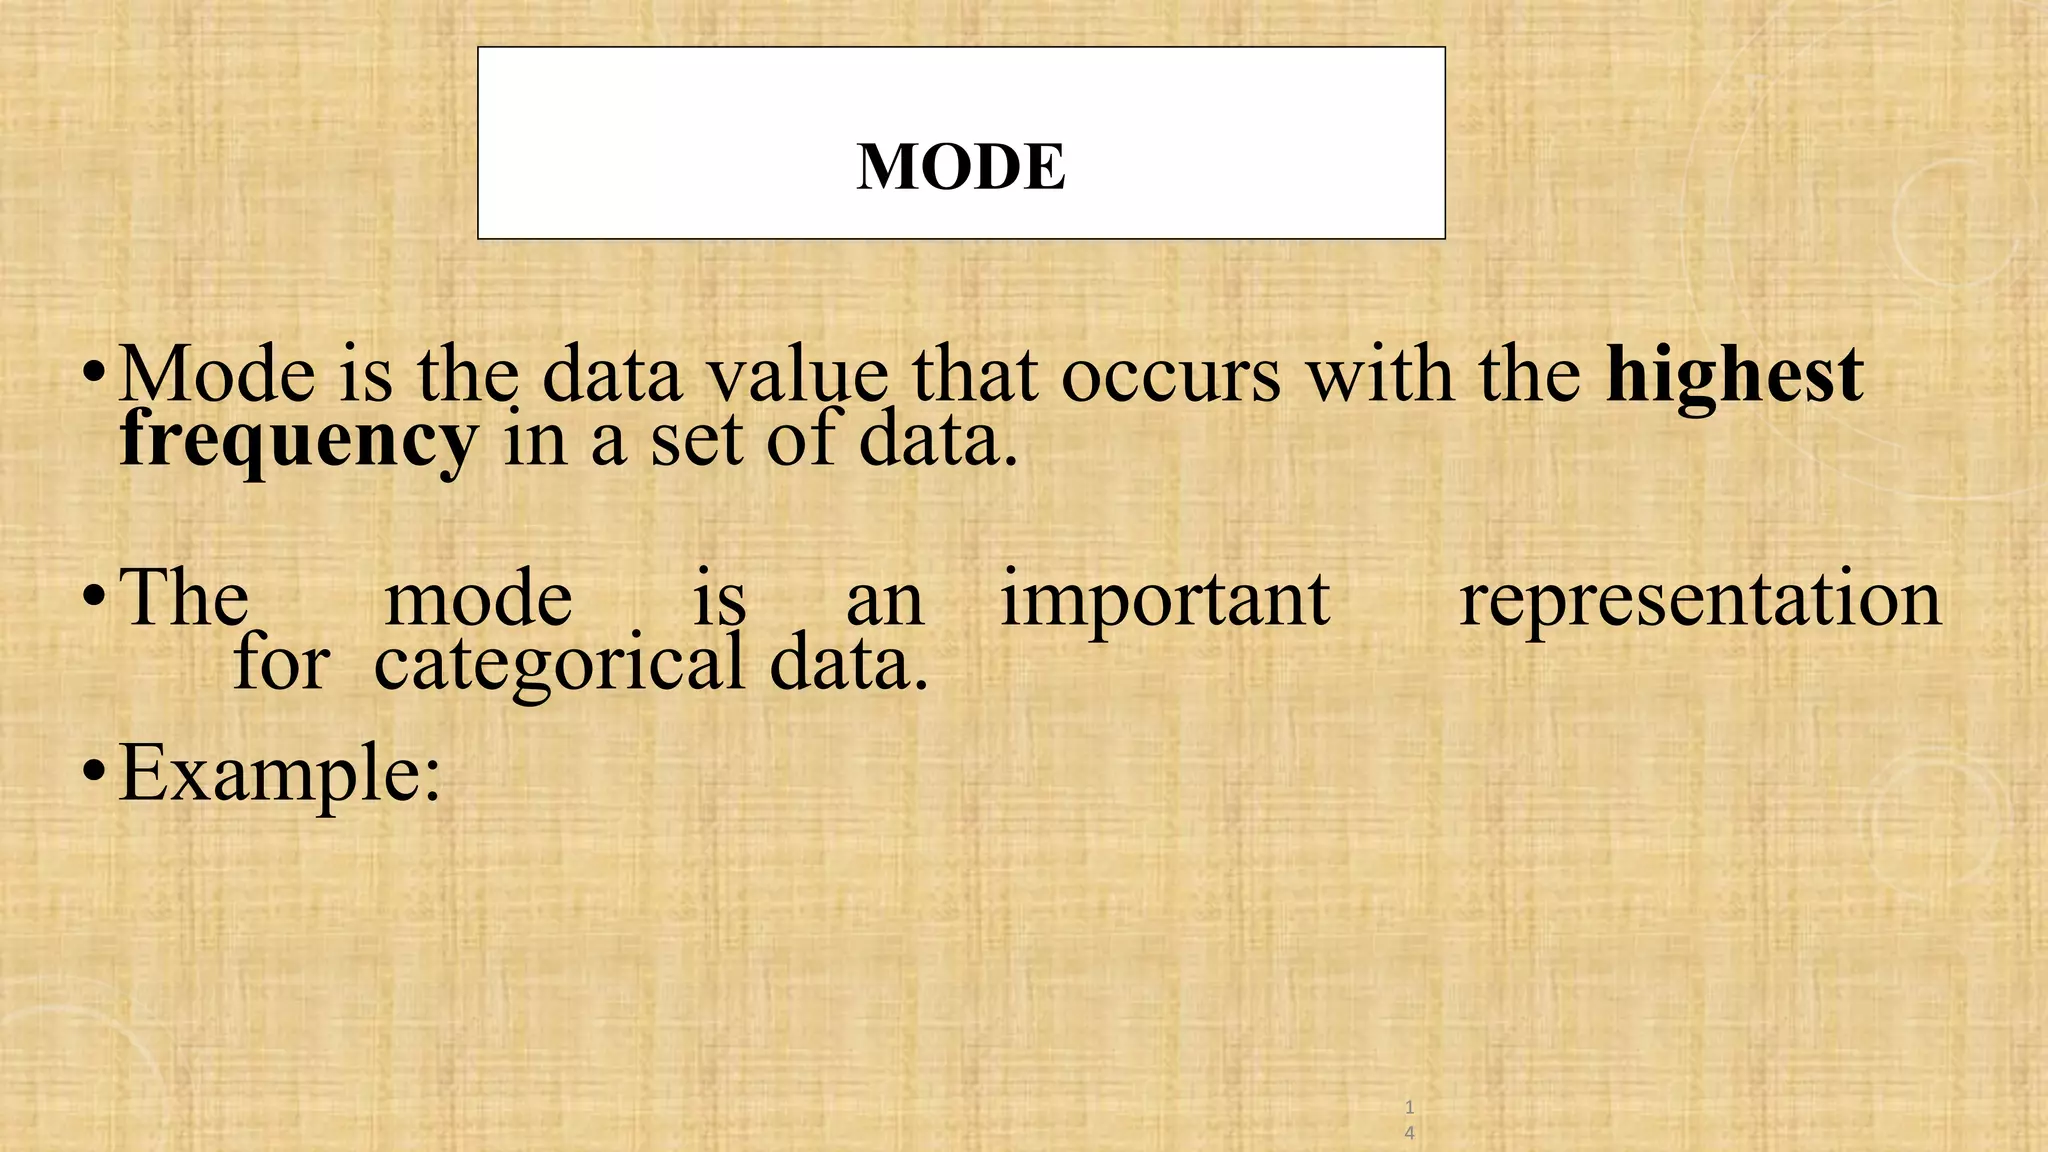
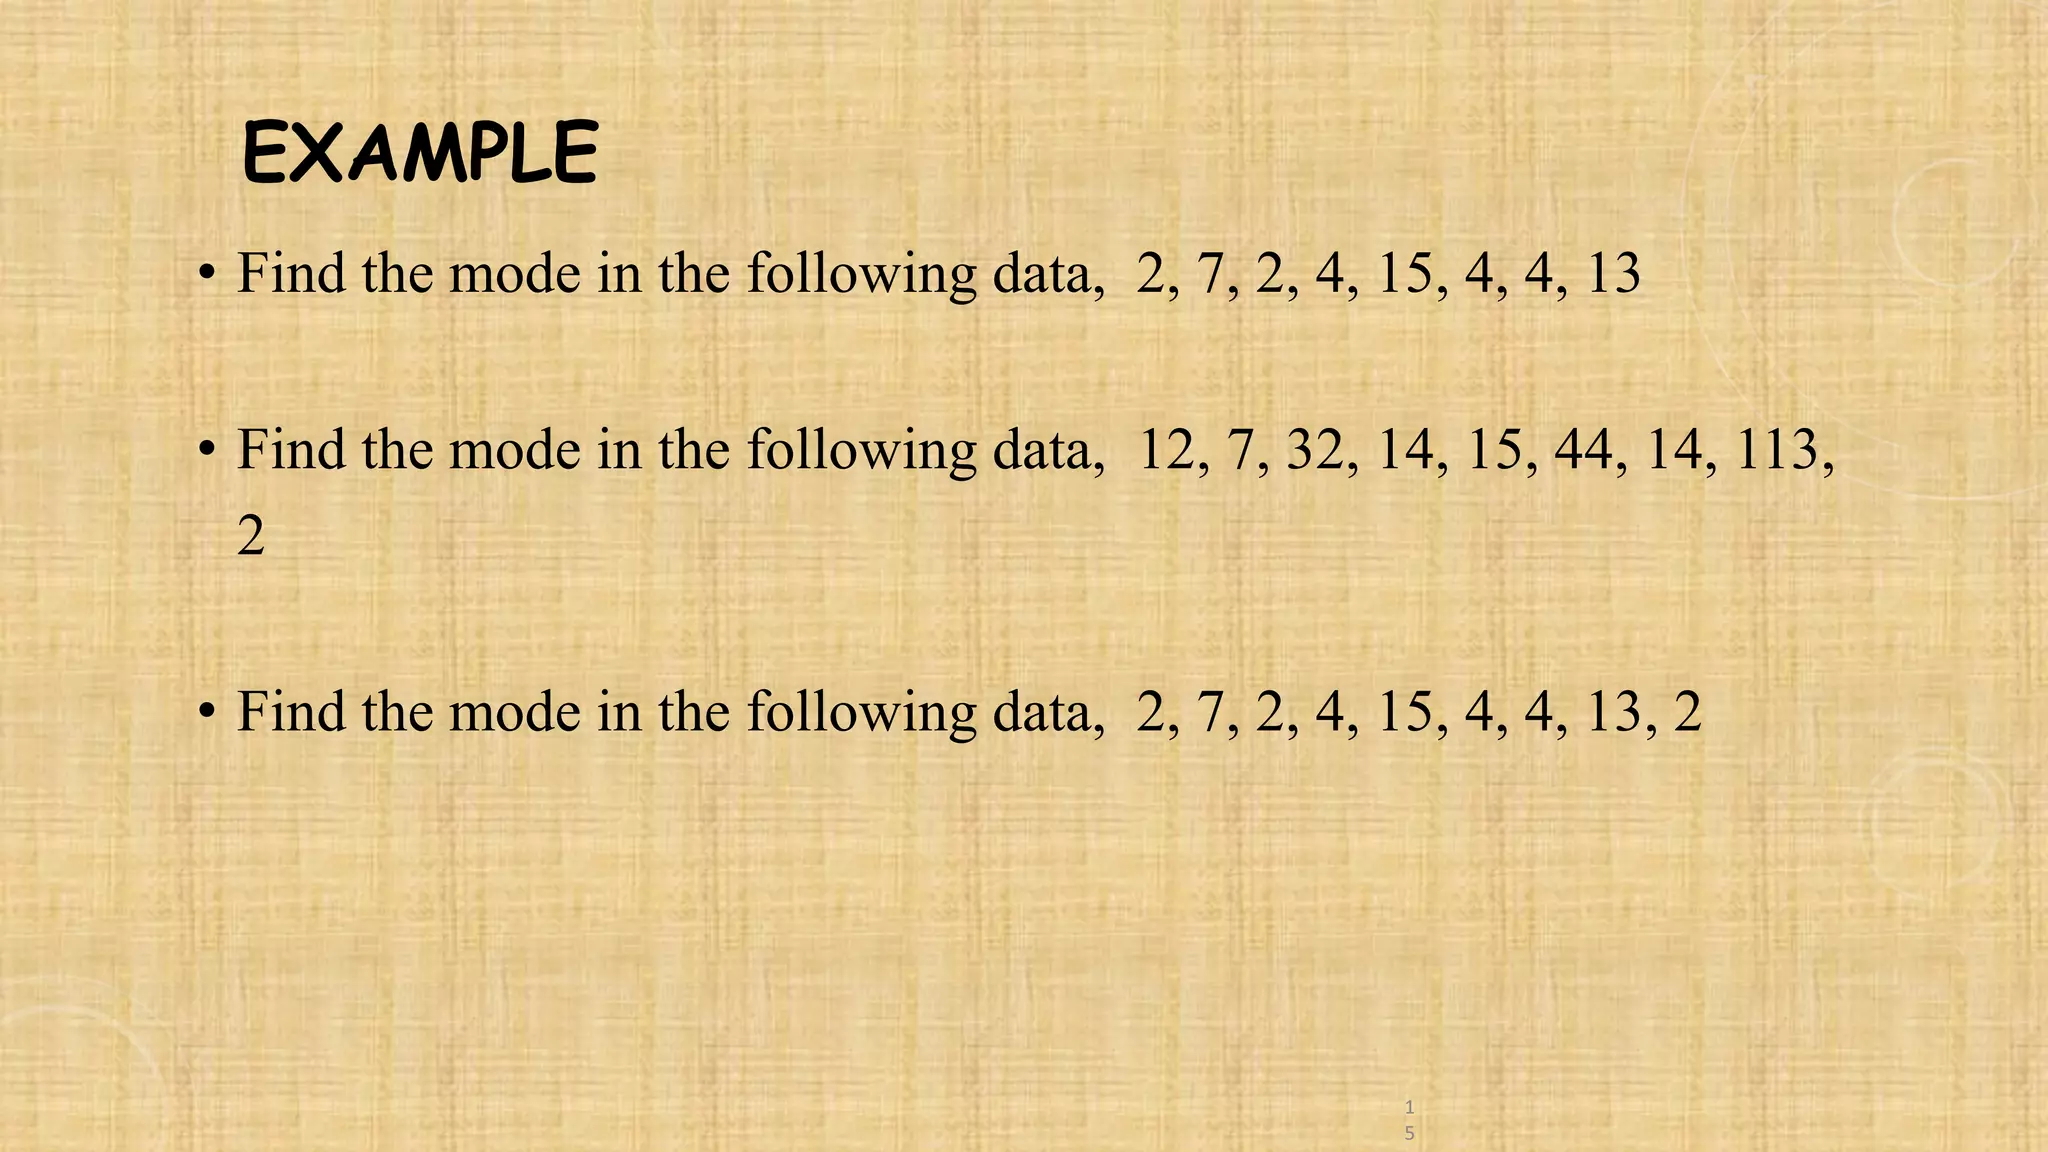
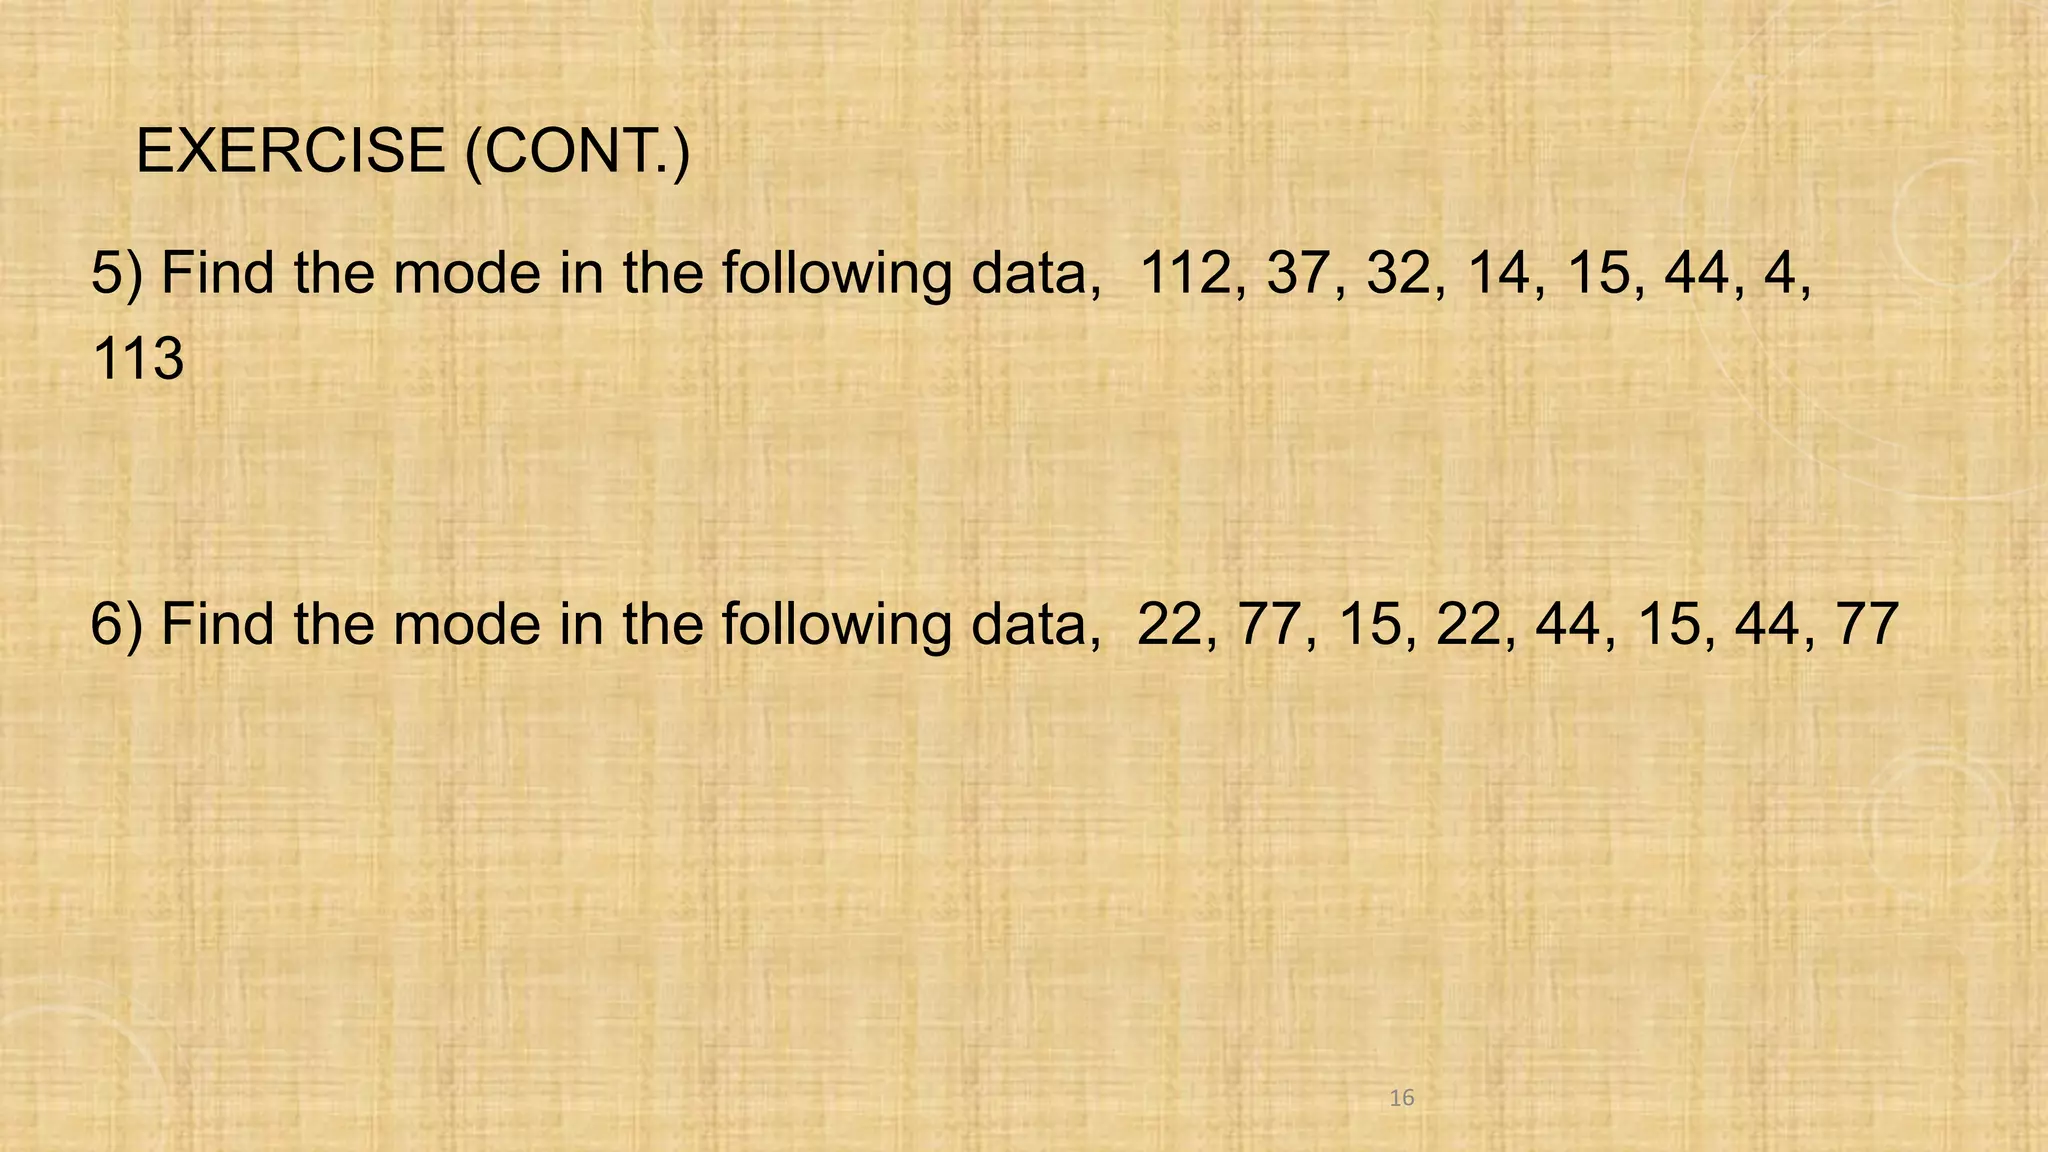
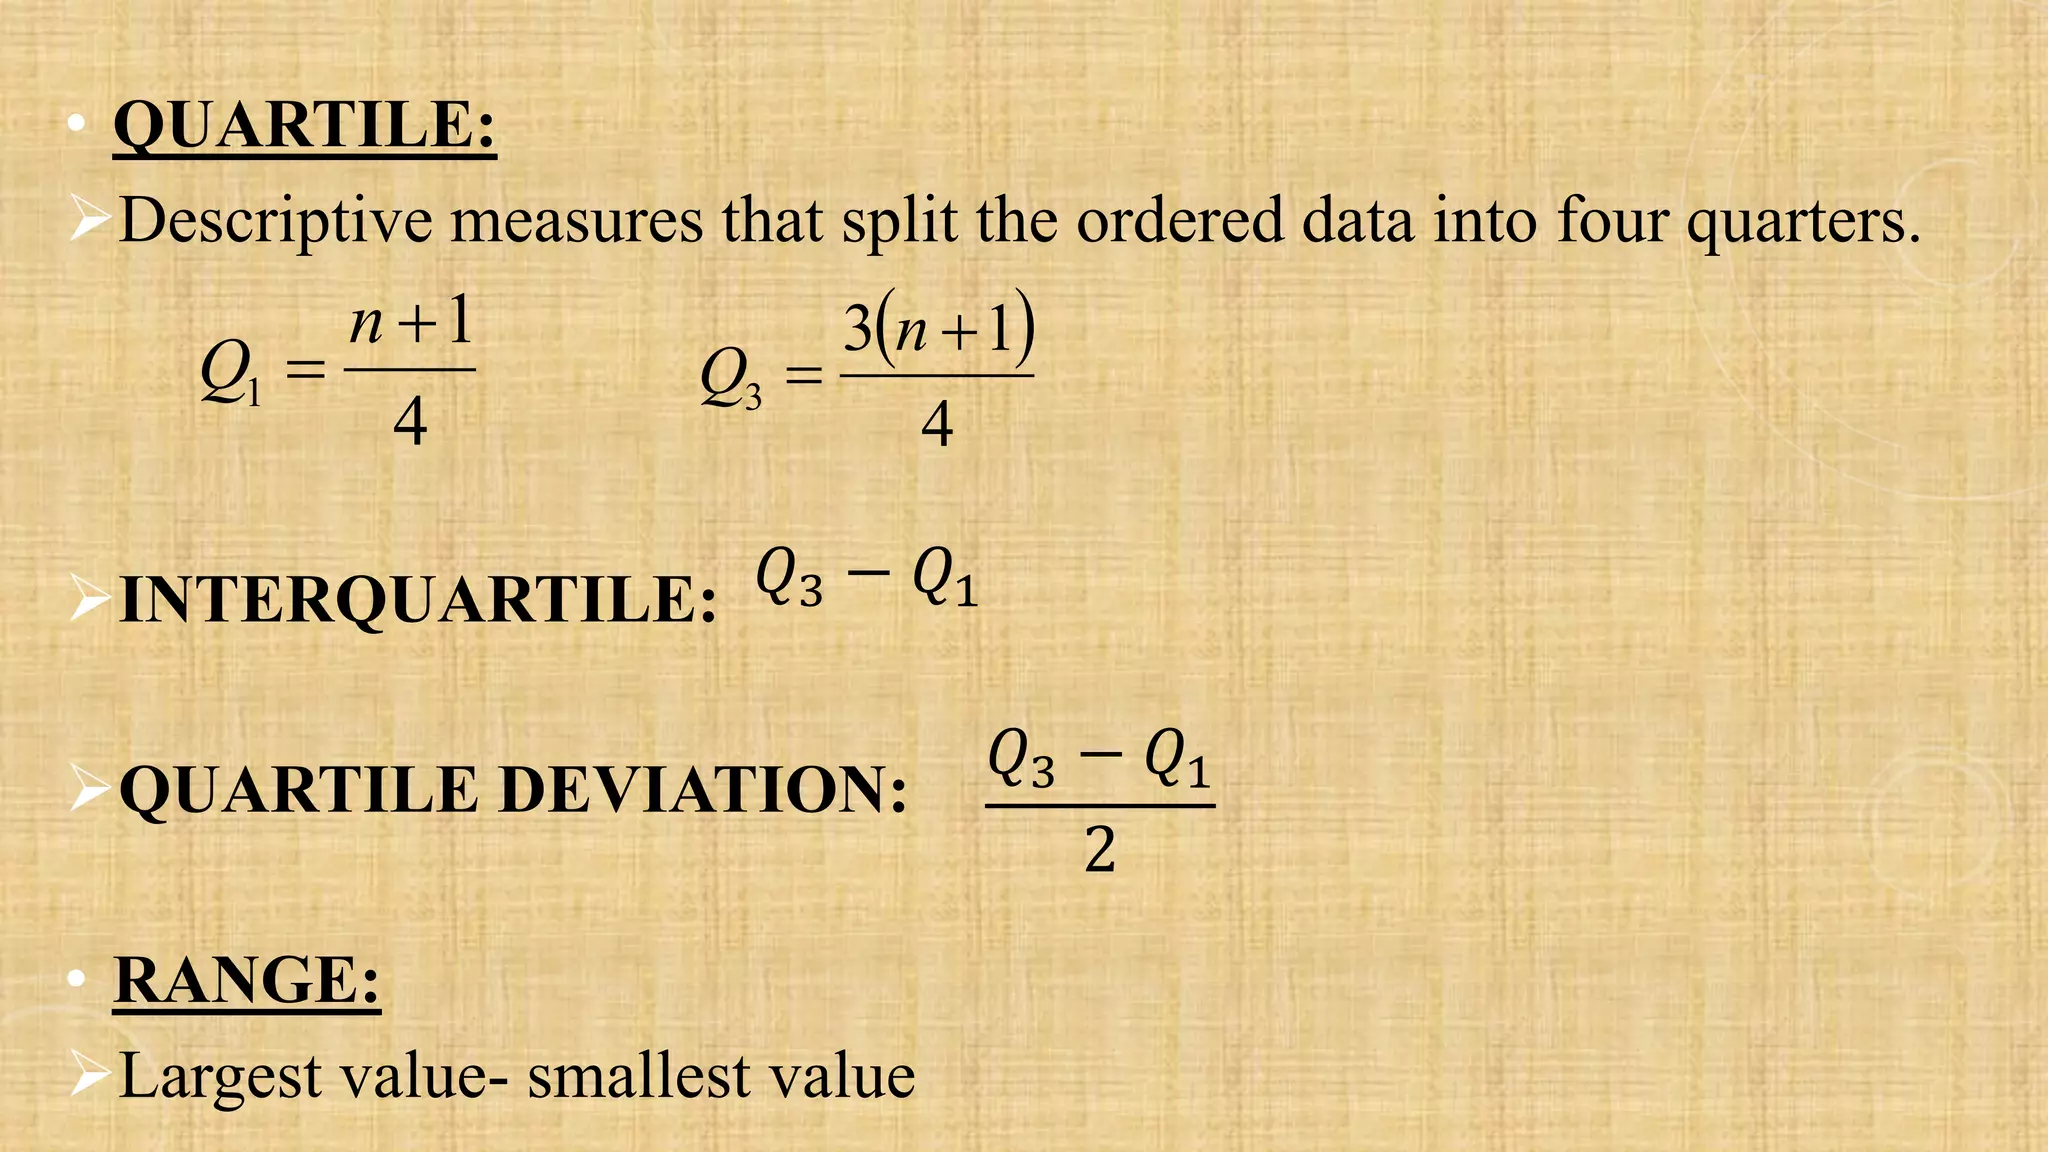
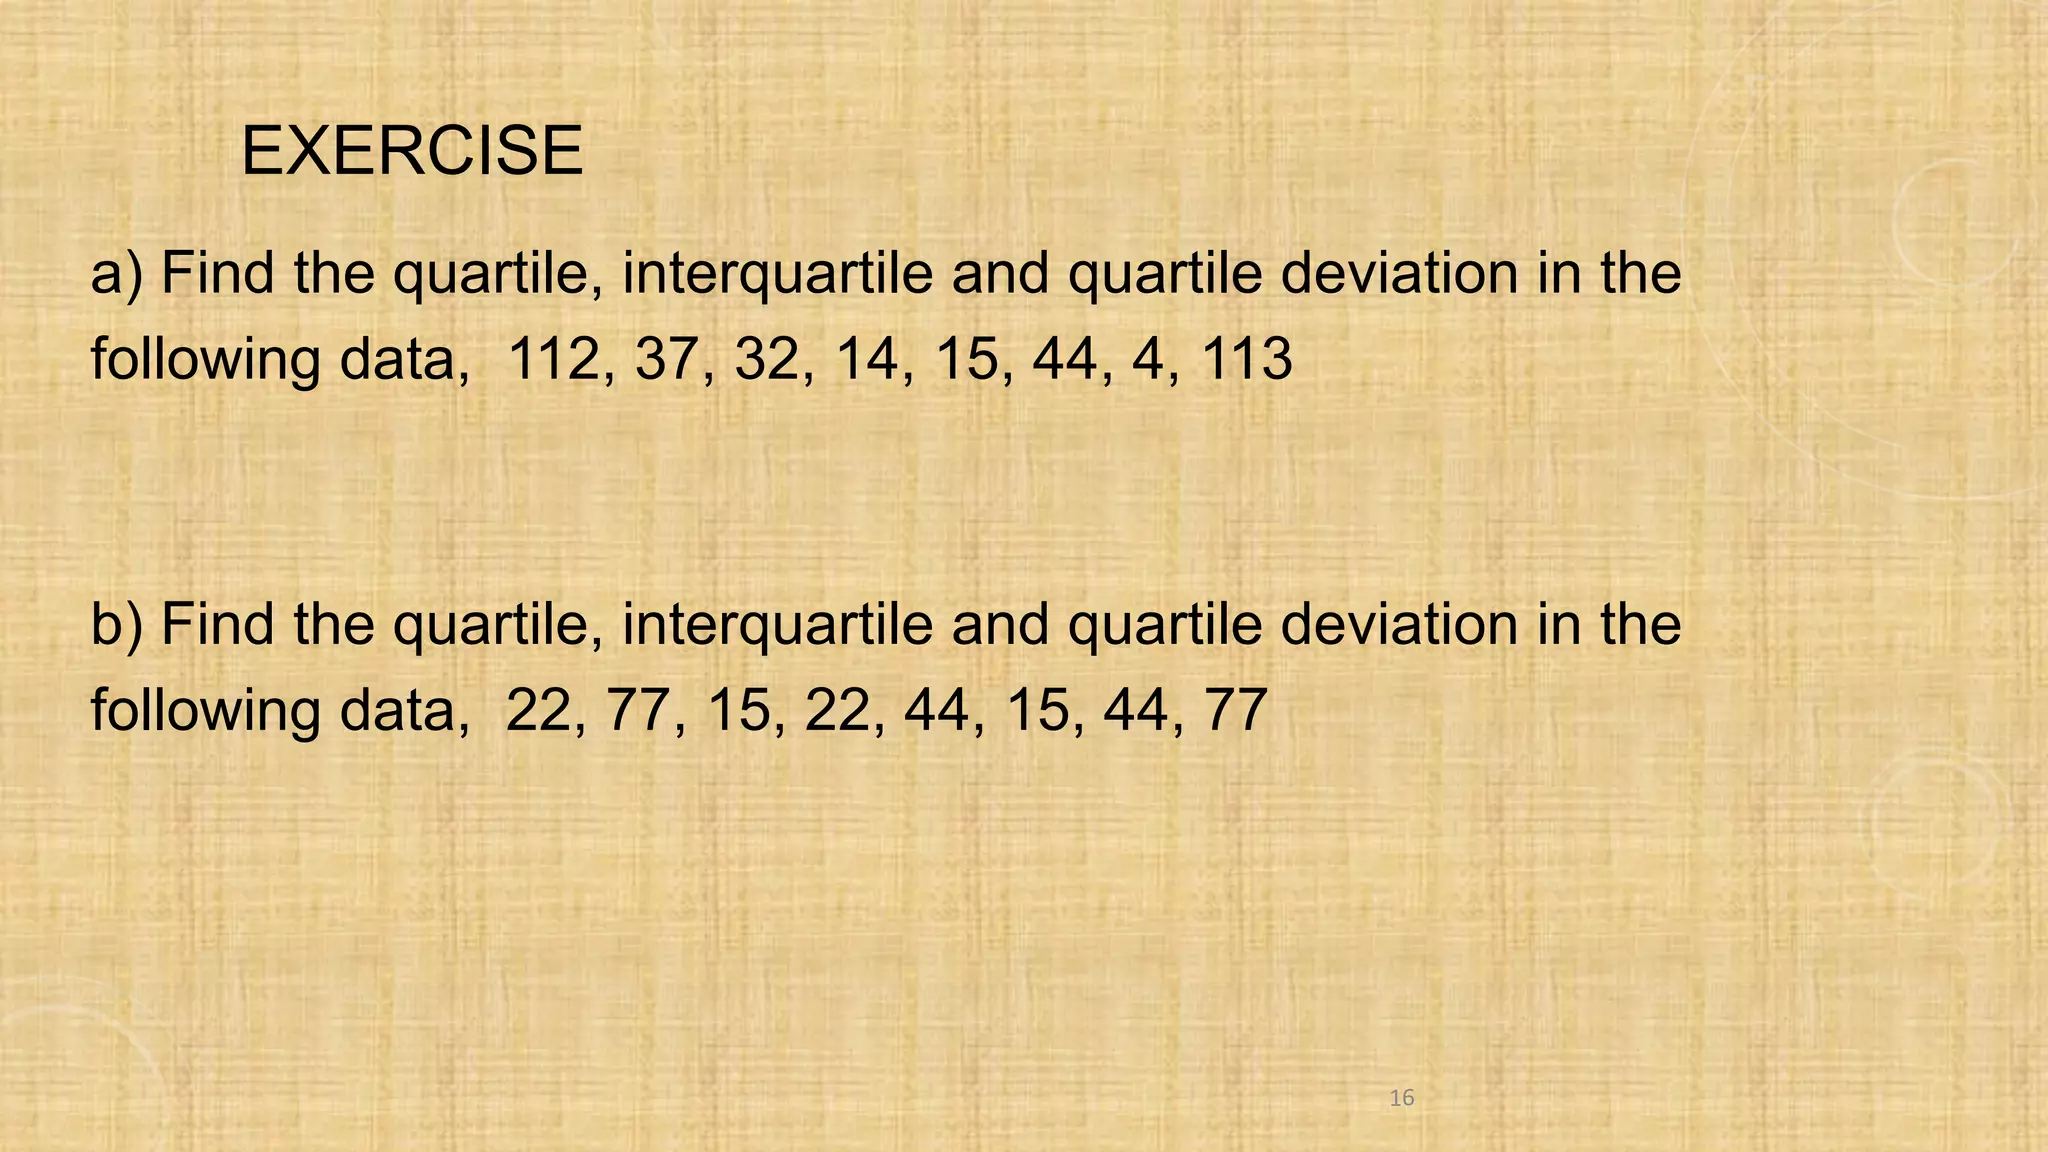
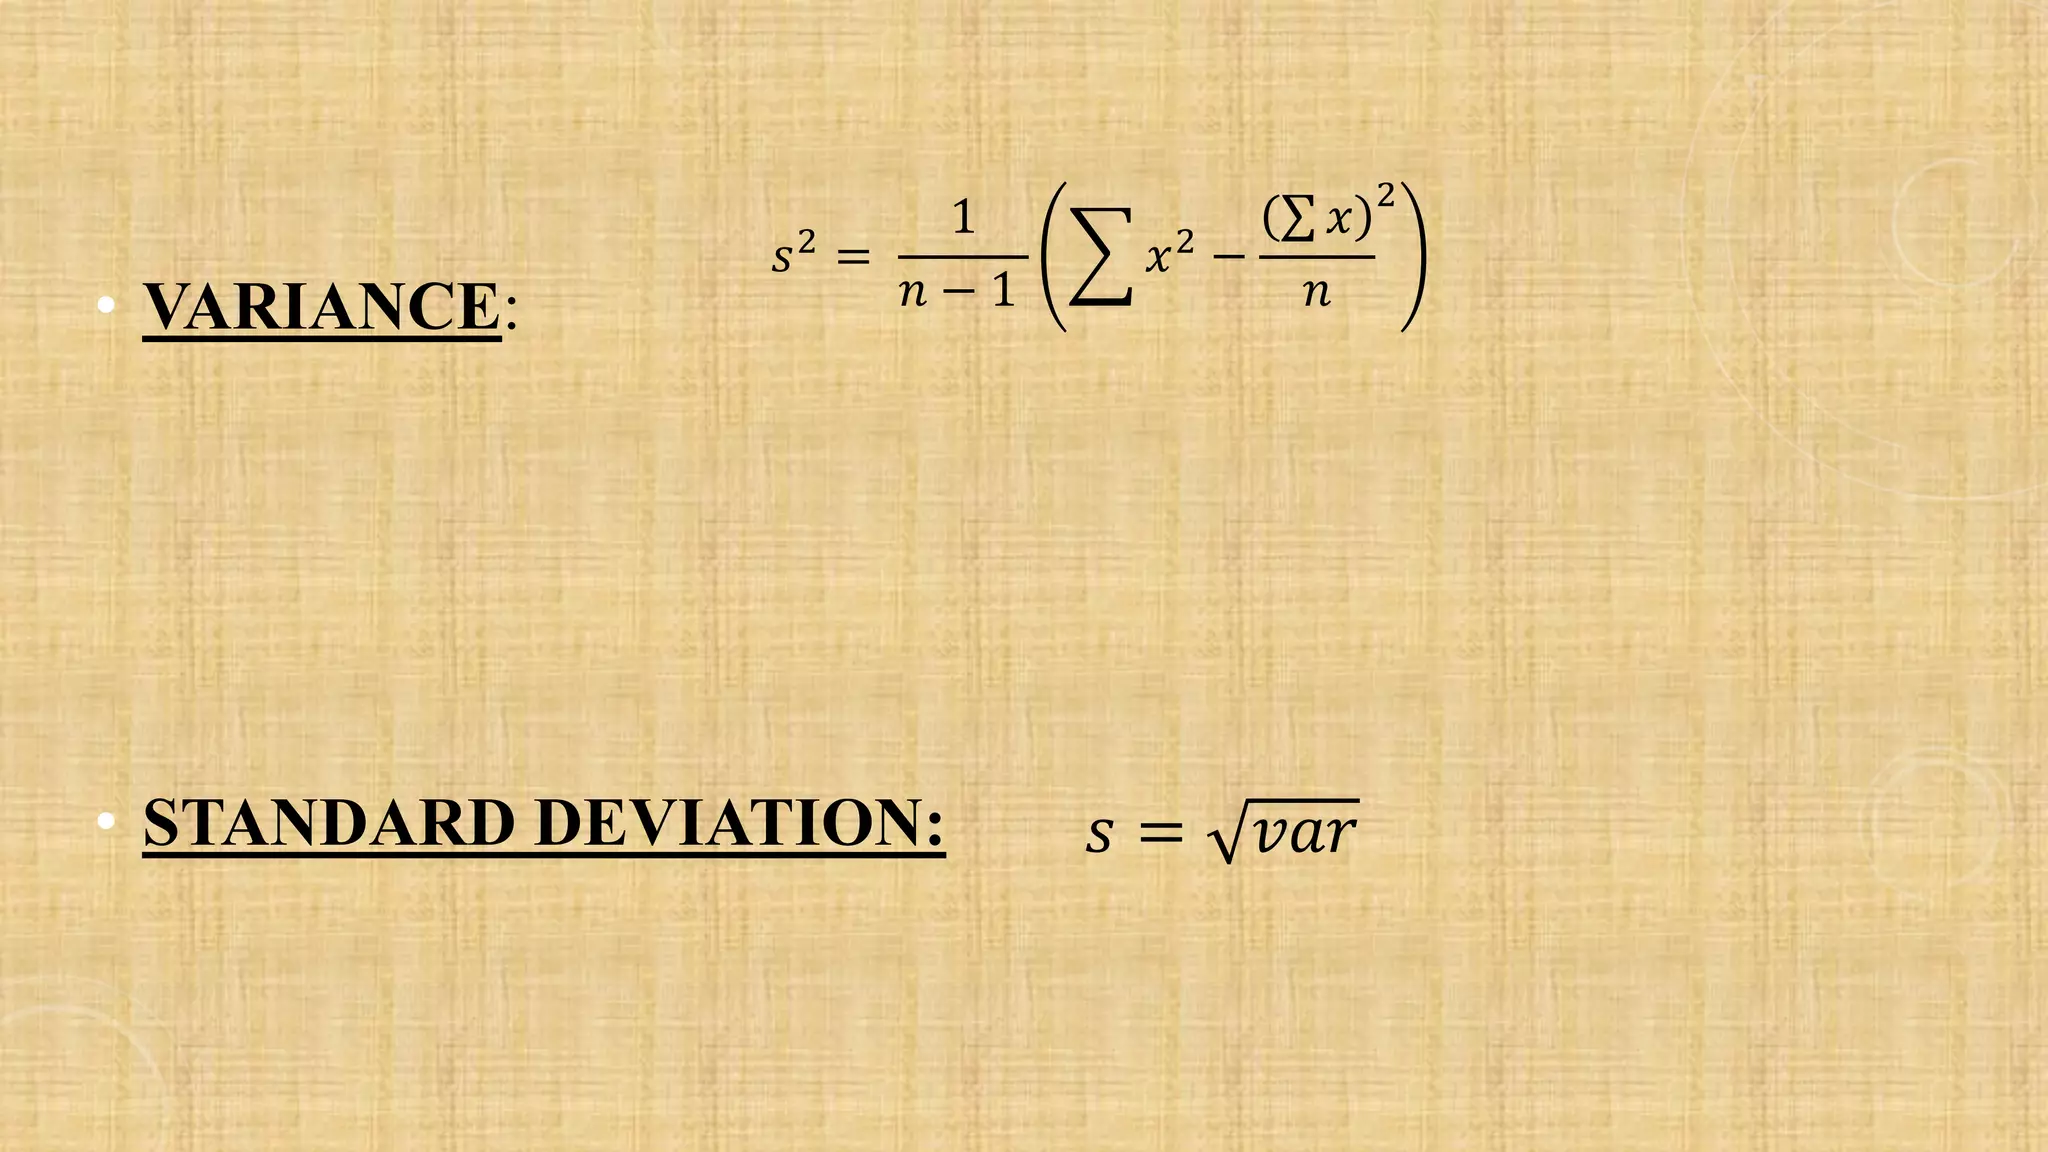
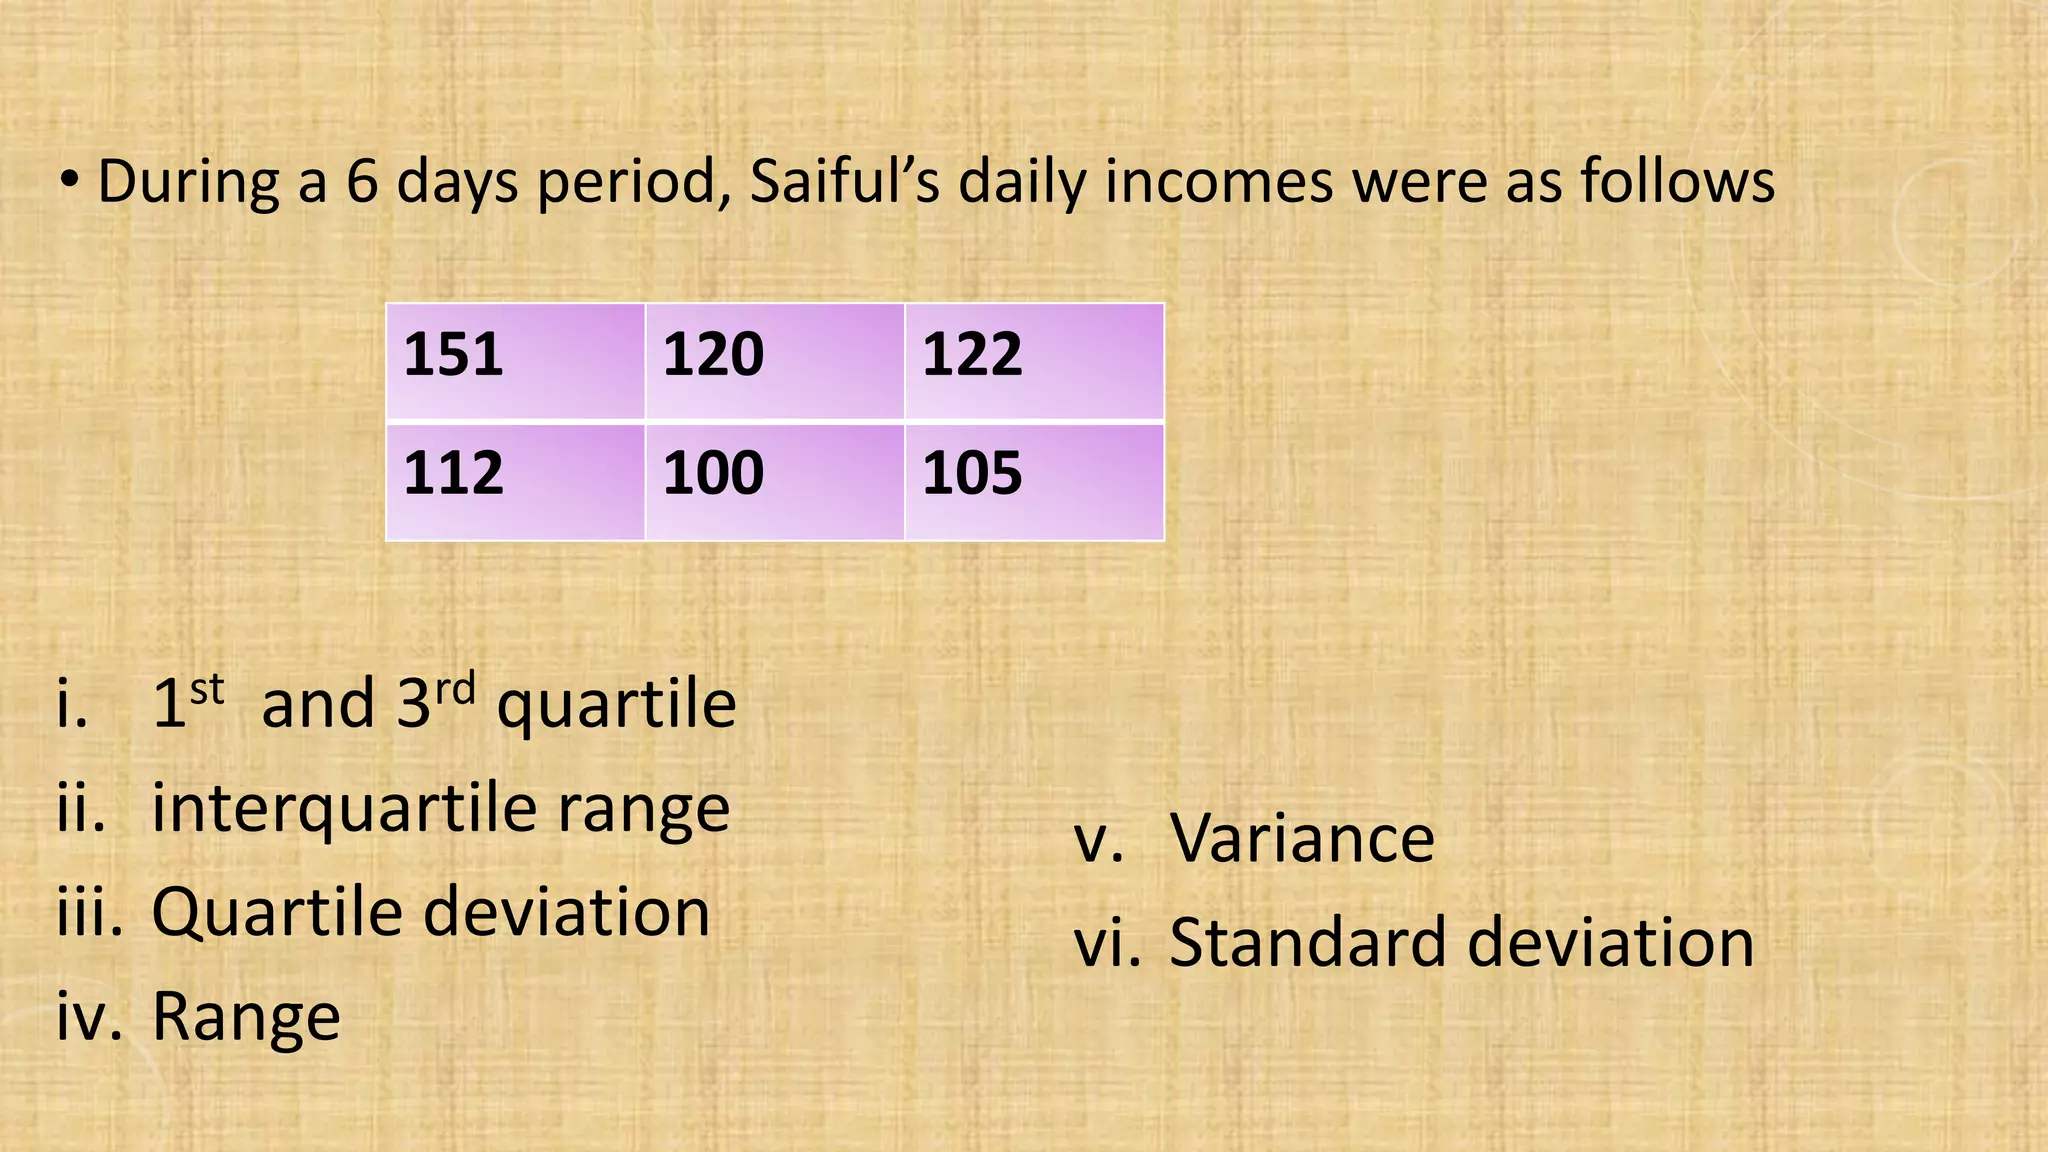
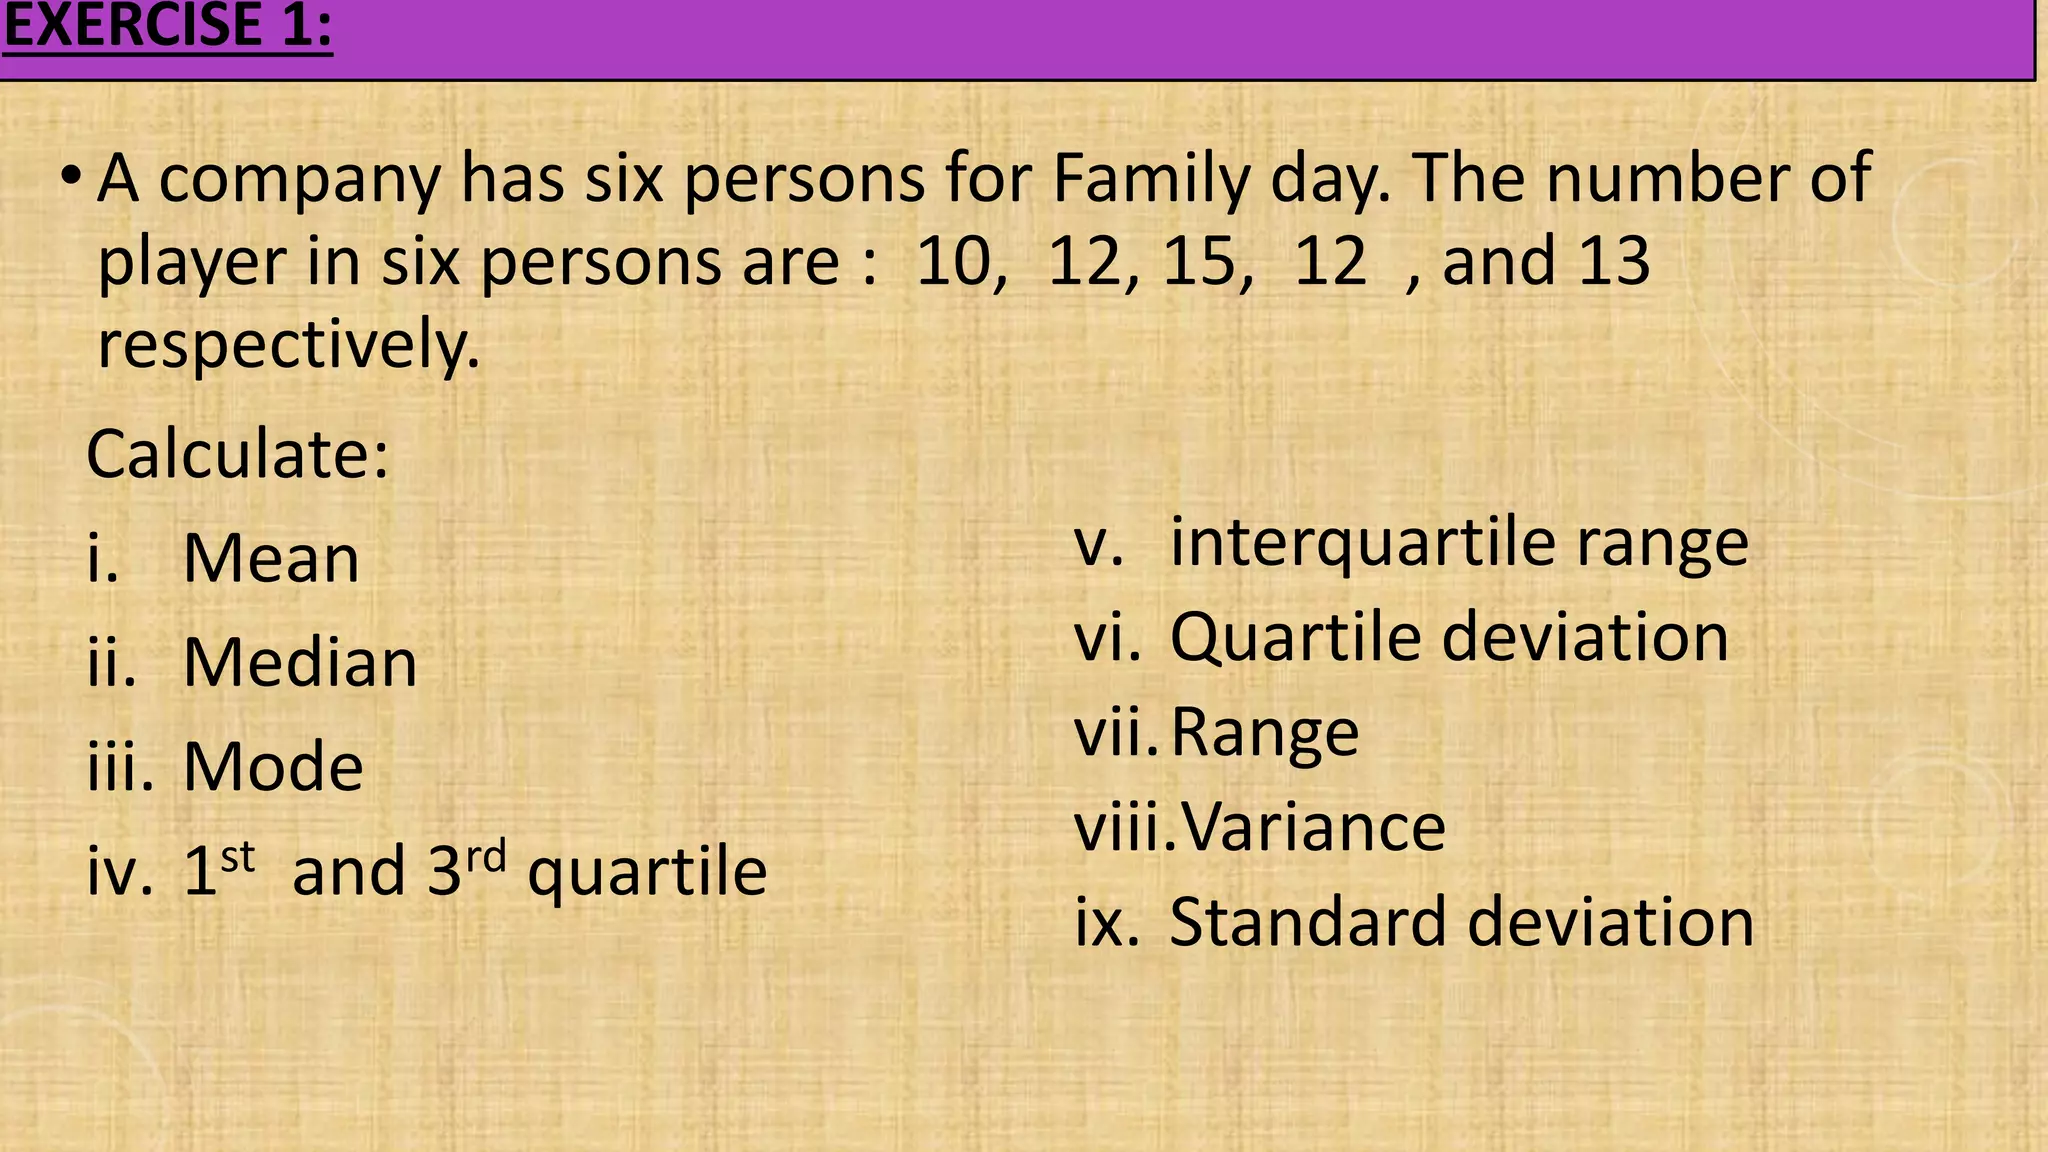
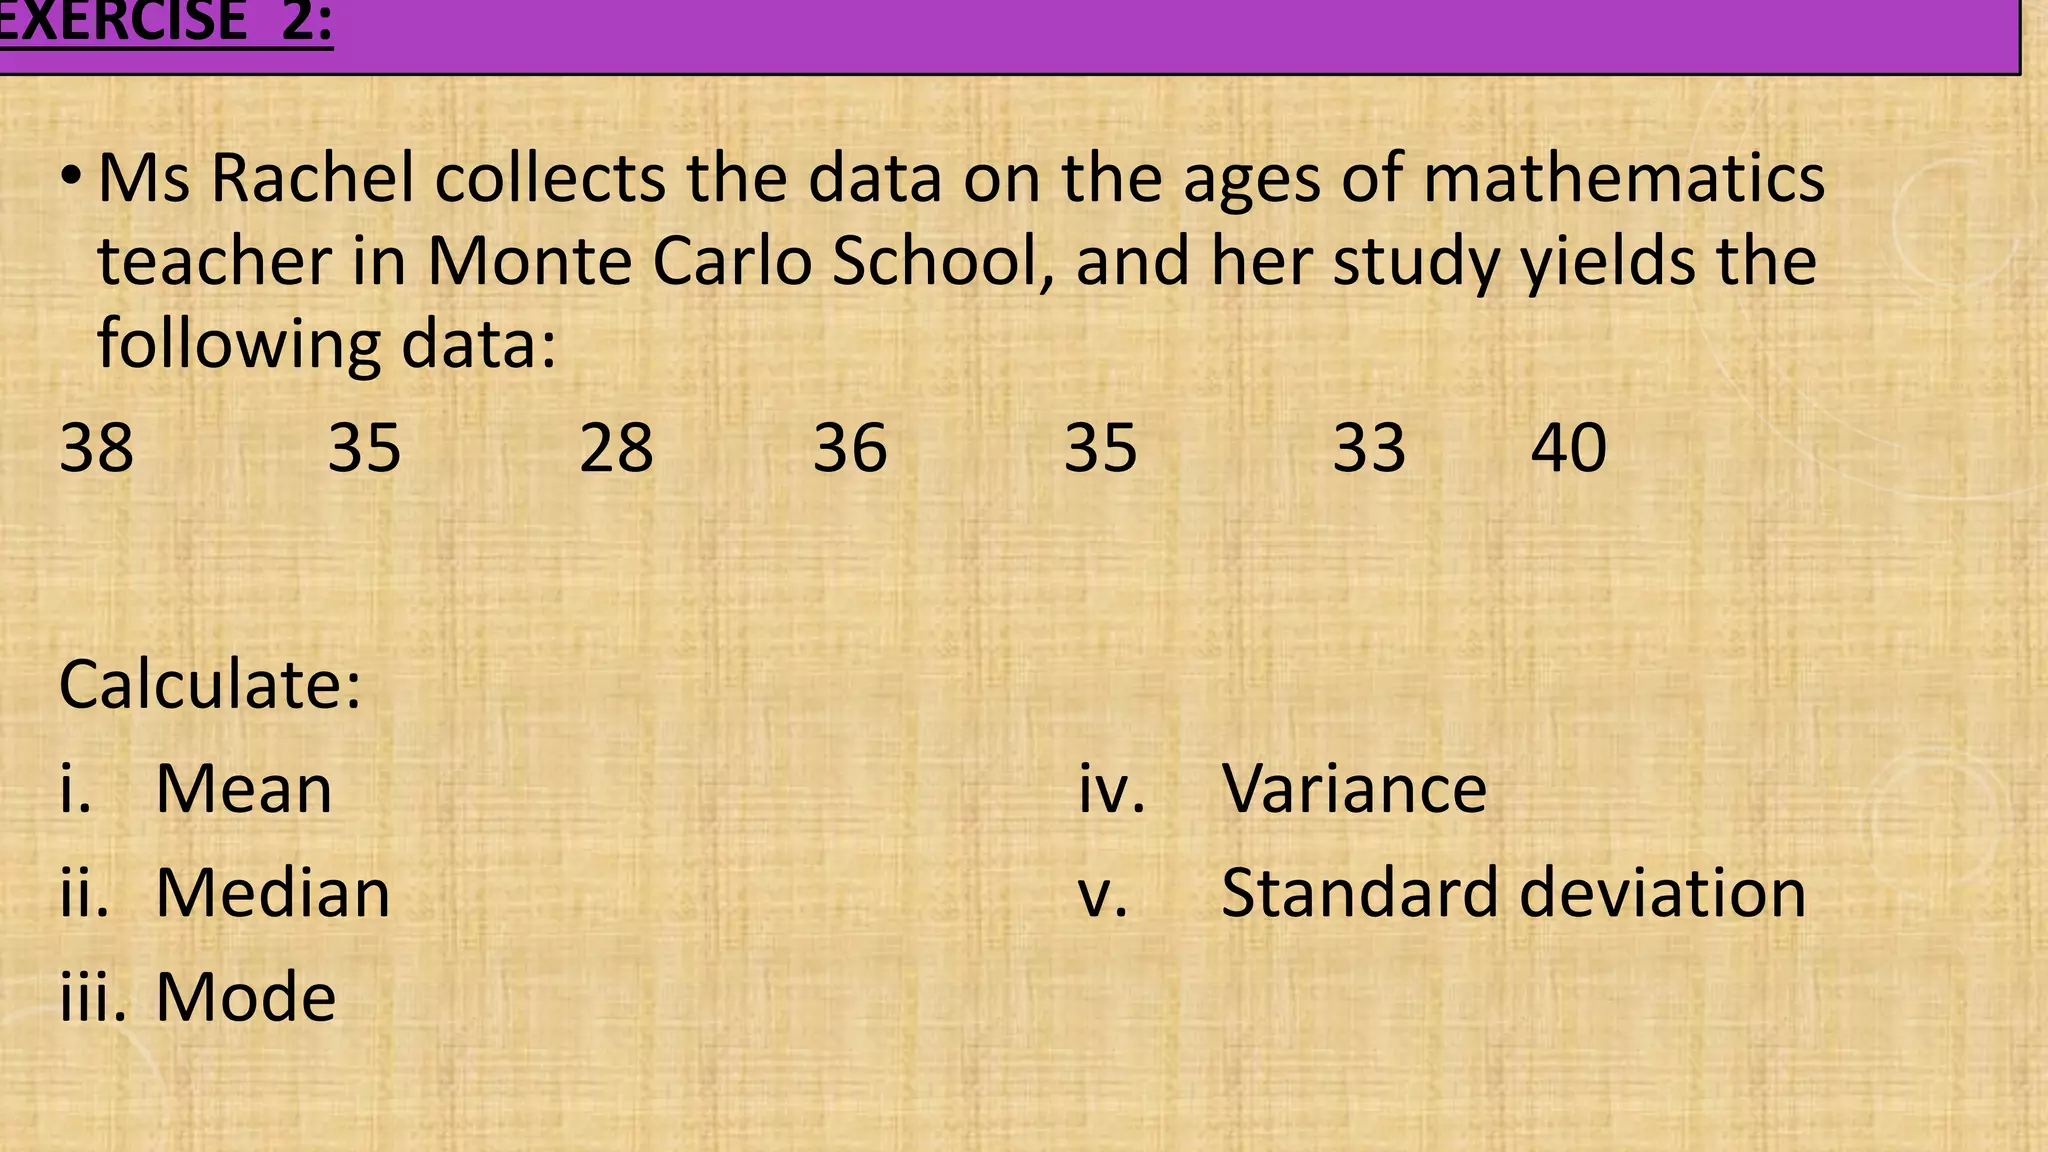
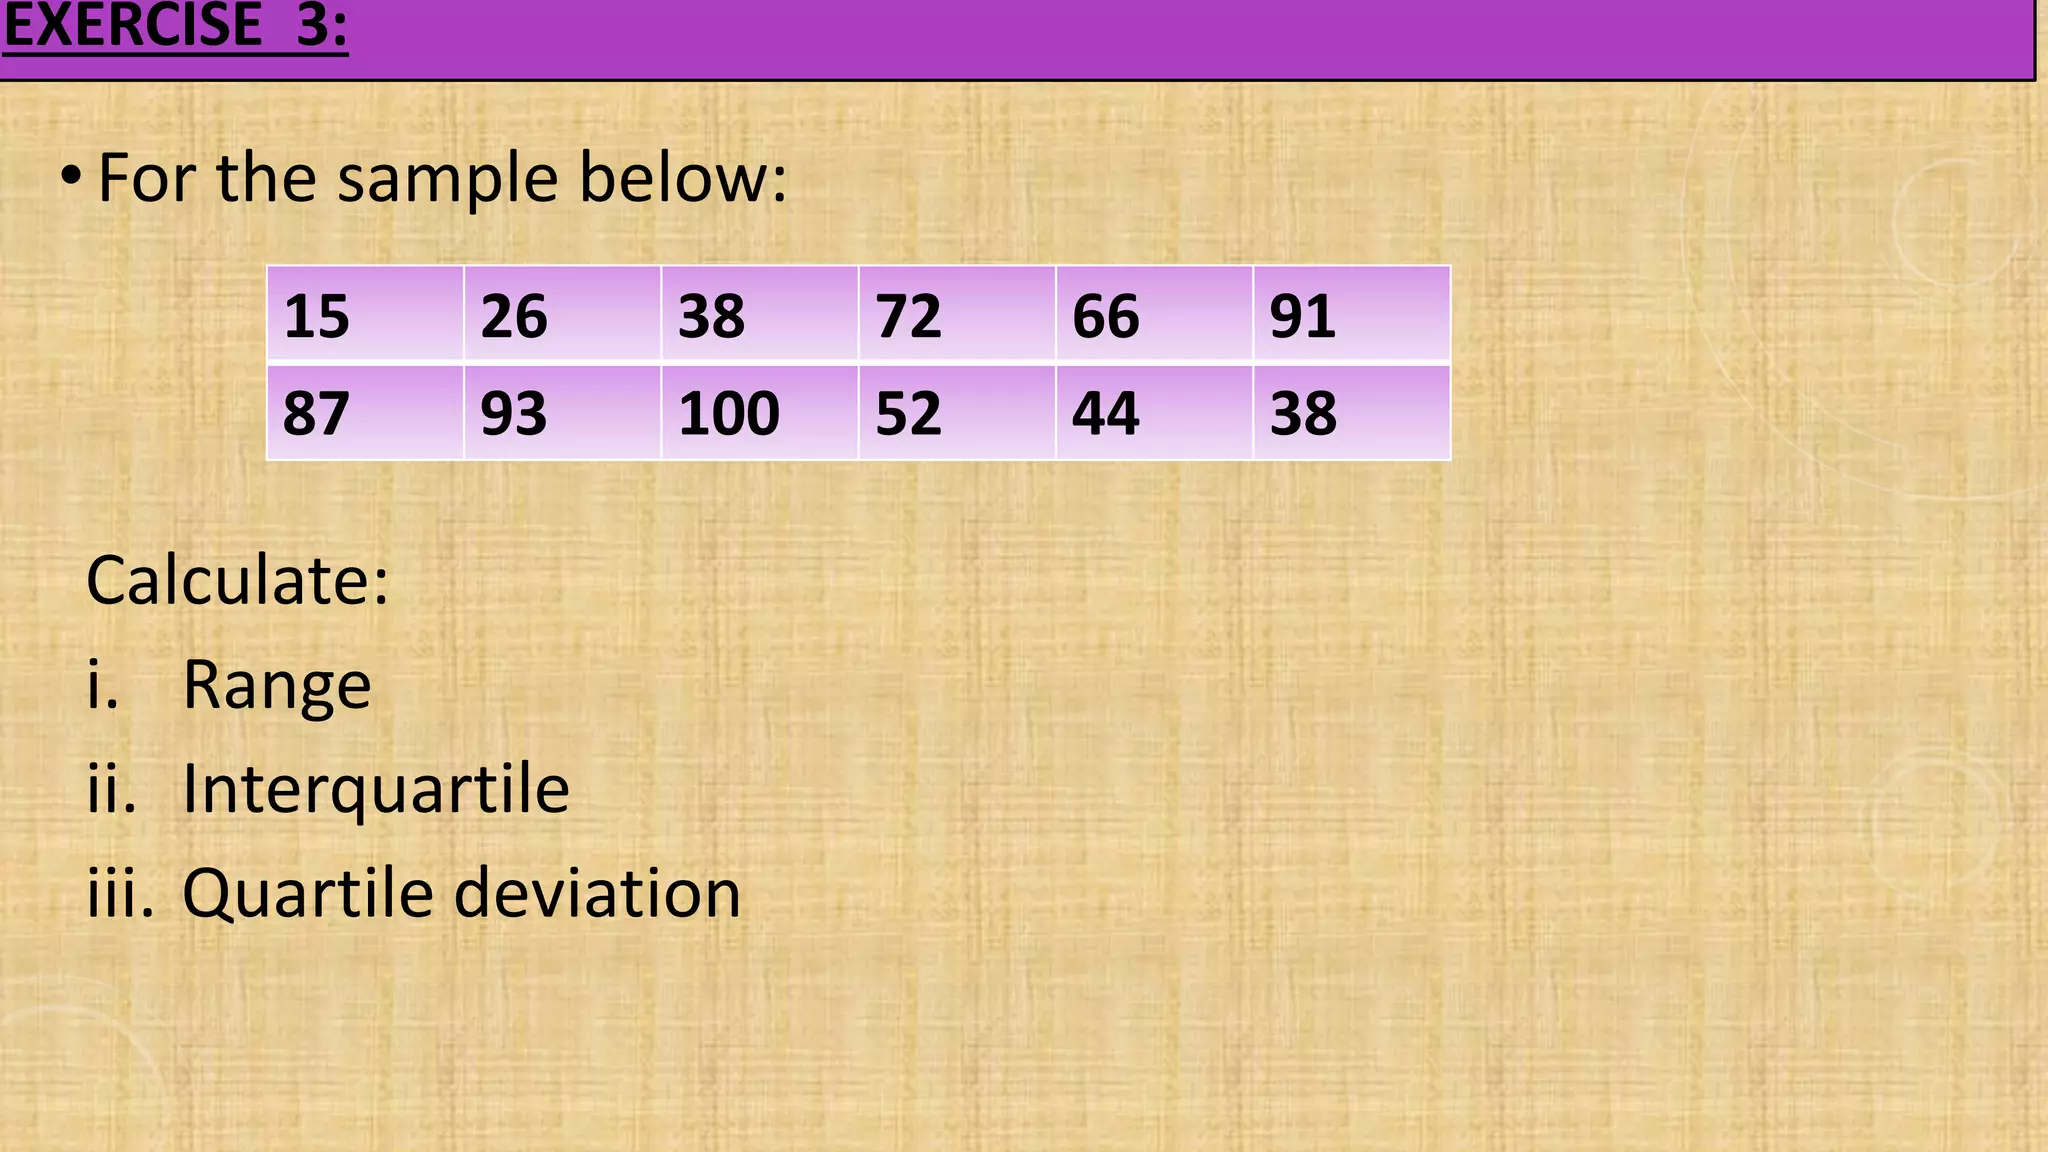
SlideShare a Scribd company logo
• If you don’t drive your business, you will be driven out of the business.
• (B. C. Forbes)
Preparedby:WAN NURULHUDA
FACULTY OF BUSINESS, FINANCE &
IT & SCHOOL OF HOSPITALITY
MANAGEMENT
MAHSAUniversity @2020
LESSON 4:
DESCRIPTIVE STATISTICS:
UNGROUPED DATA
LEARNING OBJECTIVES
The study of this chapter should enable you to:
• Organize raw data into a frequency distribution
• Present a frequency distribution into graphic forms
• Describe and calculate different measures of central
tendency
• Define and calculate different measures of dispersion and
skewness
• Descriptive statistics aims to summarize quantitative data without using the probabilistic
formulation and not to draw conclusions about the population as in inferential statistics.
• Although a data analysis uses inferential statistics to deduce the main conclusions, the
features of descriptive statistics are usually highlighted at the same time.
• The computer has become an important tool in the presentation and analysis of data.
Among the most popular and widely used statistical packages are SAS, SPSS, Stat
graphics and Minitab.
• The collected sample are referred to as raw data. This chapter discusses to how to
organize such raw data into a frequency distribution and then present it using graphic
forms.
INTRODUCTION
• A frequency distribution is a tabulation of values that contains
one or more variables in a sample. It summarizes the distribution
of values in the sample where each entry represents the
frequency or count of the occurrences of values within a
particular interval.
• It is much simpler to manage and operate the frequency tabulated
data than the raw data. With frequency tables, there are simple
formulas to calculate the important statistics.
• A frequency distribution for qualitative data lists all categories
and the number of elements that belong to each of the categories.
FREQUENCY DISTRIBUTION
• Ungrouped data which is also known as raw data is data that has not been placed in any group
or category after collection.
• Data is categorized in numbers or characteristics therefore, the data which has not been put in
any of the categories is ungrouped.
• For example, when conducting census and you want to analyze how many women above the age
of 45 are in a particular area, you first need to know how many people reside in that area.
Some of the advantages of ungrouped data are as follows;
•Most people can easily interpret it.
•When the sample size is small, it is easy to calculate the mean, mode and median.
•It does not require technical expertise to analyze it.
WHAT IS UNGROUPED
DATA?
Differences between Grouped Data and Ungrouped Data
•Classification of Grouped Data vs. Ungrouped Data
Grouped data is data that has been organized in classes after its analysis. Examples include how many bags of maize collected
during the rainy season were bad. On the other hand, ungrouped data is data which does not fall in any group. It is still raw
data.
•Preference of Grouped Data vs. Ungrouped Data
When collecting data, ungrouped data is preferred because the information is still in its original form. It has not been tampered
with by classification or subdivision. However, when analyzing it and drawing graphs, grouped data is preferred because it is
simple to interpret.
•Accuracy of Grouped Data vs. Ungrouped Data
When calculating the means of grouped and ungrouped data, there will be a variation. The mean of grouped data is preferred
because it is more accurate as compared to the mean of ungrouped data. The mean of ungrouped data may lead to wrong
manipulation of the median therefore it is considered inefficient in most cases.
•Representation of Grouped Data vs. Ungrouped Data
Frequency tables are used to show the information of grouped data whereas in the case of ungrouped data, the information
appears like a big list of of numbers. This is due to the fact that the information is still raw.
UNGROUPED DATA
• MEAN:
➢A set of data has only one mean (unique).
➢ The mean is a useful measure for comparing two or more populations.
• MEDIAN:
➢The median for ungrouped data is the midpoint of values after they have
been arranged from the
➢smallest to the largest, or the largest to the smallest
Median : * Middle value, if n is odd;
* Mean of the two middle values, if n is even.
MODE:
➢The mode of a set of measurements is the value that occurs most
frequently.
Mean
 x = sum of all observation
n = total number
•Mean is the sum of all data divided by the
total number.
•Formula,
9
ҧ
𝑥=
σ 𝑥
𝑛
1) Find the mean of the following data,
1, 4, 8, 15, 14, 20, 23.
2) Find the mean of the following data
122 145 136 122 111 187 118
136 121 110 154 125 166 126
EXERCISE
MEDIAN
•Median is the middle value of a set of
data.
•But, when data are arranged in order.
•When there is an extreme value in the
data, the median is more suitable to be
used for representing the data.
1
EXAMPLE
•Find the median of the following sets of data,
3, 4, 7, 3, 10, 12, 5
rearrange : 3, 3, 4, 5, 7, 10, 12
= 3, 3, 4, 5, 7, 10, 12
= 5
Exercise
3) Find the median of the following sets of data,
9, 7, 2, 4, 15, 10, 8
4) Find the median of the following sets of data,
91, 70, 2, 40, 15, 100, 8, 130
1
3
MODE
•Mode is the data value that occurs with the highest
frequency in a set of data.
•The mode is an important representation
for categorical data.
•Example:
1
4
1
5
• Find the mode in the following data, 2, 7, 2, 4, 15, 4, 4, 13
• Find the mode in the following data, 12, 7, 32, 14, 15, 44, 14, 113,
2
• Find the mode in the following data, 2, 7, 2, 4, 15, 4, 4, 13, 2
EXAMPLE
EXERCISE (CONT.)
5) Find the mode in the following data, 112, 37, 32, 14, 15, 44, 4,
113
6) Find the mode in the following data, 22, 77, 15, 22, 44, 15, 44, 77
16
• QUARTILE:
➢Descriptive measures that split the ordered data into four quarters.
➢INTERQUARTILE:
➢QUARTILE DEVIATION:
• RANGE:
➢Largest value- smallest value
4
1
1
+
=
n
Q
( )
4
1
3
3
+
=
n
Q
𝑄3 − 𝑄1
𝑄3 − 𝑄1
2
EXERCISE
a) Find the quartile, interquartile and quartile deviation in the
following data, 112, 37, 32, 14, 15, 44, 4, 113
b) Find the quartile, interquartile and quartile deviation in the
following data, 22, 77, 15, 22, 44, 15, 44, 77
16
• VARIANCE:
• STANDARD DEVIATION:
𝑠2 =
1
𝑛 − 1
෍ 𝑥2 −
σ 𝑥
𝑛
2
𝑠 = 𝑣𝑎𝑟
151 120 122
112 100 105
• During a 6 days period, Saiful’s daily incomes were as follows
i. 1st and 3rd quartile
ii. interquartile range
iii. Quartile deviation
iv. Range
v. Variance
vi. Standard deviation
EXERCISE 1:
• A company has six persons for Family day. The number of
player in six persons are : 10, 12, 15, 12 , and 13
respectively.
Calculate:
i. Mean
ii. Median
iii. Mode
iv. 1st and 3rd quartile
v. interquartile range
vi. Quartile deviation
vii.Range
viii.Variance
ix. Standard deviation
EXERCISE 2:
• Ms Rachel collects the data on the ages of mathematics
teacher in Monte Carlo School, and her study yields the
following data:
38 35 28 36 35 33 40
Calculate:
i. Mean
ii. Median
iii. Mode
iv. Variance
v. Standard deviation
EXERCISE 3:
• For the sample below:
Calculate:
i. Range
ii. Interquartile
iii. Quartile deviation
15 26 38 72 66 91
87 93 100 52 44 38
Preparedby:WAN NURULHUDA
FACULTY OF BUSINESS, FINANCE &
IT & SCHOOL OF HOSPITALITY
MANAGEMENT
MAHSAUniversity @2020

More Related Content

Similar to LESSON 4_UNGROUPED.pptx.pdf

Presentation1.pptx
Presentation1.pptxPresentation1.pptx
Presentation1.pptx
IndhuGreen
 
Pelatihan Data Analitik
Pelatihan Data AnalitikPelatihan Data Analitik
Pelatihan Data Analitik
John Sihotang, Dr, MM, Ir
 
Exploratory Data Analysis - Satyajit.pdf
Exploratory Data Analysis - Satyajit.pdfExploratory Data Analysis - Satyajit.pdf
Exploratory Data Analysis - Satyajit.pdf
AmmarAhmedSiddiqui2
 
Introduction to Statistics .pdf
Introduction to Statistics .pdfIntroduction to Statistics .pdf
Introduction to Statistics .pdf
A. Dally Maria Evangeline
 
Descriptive statistics
Descriptive statisticsDescriptive statistics
Descriptive statistics
Anand Thokal
 
Data Collection Preparation
Data Collection PreparationData Collection Preparation
Data Collection Preparation
Business Student
 
QUANTITATIVE-DATA.pptx
QUANTITATIVE-DATA.pptxQUANTITATIVE-DATA.pptx
QUANTITATIVE-DATA.pptx
ViaFortuna
 
Data Analysis
Data AnalysisData Analysis
Biostatistics mean median mode unit 1.pptx
Biostatistics mean median mode unit 1.pptxBiostatistics mean median mode unit 1.pptx
Biostatistics mean median mode unit 1.pptx
SailajaReddyGunnam
 
Chapter 6 data analysis iec11
Chapter 6 data analysis iec11Chapter 6 data analysis iec11
Chapter 6 data analysis iec11
Ho Cao Viet
 
Data analysis
Data analysisData analysis
Data analysis
Titus Mutambu Mweta
 
Data Analysis, Intepretation
Data Analysis, IntepretationData Analysis, Intepretation
Biostatistics.pptx
Biostatistics.pptxBiostatistics.pptx
Biostatistics.pptx
Tawhid4
 
Data Processing & Explain each term in details.pptx
Data Processing & Explain each term in details.pptxData Processing & Explain each term in details.pptx
Data Processing & Explain each term in details.pptx
PratikshaSurve4
 
LECTURE 3 - inferential statistics bmaths
LECTURE 3 - inferential statistics bmathsLECTURE 3 - inferential statistics bmaths
LECTURE 3 - inferential statistics bmaths
jafari12
 
RM UNIT 6.pptx
RM UNIT 6.pptxRM UNIT 6.pptx
RM UNIT 6.pptx
PallawiBulakh1
 
The Research specifically DataAnalysis.pptx
The Research specifically DataAnalysis.pptxThe Research specifically DataAnalysis.pptx
The Research specifically DataAnalysis.pptx
CasylouMendozaBorqui
 
Dmblog
DmblogDmblog
STATISTICS.pptx for the scholars and students
STATISTICS.pptx for the scholars and studentsSTATISTICS.pptx for the scholars and students
STATISTICS.pptx for the scholars and students
ssuseref12b21
 
2. basic statistics
2. basic statistics2. basic statistics
2. basic statistics
Steve Saffhill
 

Similar to LESSON 4_UNGROUPED.pptx.pdf (20)

Presentation1.pptx
Presentation1.pptxPresentation1.pptx
Presentation1.pptx
 
Pelatihan Data Analitik
Pelatihan Data AnalitikPelatihan Data Analitik
Pelatihan Data Analitik
 
Exploratory Data Analysis - Satyajit.pdf
Exploratory Data Analysis - Satyajit.pdfExploratory Data Analysis - Satyajit.pdf
Exploratory Data Analysis - Satyajit.pdf
 
Introduction to Statistics .pdf
Introduction to Statistics .pdfIntroduction to Statistics .pdf
Introduction to Statistics .pdf
 
Descriptive statistics
Descriptive statisticsDescriptive statistics
Descriptive statistics
 
Data Collection Preparation
Data Collection PreparationData Collection Preparation
Data Collection Preparation
 
QUANTITATIVE-DATA.pptx
QUANTITATIVE-DATA.pptxQUANTITATIVE-DATA.pptx
QUANTITATIVE-DATA.pptx
 
Data Analysis
Data AnalysisData Analysis
Data Analysis
 
Biostatistics mean median mode unit 1.pptx
Biostatistics mean median mode unit 1.pptxBiostatistics mean median mode unit 1.pptx
Biostatistics mean median mode unit 1.pptx
 
Chapter 6 data analysis iec11
Chapter 6 data analysis iec11Chapter 6 data analysis iec11
Chapter 6 data analysis iec11
 
Data analysis
Data analysisData analysis
Data analysis
 
Data Analysis, Intepretation
Data Analysis, IntepretationData Analysis, Intepretation
Data Analysis, Intepretation
 
Biostatistics.pptx
Biostatistics.pptxBiostatistics.pptx
Biostatistics.pptx
 
Data Processing & Explain each term in details.pptx
Data Processing & Explain each term in details.pptxData Processing & Explain each term in details.pptx
Data Processing & Explain each term in details.pptx
 
LECTURE 3 - inferential statistics bmaths
LECTURE 3 - inferential statistics bmathsLECTURE 3 - inferential statistics bmaths
LECTURE 3 - inferential statistics bmaths
 
RM UNIT 6.pptx
RM UNIT 6.pptxRM UNIT 6.pptx
RM UNIT 6.pptx
 
The Research specifically DataAnalysis.pptx
The Research specifically DataAnalysis.pptxThe Research specifically DataAnalysis.pptx
The Research specifically DataAnalysis.pptx
 
Dmblog
DmblogDmblog
Dmblog
 
STATISTICS.pptx for the scholars and students
STATISTICS.pptx for the scholars and studentsSTATISTICS.pptx for the scholars and students
STATISTICS.pptx for the scholars and students
 
2. basic statistics
2. basic statistics2. basic statistics
2. basic statistics
 

Recently uploaded

Software Engineering and Project Management - Software Testing + Agile Method...
Software Engineering and Project Management - Software Testing + Agile Method...Software Engineering and Project Management - Software Testing + Agile Method...
Software Engineering and Project Management - Software Testing + Agile Method...
Prakhyath Rai
 
Rainfall intensity duration frequency curve statistical analysis and modeling...
Rainfall intensity duration frequency curve statistical analysis and modeling...Rainfall intensity duration frequency curve statistical analysis and modeling...
Rainfall intensity duration frequency curve statistical analysis and modeling...
bijceesjournal
 
SCALING OF MOS CIRCUITS m .pptx
SCALING OF MOS CIRCUITS m                 .pptxSCALING OF MOS CIRCUITS m                 .pptx
SCALING OF MOS CIRCUITS m .pptx
harshapolam10
 
Object Oriented Analysis and Design - OOAD
Object Oriented Analysis and Design - OOADObject Oriented Analysis and Design - OOAD
Object Oriented Analysis and Design - OOAD
PreethaV16
 
Design and optimization of ion propulsion drone
Design and optimization of ion propulsion droneDesign and optimization of ion propulsion drone
Design and optimization of ion propulsion drone
bjmsejournal
 
Electric vehicle and photovoltaic advanced roles in enhancing the financial p...
Electric vehicle and photovoltaic advanced roles in enhancing the financial p...Electric vehicle and photovoltaic advanced roles in enhancing the financial p...
Electric vehicle and photovoltaic advanced roles in enhancing the financial p...
IJECEIAES
 
Mechanical Engineering on AAI Summer Training Report-003.pdf
Mechanical Engineering on AAI Summer Training Report-003.pdfMechanical Engineering on AAI Summer Training Report-003.pdf
Mechanical Engineering on AAI Summer Training Report-003.pdf
21UME003TUSHARDEB
 
Welding Metallurgy Ferrous Materials.pdf
Welding Metallurgy Ferrous Materials.pdfWelding Metallurgy Ferrous Materials.pdf
Welding Metallurgy Ferrous Materials.pdf
AjmalKhan50578
 
Properties Railway Sleepers and Test.pptx
Properties Railway Sleepers and Test.pptxProperties Railway Sleepers and Test.pptx
Properties Railway Sleepers and Test.pptx
MDSABBIROJJAMANPAYEL
 
一比一原版(osu毕业证书)美国俄勒冈州立大学毕业证如何办理
一比一原版(osu毕业证书)美国俄勒冈州立大学毕业证如何办理一比一原版(osu毕业证书)美国俄勒冈州立大学毕业证如何办理
一比一原版(osu毕业证书)美国俄勒冈州立大学毕业证如何办理
upoux
 
Null Bangalore | Pentesters Approach to AWS IAM
Null Bangalore | Pentesters Approach to AWS IAMNull Bangalore | Pentesters Approach to AWS IAM
Null Bangalore | Pentesters Approach to AWS IAM
Divyanshu
 
TIME TABLE MANAGEMENT SYSTEM testing.pptx
TIME TABLE MANAGEMENT SYSTEM testing.pptxTIME TABLE MANAGEMENT SYSTEM testing.pptx
TIME TABLE MANAGEMENT SYSTEM testing.pptx
CVCSOfficial
 
VARIABLE FREQUENCY DRIVE. VFDs are widely used in industrial applications for...
VARIABLE FREQUENCY DRIVE. VFDs are widely used in industrial applications for...VARIABLE FREQUENCY DRIVE. VFDs are widely used in industrial applications for...
VARIABLE FREQUENCY DRIVE. VFDs are widely used in industrial applications for...
PIMR BHOPAL
 
Redefining brain tumor segmentation: a cutting-edge convolutional neural netw...
Redefining brain tumor segmentation: a cutting-edge convolutional neural netw...Redefining brain tumor segmentation: a cutting-edge convolutional neural netw...
Redefining brain tumor segmentation: a cutting-edge convolutional neural netw...
IJECEIAES
 
Advanced control scheme of doubly fed induction generator for wind turbine us...
Advanced control scheme of doubly fed induction generator for wind turbine us...Advanced control scheme of doubly fed induction generator for wind turbine us...
Advanced control scheme of doubly fed induction generator for wind turbine us...
IJECEIAES
 
Generative AI Use cases applications solutions and implementation.pdf
Generative AI Use cases applications solutions and implementation.pdfGenerative AI Use cases applications solutions and implementation.pdf
Generative AI Use cases applications solutions and implementation.pdf
mahaffeycheryld
 
Data Driven Maintenance | UReason Webinar
Data Driven Maintenance | UReason WebinarData Driven Maintenance | UReason Webinar
Data Driven Maintenance | UReason Webinar
UReason
 
CompEx~Manual~1210 (2).pdf COMPEX GAS AND VAPOURS
CompEx~Manual~1210 (2).pdf COMPEX GAS AND VAPOURSCompEx~Manual~1210 (2).pdf COMPEX GAS AND VAPOURS
CompEx~Manual~1210 (2).pdf COMPEX GAS AND VAPOURS
RamonNovais6
 
22CYT12-Unit-V-E Waste and its Management.ppt
22CYT12-Unit-V-E Waste and its Management.ppt22CYT12-Unit-V-E Waste and its Management.ppt
22CYT12-Unit-V-E Waste and its Management.ppt
KrishnaveniKrishnara1
 
Embedded machine learning-based road conditions and driving behavior monitoring
Embedded machine learning-based road conditions and driving behavior monitoringEmbedded machine learning-based road conditions and driving behavior monitoring
Embedded machine learning-based road conditions and driving behavior monitoring
IJECEIAES
 

Recently uploaded (20)

Software Engineering and Project Management - Software Testing + Agile Method...
Software Engineering and Project Management - Software Testing + Agile Method...Software Engineering and Project Management - Software Testing + Agile Method...
Software Engineering and Project Management - Software Testing + Agile Method...
 
Rainfall intensity duration frequency curve statistical analysis and modeling...
Rainfall intensity duration frequency curve statistical analysis and modeling...Rainfall intensity duration frequency curve statistical analysis and modeling...
Rainfall intensity duration frequency curve statistical analysis and modeling...
 
SCALING OF MOS CIRCUITS m .pptx
SCALING OF MOS CIRCUITS m                 .pptxSCALING OF MOS CIRCUITS m                 .pptx
SCALING OF MOS CIRCUITS m .pptx
 
Object Oriented Analysis and Design - OOAD
Object Oriented Analysis and Design - OOADObject Oriented Analysis and Design - OOAD
Object Oriented Analysis and Design - OOAD
 
Design and optimization of ion propulsion drone
Design and optimization of ion propulsion droneDesign and optimization of ion propulsion drone
Design and optimization of ion propulsion drone
 
Electric vehicle and photovoltaic advanced roles in enhancing the financial p...
Electric vehicle and photovoltaic advanced roles in enhancing the financial p...Electric vehicle and photovoltaic advanced roles in enhancing the financial p...
Electric vehicle and photovoltaic advanced roles in enhancing the financial p...
 
Mechanical Engineering on AAI Summer Training Report-003.pdf
Mechanical Engineering on AAI Summer Training Report-003.pdfMechanical Engineering on AAI Summer Training Report-003.pdf
Mechanical Engineering on AAI Summer Training Report-003.pdf
 
Welding Metallurgy Ferrous Materials.pdf
Welding Metallurgy Ferrous Materials.pdfWelding Metallurgy Ferrous Materials.pdf
Welding Metallurgy Ferrous Materials.pdf
 
Properties Railway Sleepers and Test.pptx
Properties Railway Sleepers and Test.pptxProperties Railway Sleepers and Test.pptx
Properties Railway Sleepers and Test.pptx
 
一比一原版(osu毕业证书)美国俄勒冈州立大学毕业证如何办理
一比一原版(osu毕业证书)美国俄勒冈州立大学毕业证如何办理一比一原版(osu毕业证书)美国俄勒冈州立大学毕业证如何办理
一比一原版(osu毕业证书)美国俄勒冈州立大学毕业证如何办理
 
Null Bangalore | Pentesters Approach to AWS IAM
Null Bangalore | Pentesters Approach to AWS IAMNull Bangalore | Pentesters Approach to AWS IAM
Null Bangalore | Pentesters Approach to AWS IAM
 
TIME TABLE MANAGEMENT SYSTEM testing.pptx
TIME TABLE MANAGEMENT SYSTEM testing.pptxTIME TABLE MANAGEMENT SYSTEM testing.pptx
TIME TABLE MANAGEMENT SYSTEM testing.pptx
 
VARIABLE FREQUENCY DRIVE. VFDs are widely used in industrial applications for...
VARIABLE FREQUENCY DRIVE. VFDs are widely used in industrial applications for...VARIABLE FREQUENCY DRIVE. VFDs are widely used in industrial applications for...
VARIABLE FREQUENCY DRIVE. VFDs are widely used in industrial applications for...
 
Redefining brain tumor segmentation: a cutting-edge convolutional neural netw...
Redefining brain tumor segmentation: a cutting-edge convolutional neural netw...Redefining brain tumor segmentation: a cutting-edge convolutional neural netw...
Redefining brain tumor segmentation: a cutting-edge convolutional neural netw...
 
Advanced control scheme of doubly fed induction generator for wind turbine us...
Advanced control scheme of doubly fed induction generator for wind turbine us...Advanced control scheme of doubly fed induction generator for wind turbine us...
Advanced control scheme of doubly fed induction generator for wind turbine us...
 
Generative AI Use cases applications solutions and implementation.pdf
Generative AI Use cases applications solutions and implementation.pdfGenerative AI Use cases applications solutions and implementation.pdf
Generative AI Use cases applications solutions and implementation.pdf
 
Data Driven Maintenance | UReason Webinar
Data Driven Maintenance | UReason WebinarData Driven Maintenance | UReason Webinar
Data Driven Maintenance | UReason Webinar
 
CompEx~Manual~1210 (2).pdf COMPEX GAS AND VAPOURS
CompEx~Manual~1210 (2).pdf COMPEX GAS AND VAPOURSCompEx~Manual~1210 (2).pdf COMPEX GAS AND VAPOURS
CompEx~Manual~1210 (2).pdf COMPEX GAS AND VAPOURS
 
22CYT12-Unit-V-E Waste and its Management.ppt
22CYT12-Unit-V-E Waste and its Management.ppt22CYT12-Unit-V-E Waste and its Management.ppt
22CYT12-Unit-V-E Waste and its Management.ppt
 
Embedded machine learning-based road conditions and driving behavior monitoring
Embedded machine learning-based road conditions and driving behavior monitoringEmbedded machine learning-based road conditions and driving behavior monitoring
Embedded machine learning-based road conditions and driving behavior monitoring
 

LESSON 4_UNGROUPED.pptx.pdf

  • 1. • If you don’t drive your business, you will be driven out of the business. • (B. C. Forbes) Preparedby:WAN NURULHUDA FACULTY OF BUSINESS, FINANCE & IT & SCHOOL OF HOSPITALITY MANAGEMENT MAHSAUniversity @2020 LESSON 4: DESCRIPTIVE STATISTICS: UNGROUPED DATA
  • 2. LEARNING OBJECTIVES The study of this chapter should enable you to: • Organize raw data into a frequency distribution • Present a frequency distribution into graphic forms • Describe and calculate different measures of central tendency • Define and calculate different measures of dispersion and skewness
  • 3. • Descriptive statistics aims to summarize quantitative data without using the probabilistic formulation and not to draw conclusions about the population as in inferential statistics. • Although a data analysis uses inferential statistics to deduce the main conclusions, the features of descriptive statistics are usually highlighted at the same time. • The computer has become an important tool in the presentation and analysis of data. Among the most popular and widely used statistical packages are SAS, SPSS, Stat graphics and Minitab. • The collected sample are referred to as raw data. This chapter discusses to how to organize such raw data into a frequency distribution and then present it using graphic forms. INTRODUCTION
  • 4. • A frequency distribution is a tabulation of values that contains one or more variables in a sample. It summarizes the distribution of values in the sample where each entry represents the frequency or count of the occurrences of values within a particular interval. • It is much simpler to manage and operate the frequency tabulated data than the raw data. With frequency tables, there are simple formulas to calculate the important statistics. • A frequency distribution for qualitative data lists all categories and the number of elements that belong to each of the categories. FREQUENCY DISTRIBUTION
  • 5. • Ungrouped data which is also known as raw data is data that has not been placed in any group or category after collection. • Data is categorized in numbers or characteristics therefore, the data which has not been put in any of the categories is ungrouped. • For example, when conducting census and you want to analyze how many women above the age of 45 are in a particular area, you first need to know how many people reside in that area. Some of the advantages of ungrouped data are as follows; •Most people can easily interpret it. •When the sample size is small, it is easy to calculate the mean, mode and median. •It does not require technical expertise to analyze it. WHAT IS UNGROUPED DATA?
  • 6. Differences between Grouped Data and Ungrouped Data •Classification of Grouped Data vs. Ungrouped Data Grouped data is data that has been organized in classes after its analysis. Examples include how many bags of maize collected during the rainy season were bad. On the other hand, ungrouped data is data which does not fall in any group. It is still raw data. •Preference of Grouped Data vs. Ungrouped Data When collecting data, ungrouped data is preferred because the information is still in its original form. It has not been tampered with by classification or subdivision. However, when analyzing it and drawing graphs, grouped data is preferred because it is simple to interpret. •Accuracy of Grouped Data vs. Ungrouped Data When calculating the means of grouped and ungrouped data, there will be a variation. The mean of grouped data is preferred because it is more accurate as compared to the mean of ungrouped data. The mean of ungrouped data may lead to wrong manipulation of the median therefore it is considered inefficient in most cases. •Representation of Grouped Data vs. Ungrouped Data Frequency tables are used to show the information of grouped data whereas in the case of ungrouped data, the information appears like a big list of of numbers. This is due to the fact that the information is still raw.
  • 7.
  • 8. UNGROUPED DATA • MEAN: ➢A set of data has only one mean (unique). ➢ The mean is a useful measure for comparing two or more populations. • MEDIAN: ➢The median for ungrouped data is the midpoint of values after they have been arranged from the ➢smallest to the largest, or the largest to the smallest Median : * Middle value, if n is odd; * Mean of the two middle values, if n is even. MODE: ➢The mode of a set of measurements is the value that occurs most frequently.
  • 9. Mean  x = sum of all observation n = total number •Mean is the sum of all data divided by the total number. •Formula, 9 ҧ 𝑥= σ 𝑥 𝑛
  • 10. 1) Find the mean of the following data, 1, 4, 8, 15, 14, 20, 23. 2) Find the mean of the following data 122 145 136 122 111 187 118 136 121 110 154 125 166 126 EXERCISE
  • 11. MEDIAN •Median is the middle value of a set of data. •But, when data are arranged in order. •When there is an extreme value in the data, the median is more suitable to be used for representing the data. 1
  • 12. EXAMPLE •Find the median of the following sets of data, 3, 4, 7, 3, 10, 12, 5 rearrange : 3, 3, 4, 5, 7, 10, 12 = 3, 3, 4, 5, 7, 10, 12 = 5
  • 13. Exercise 3) Find the median of the following sets of data, 9, 7, 2, 4, 15, 10, 8 4) Find the median of the following sets of data, 91, 70, 2, 40, 15, 100, 8, 130 1 3
  • 14. MODE •Mode is the data value that occurs with the highest frequency in a set of data. •The mode is an important representation for categorical data. •Example: 1 4
  • 15. 1 5 • Find the mode in the following data, 2, 7, 2, 4, 15, 4, 4, 13 • Find the mode in the following data, 12, 7, 32, 14, 15, 44, 14, 113, 2 • Find the mode in the following data, 2, 7, 2, 4, 15, 4, 4, 13, 2 EXAMPLE
  • 16. EXERCISE (CONT.) 5) Find the mode in the following data, 112, 37, 32, 14, 15, 44, 4, 113 6) Find the mode in the following data, 22, 77, 15, 22, 44, 15, 44, 77 16
  • 17. • QUARTILE: ➢Descriptive measures that split the ordered data into four quarters. ➢INTERQUARTILE: ➢QUARTILE DEVIATION: • RANGE: ➢Largest value- smallest value 4 1 1 + = n Q ( ) 4 1 3 3 + = n Q 𝑄3 − 𝑄1 𝑄3 − 𝑄1 2
  • 18. EXERCISE a) Find the quartile, interquartile and quartile deviation in the following data, 112, 37, 32, 14, 15, 44, 4, 113 b) Find the quartile, interquartile and quartile deviation in the following data, 22, 77, 15, 22, 44, 15, 44, 77 16
  • 19. • VARIANCE: • STANDARD DEVIATION: 𝑠2 = 1 𝑛 − 1 ෍ 𝑥2 − σ 𝑥 𝑛 2 𝑠 = 𝑣𝑎𝑟
  • 20. 151 120 122 112 100 105 • During a 6 days period, Saiful’s daily incomes were as follows i. 1st and 3rd quartile ii. interquartile range iii. Quartile deviation iv. Range v. Variance vi. Standard deviation
  • 21. EXERCISE 1: • A company has six persons for Family day. The number of player in six persons are : 10, 12, 15, 12 , and 13 respectively. Calculate: i. Mean ii. Median iii. Mode iv. 1st and 3rd quartile v. interquartile range vi. Quartile deviation vii.Range viii.Variance ix. Standard deviation
  • 22. EXERCISE 2: • Ms Rachel collects the data on the ages of mathematics teacher in Monte Carlo School, and her study yields the following data: 38 35 28 36 35 33 40 Calculate: i. Mean ii. Median iii. Mode iv. Variance v. Standard deviation
  • 23. EXERCISE 3: • For the sample below: Calculate: i. Range ii. Interquartile iii. Quartile deviation 15 26 38 72 66 91 87 93 100 52 44 38
  • 24. Preparedby:WAN NURULHUDA FACULTY OF BUSINESS, FINANCE & IT & SCHOOL OF HOSPITALITY MANAGEMENT MAHSAUniversity @2020