Download to read offline


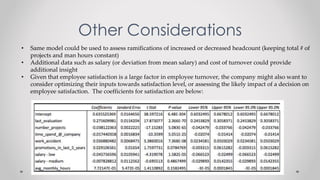

This document summarizes a presentation made to 4.0 Partners about analyzing employee data and turnover. It includes information on the company history and employee satisfaction levels. Logistic regression analysis found that employee satisfaction and salary were the main factors affecting turnover likelihood. The presentation recommends redistributing salaries across employees to reduce expected turnover from 23.77% to 10% by raising 1907 employees to a medium salary and 1125 to a high salary.


