Downloaded 51 times


![MARKOV ANALYSIS – 2
(Captures effects of internal transfers)
(Start = 3500) A TRANSITION MATRIX
FROM/ TO: TOP MID LOW SKILLED ASSY EXIT
TOP 100 .80 .02 .18
MID 200 .10 .76 .04 .10
LOW 600 .06 .78 .01 .15
SKILL 600 .01 .84 .15
ASSY 2000 .05 .88 .07
- - - - - - - - - - - - - - - - - - - - - - - - - - - - - - - - - - - - - - - - - - - - - - - - - - - - - - - - -
END YR WITH: 100 190 482 610 1760 [358 left]
NEED RECRUITS ? 0 10 118 240* 368 tot
NEED LAYOFFS ? (10)* (10) tot
KEEP STABLE 100 200 600 600 2000 = 3500 Tot](https://image.slidesharecdn.com/3manpowerplanningprocess-130515013217-phpapp01/85/Manpower-planning-process-15-320.jpg)
![MARKOV ANALYSIS – 3
(Anticipates Changes in Employment Levels)
Employment needs are changing. We need a 10% increase in skilled workers
(660), and a 15% decrease in assembly workers (1700) by year’s end.
- - - - - - - - - - - - - - - - - - - - - - - - - - - - - - - - - - - - - - - - - - - - - - - - - - - - - - -
(Start = 3500) A TRANSITION MATRIX
FROM/ TO: TOP MID LOW SKILLED ASSY EXIT
TOP 100 .80 .02 .18
MID 200 .10 .76 .04 .10
LOW 600 .06 .78 .01 .15
SKILL 600 .01 .84 .15
ASSY 2000 .05 .88 .07
- - - - - - - - - - - - - - - - - - - - - - - - - - - - - - - - - - - - - - - - - - - - - - - - - - - - - - - - -
END YR WITH: 100 190 482 610 1760 [358 left]
NEED RECRUITS ? 0 10 118 50*
NEED LAYOFFS ? (60)*
NEW LEVELS 100 200 600 600 1700 = 3260 tot](https://image.slidesharecdn.com/3manpowerplanningprocess-130515013217-phpapp01/85/Manpower-planning-process-16-320.jpg)


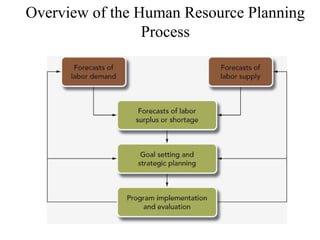
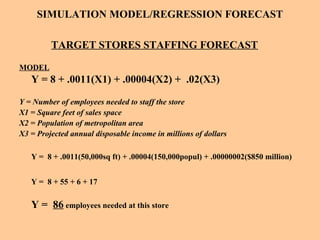
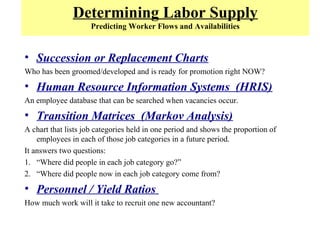
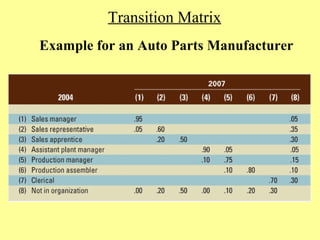
Human resource planning involves forecasting future labor demand and supply to determine if surpluses or shortages will exist. The process includes: - Forecasting demand using methods like trend analysis, indicators, and simulations - Forecasting supply by assessing succession plans, skills inventories, market analyses, and personnel ratios - Creating transition matrices to analyze employee movement between roles over time - Comparing forecasts to determine if recruitment or layoffs are needed to achieve organizational goals


