Download to read offline

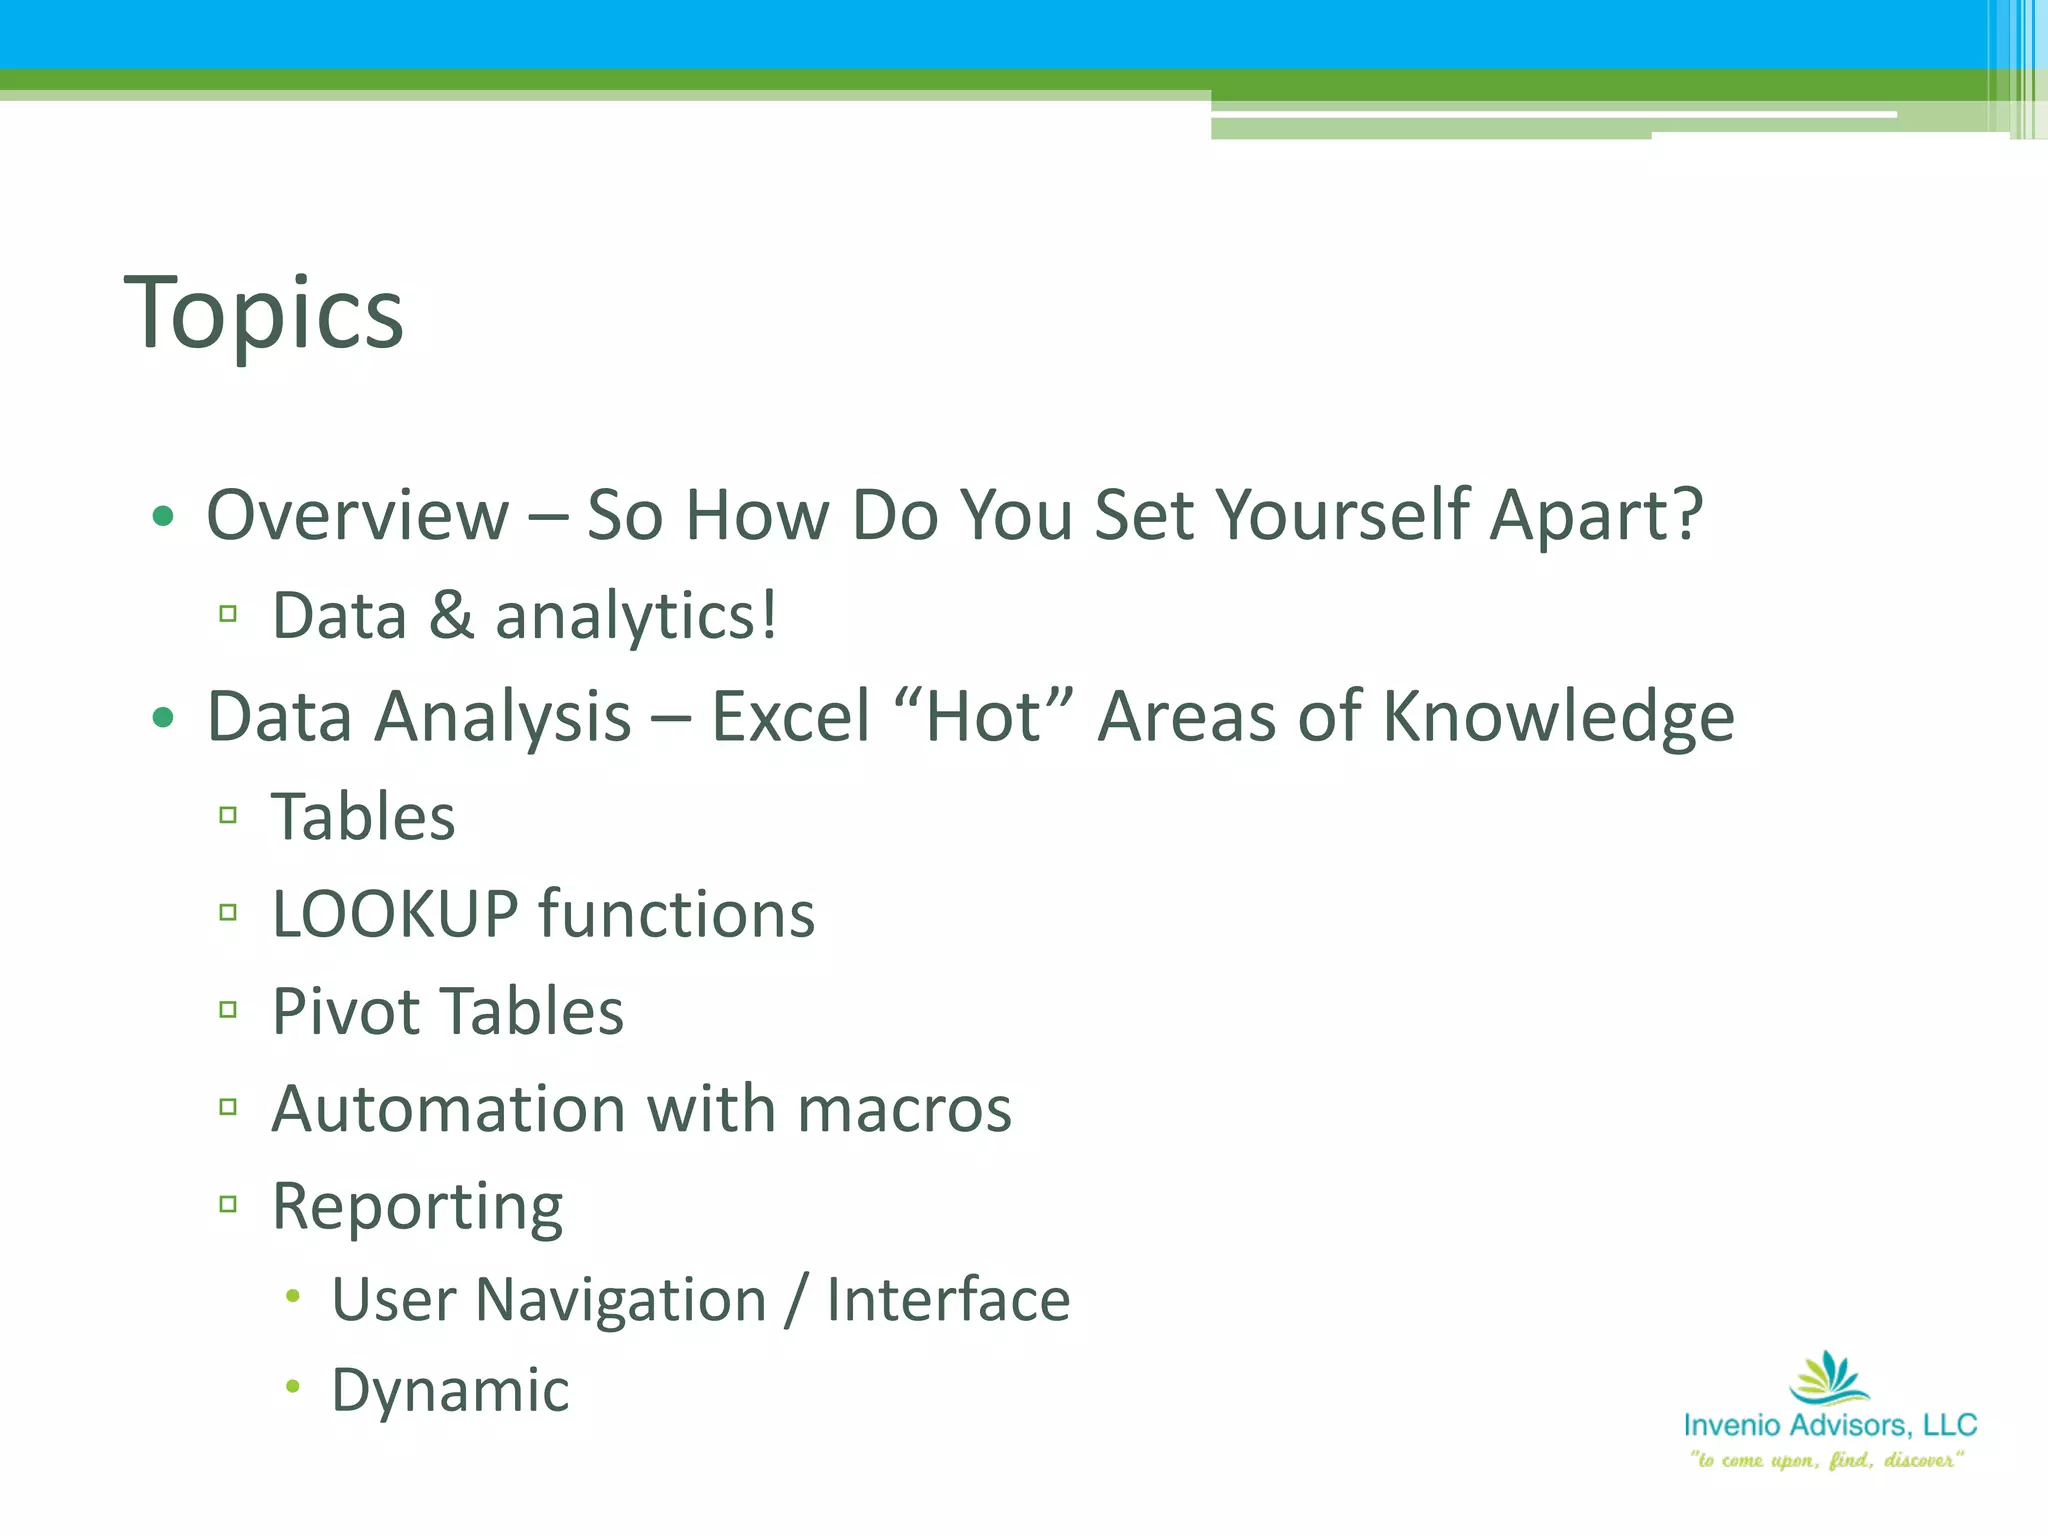
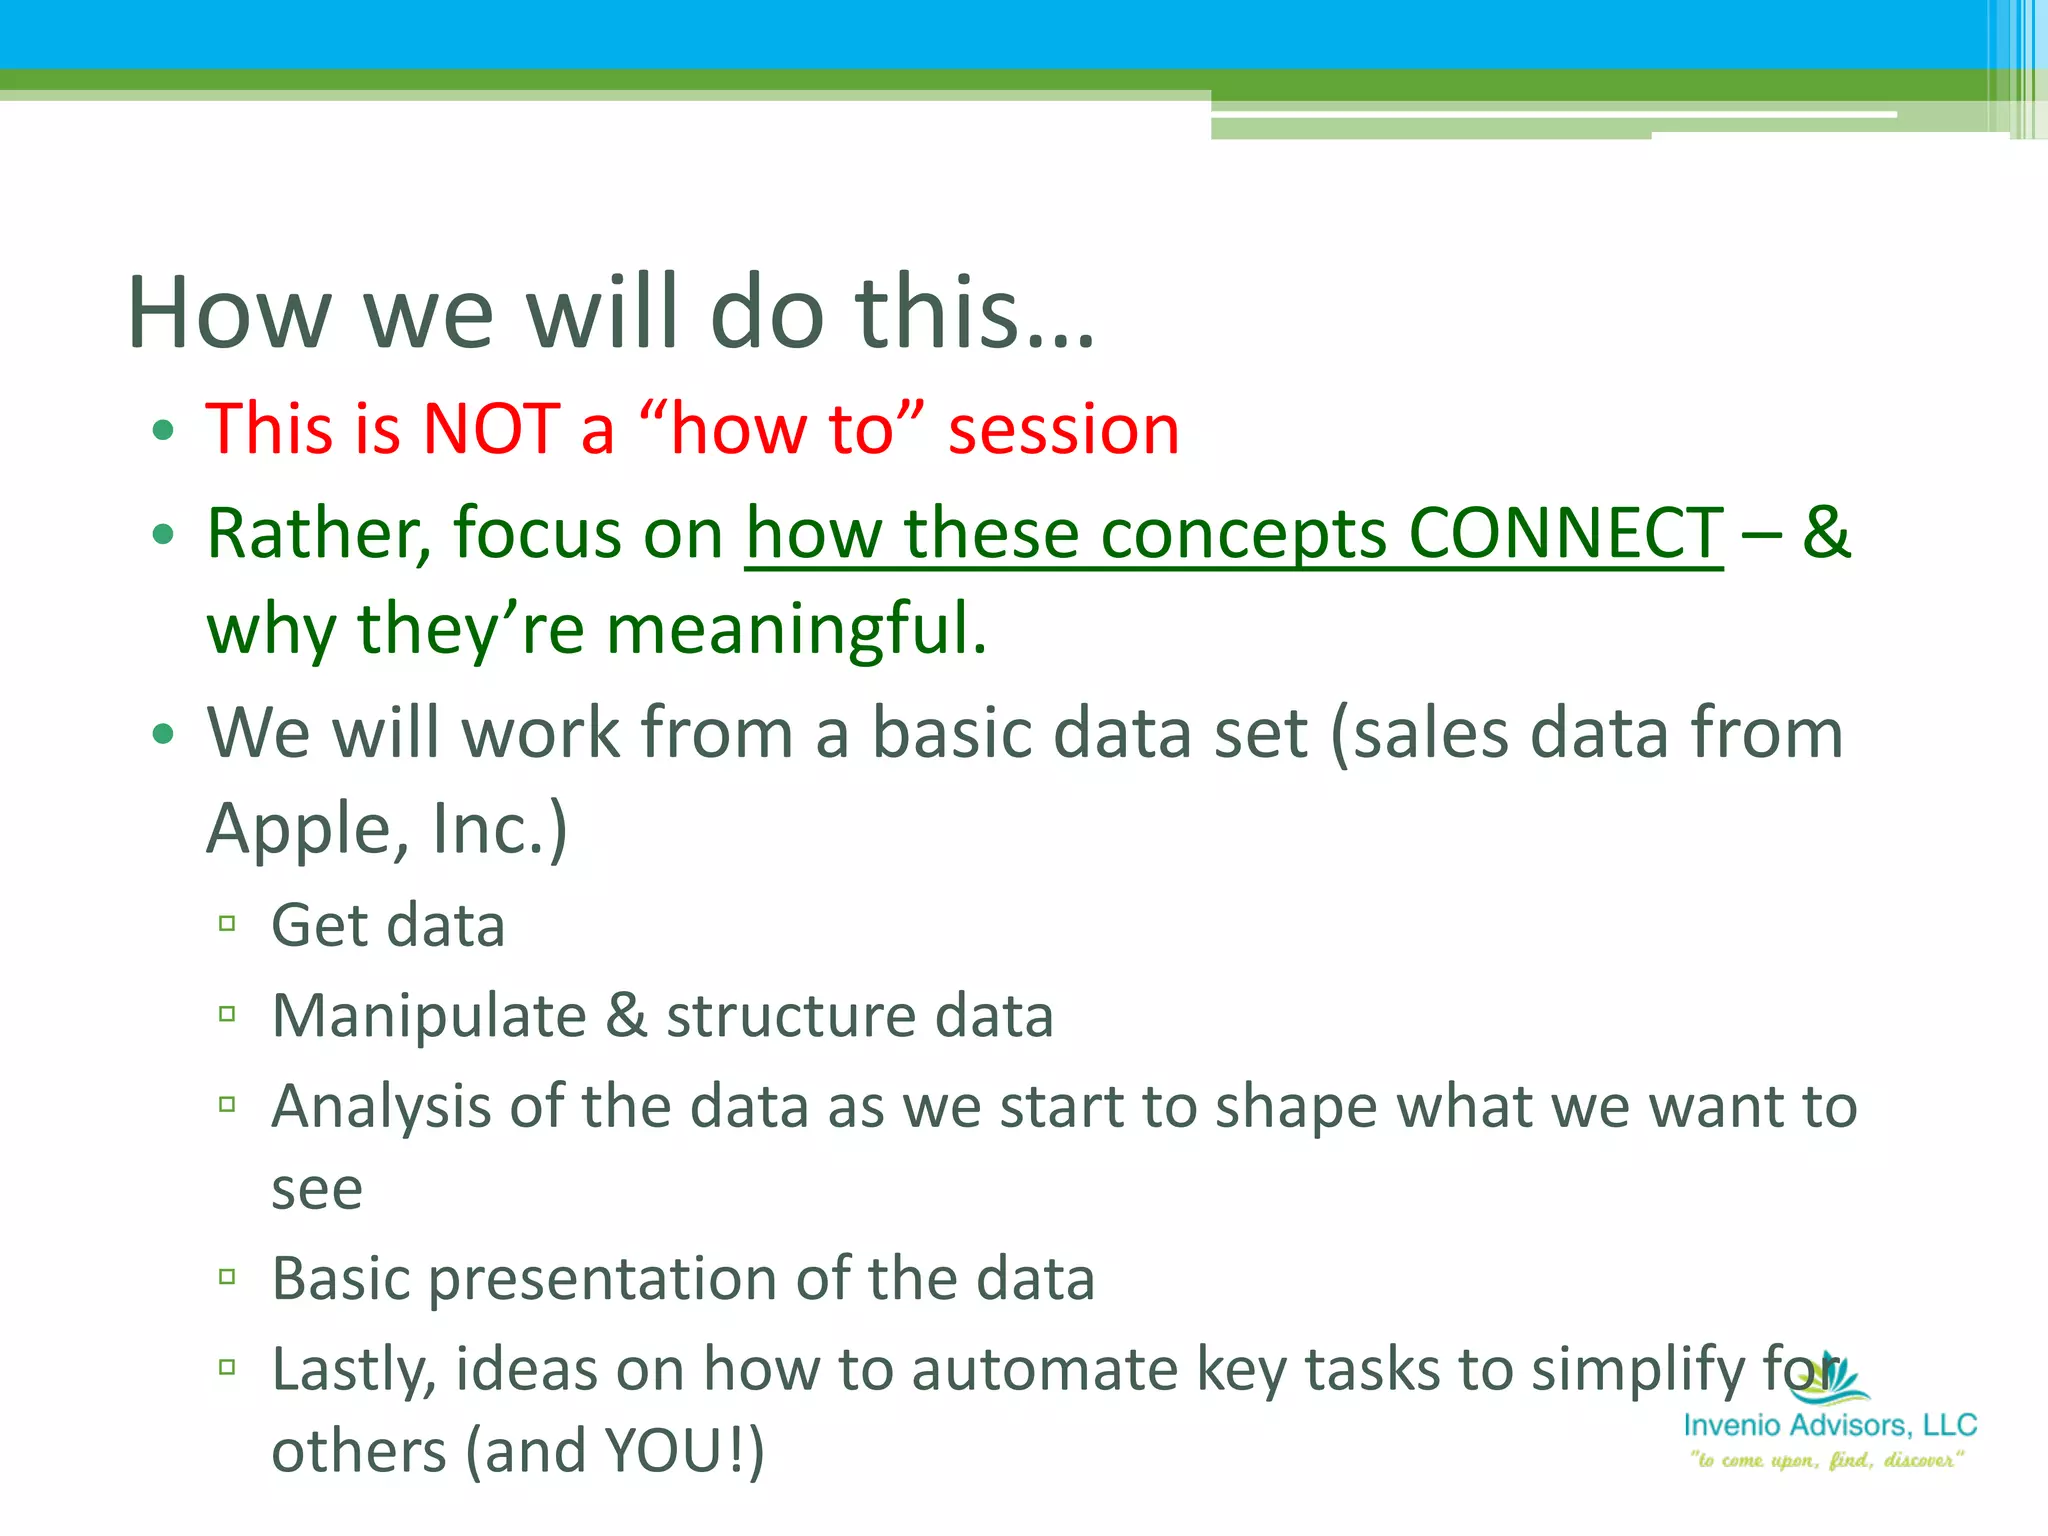
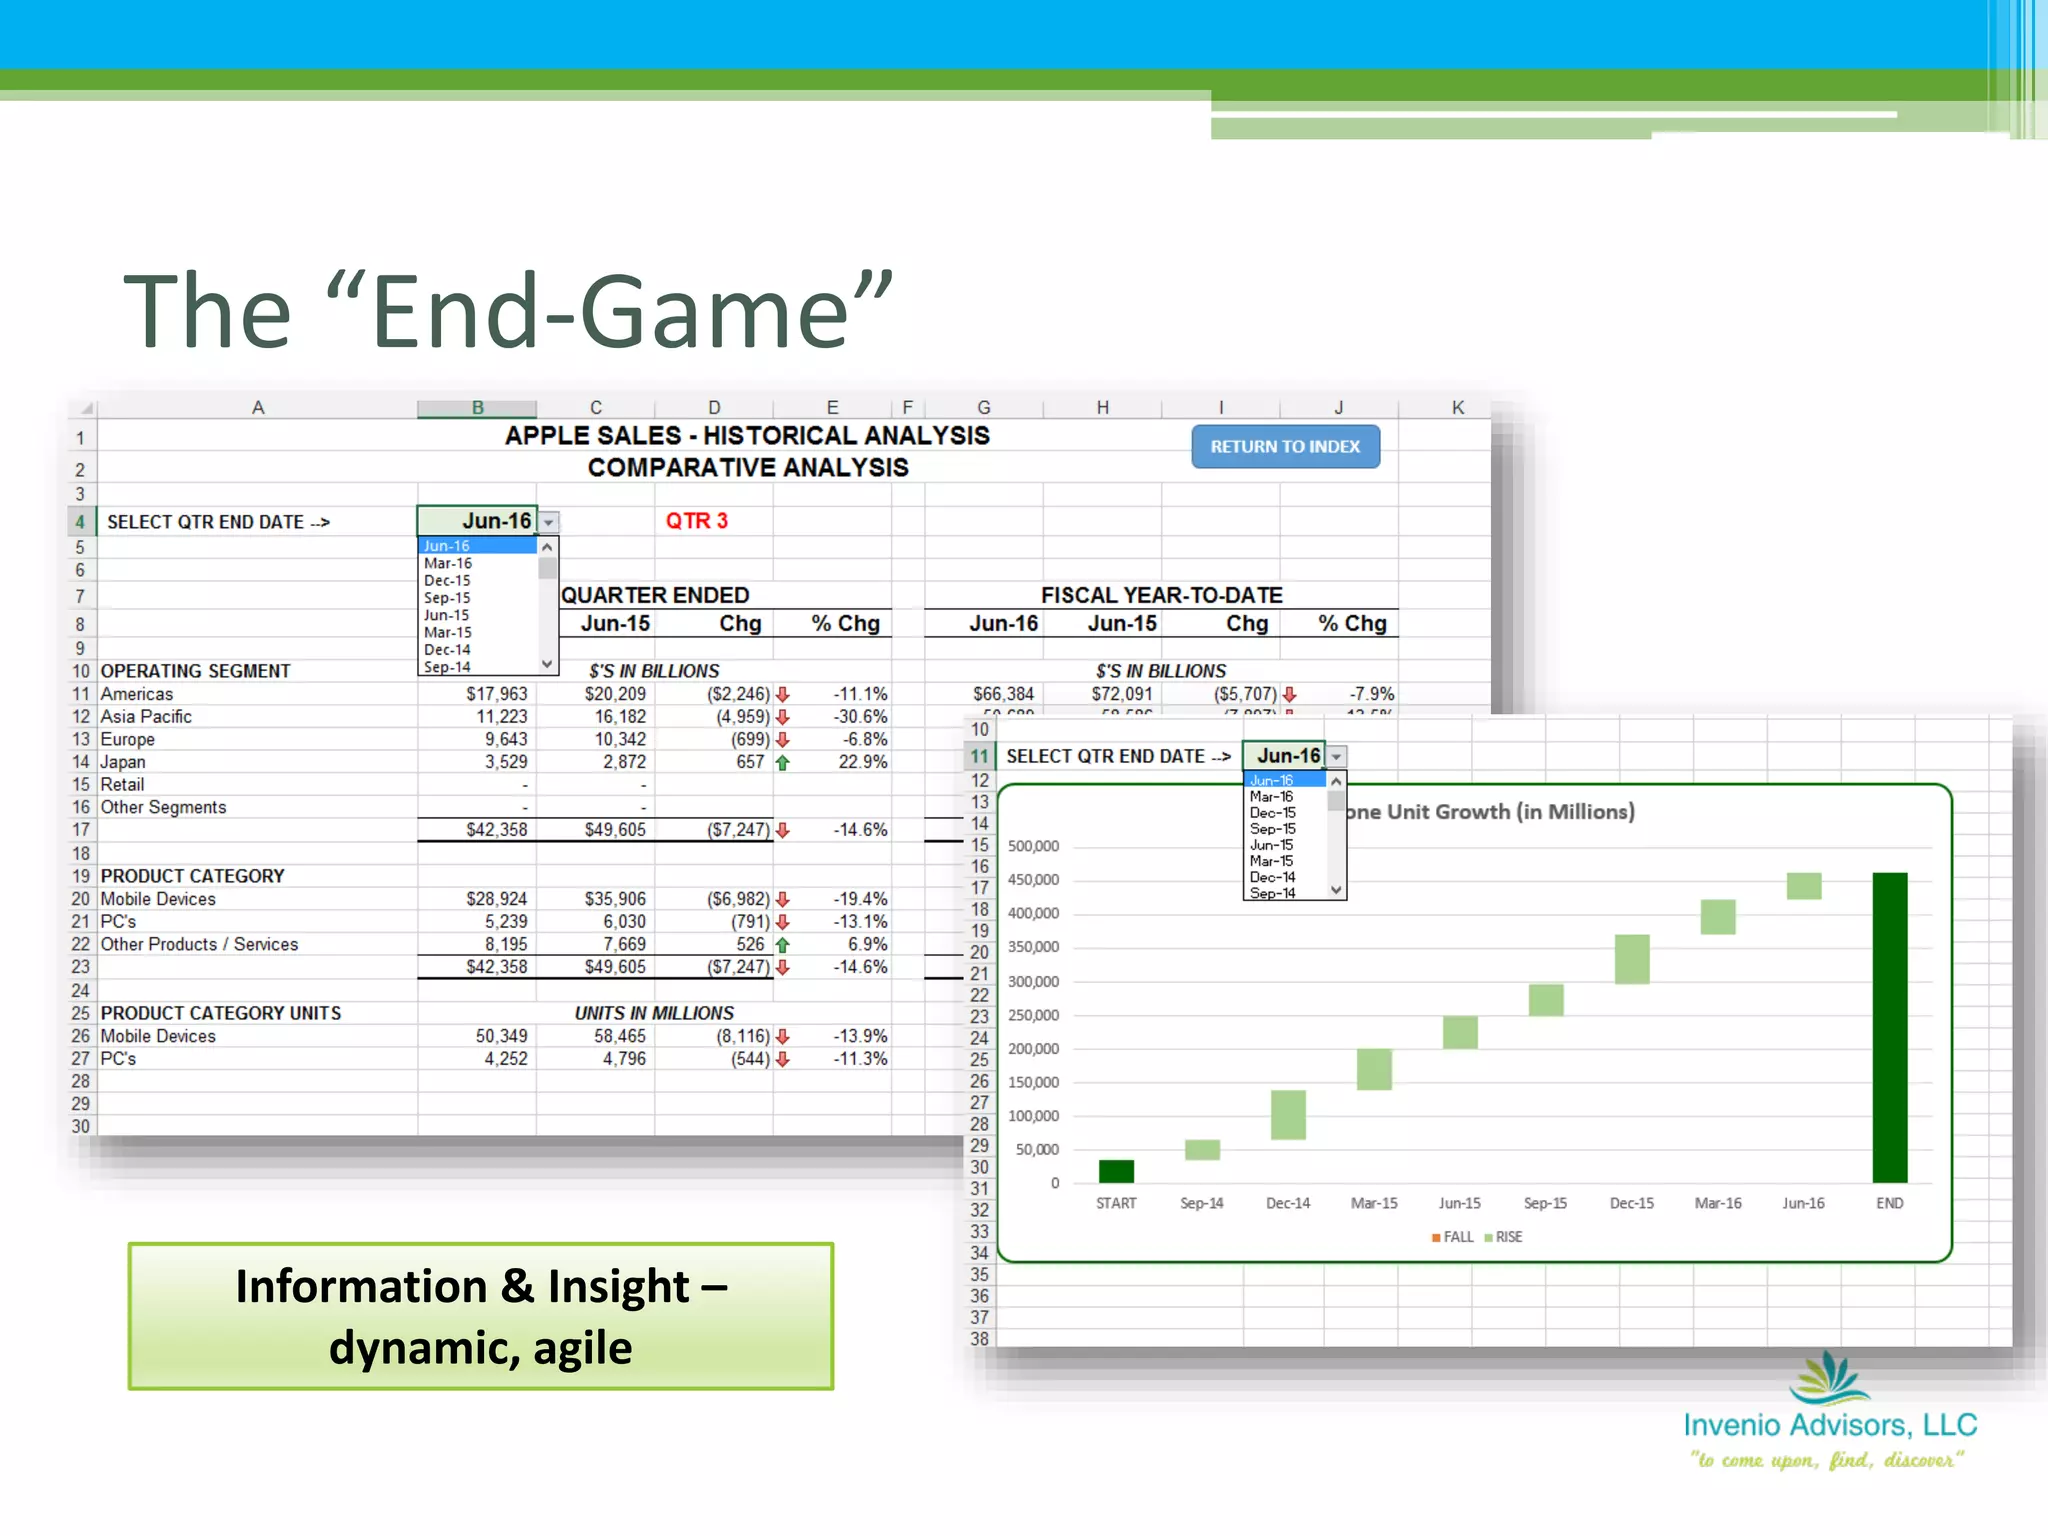


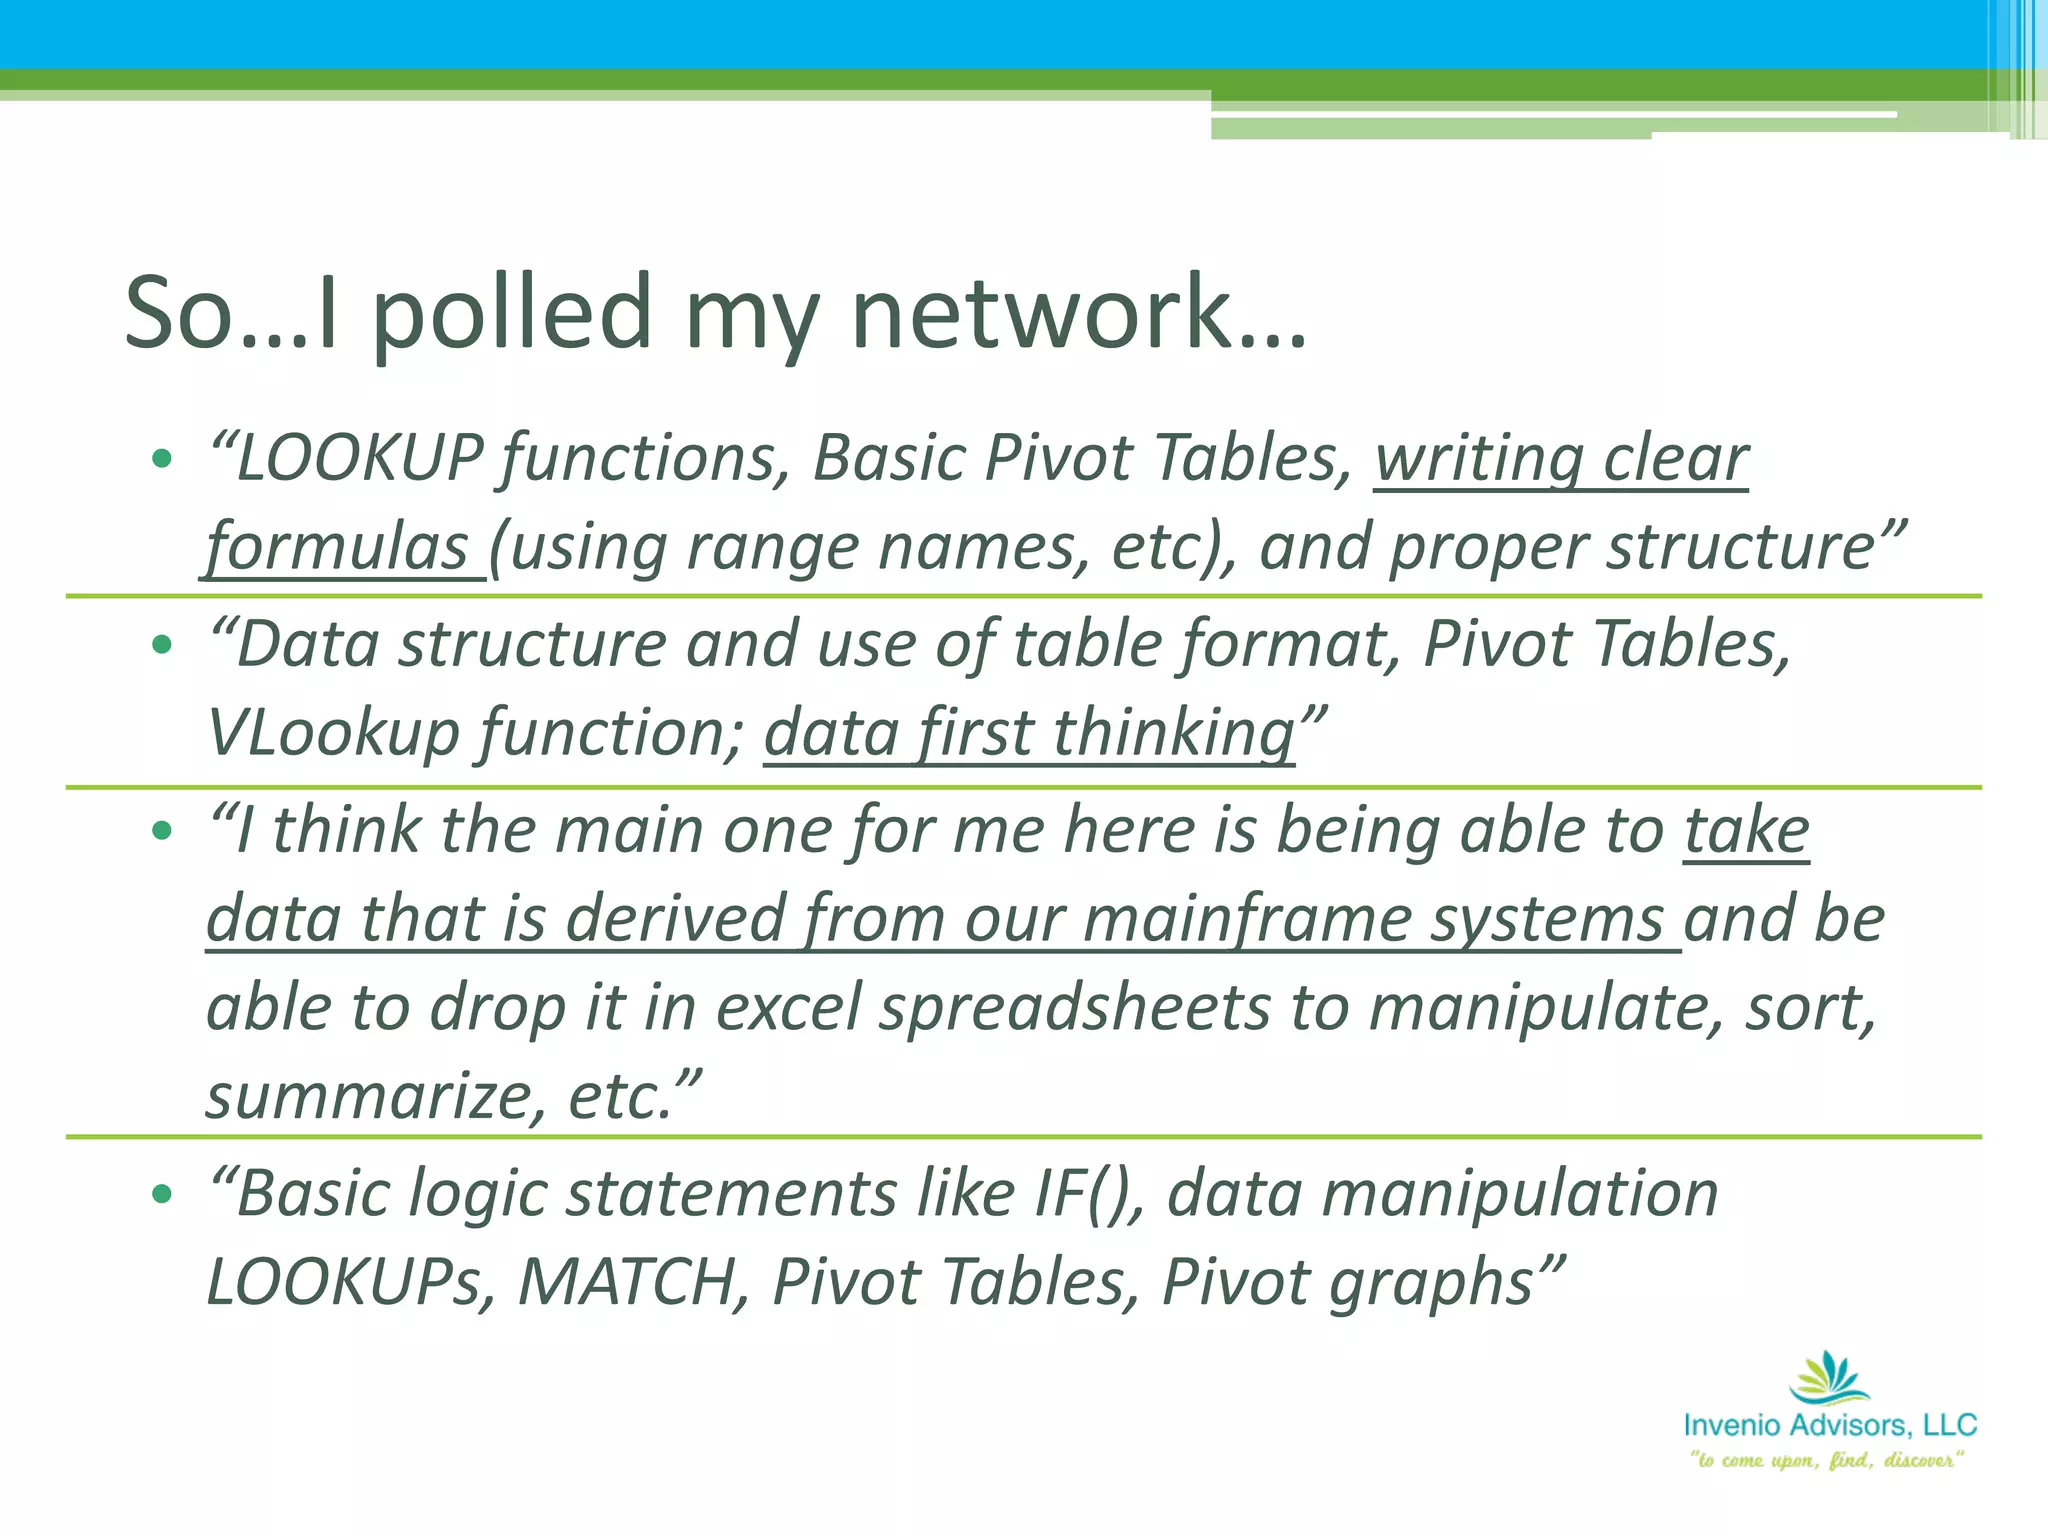


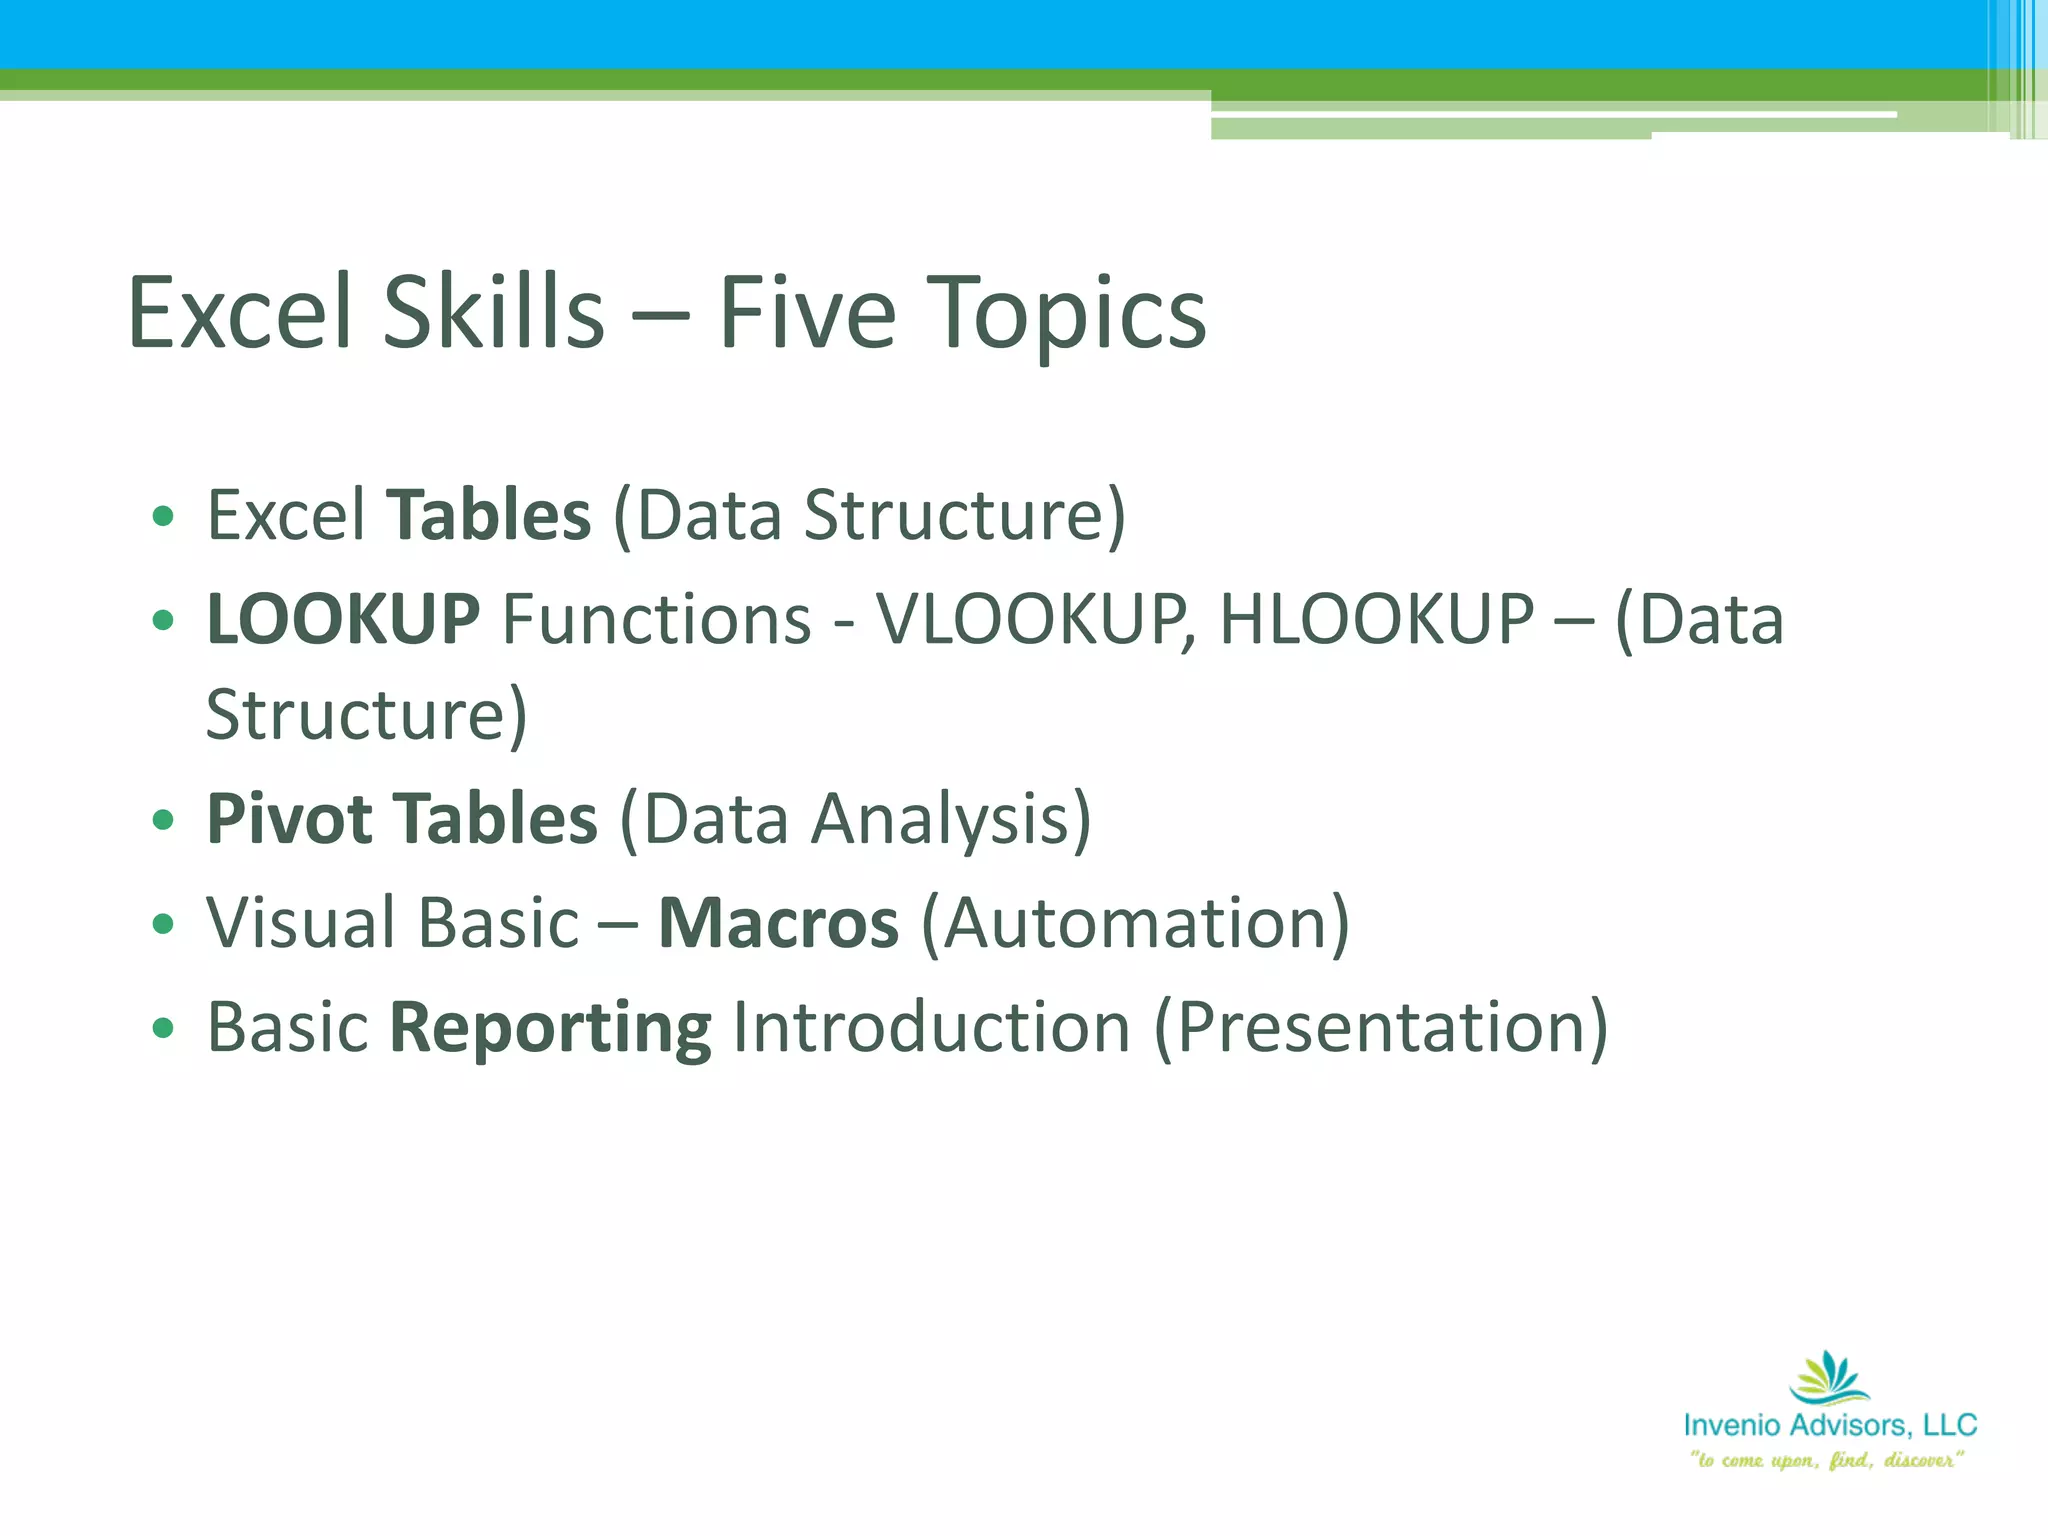


The document summarizes a presentation from the 16th annual Heartland Regional Council of the IMA educational conference, focusing on how accounting professionals can differentiate themselves through data analytics and Excel skills. Key topics include the importance of mastering Excel features such as pivot tables, lookup functions, and automation, as well as the evolving demand for data analytics skills in the accounting field. The presentation emphasizes the significance of these skills for effective data management and reporting to support business decision-making.


![[Tech talk] “The Future of Product Development” by Jean-Michel Lemieux, Vice ...](https://cdn.slidesharecdn.com/ss_thumbnails/vietnamaugust-futureofproductengineering-140814215142-phpapp01-thumbnail.jpg?width=640&height=640&fit=bounds)


