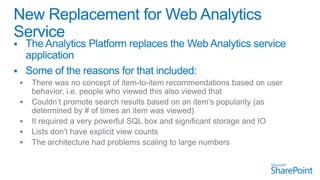
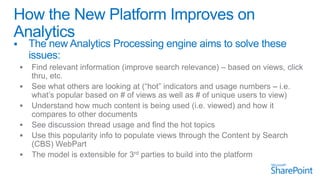
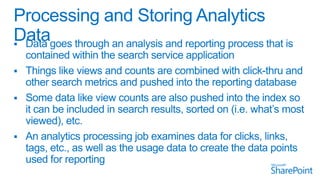
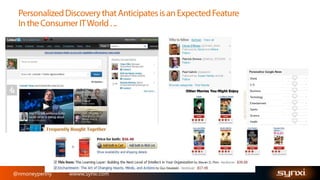
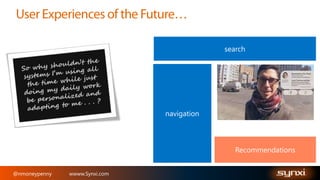
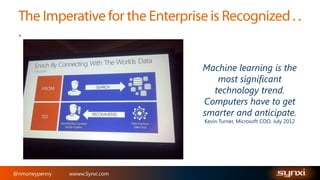
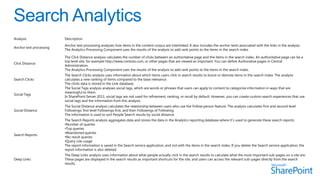
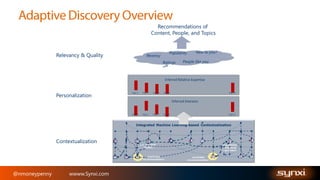
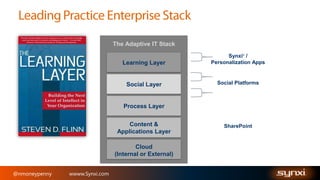
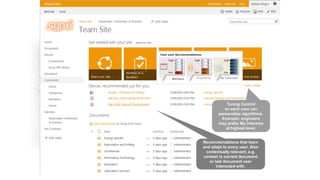
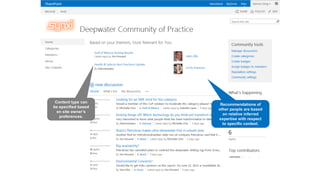
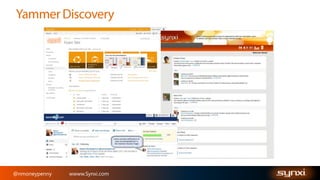
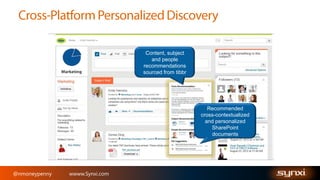
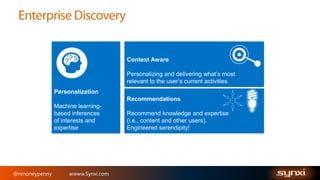
#SPSKC

©2012 Microsoft Corporation. All rights reserved.
​

​

​

​

​

​

​

​

​

​

​

​

​

​

​
Naomi Moneypenny
n.moneypenny@manyworlds.com

Technology forecasting and strategy manager at Shell, consulted at
many Fortune 100 companies since
3000+ followers on
Twitter
3+3 dogs

20+ patents in
adaptive systems
Astrophysicist

Passionate about user adoption and
enterprise collaboration & innovation

@nmoneypenny

wwww.Synxi.com

geek
@nmoneypenny

wwww.Synxi.com
@nmoneypenny

wwww.Synxi.com
Machine learning is the
most significant
technology trend.
Computers have to get
smarter and anticipate.
Kevin Turner, Microsoft COO, July 2012

@nmoneypenny

wwww.Synxi.com
@nmoneypenny

wwww.Synxi.com
©2012 Microsoft Corporation. All rights reserved.
Analysis

Description

Anchor text processing

Anchor text processing analyzes how items in the content corpus are interlinked. It also includes the anchor texts associated with the links in the analysis.
The Analytics Processing Component uses the results of the analysis to add rank points to the items in the search index.

Click Distance

The Click Distance analysis calculates the number of clicks between an authoritative page and the items in the search index. An authoritative page can be a
top level site, for example http://www.contoso.com, or other pages that are viewed as important. You can define Authorative pages in Central
Administration.
The Analytics Processing Component uses the results of the analysis to add rank points to the items in the search index.

Search Clicks

Social Tags

The Search Clicks analysis uses information about which items users click in search results to boost or demote items in the search index. The analysis
calculates a new ranking of items compared to the base relevance.
The clicks data is stored in the Link database.
The Social Tags analysis analyses social tags, which are words or phrases that users can apply to content to categorize information in ways that are
meaningful to them.
In SharePoint Server 2013, social tags are not used for refinement, ranking, or recall by default. However, you can create custom search experiences that use
social tags and the information from this analysis.

Social Distance

The Social Distance analysis calculates the relationship between users who use the Follow person feature. The analysis calculates first and second level
Followings: first level Followings first, and then Followings of Following.
The information is used to sort People Search results by social distance.

Search Reports

The Search Reports analysis aggregates data and stores the data in the Analytics reporting database where it's used to generate these search reports:
•Number of queries
•Top queries
•Abandoned queries
•No result queries
•Query rule usage
The report information is saved in the Search service application, and not with the items in the search index. If you delete the Search service application, the
report information is also deleted.

Deep Links

The Deep Links analysis uses information about what people actually click in the search results to calculate what the most important sub-pages on a site are.
These pages are displayed in the search results as important shortcuts for the site, and users can access the relevant sub-pages directly from the search
results.
@nmoneypenny

wwww.Synxi.com
@nmoneypenny

wwww.Synxi.com
+

Follow

when you
know sources
of information
that are
generally
relevant

@nmoneypenny

wwww.Synxi.com

?

Search

Discovery

when you
know what
information
you need now
but don’t know
where it is

when you
don’t know
what you
need now
or even know
that it exists
@nmoneypenny

wwww.Synxi.com
Class 2

Class 1

@nmoneypenny

wwww.Synxi.com
Class 2

Class 1

@nmoneypenny

wwww.Synxi.com

Class 2

Class 1
Class 2

Class 1

@nmoneypenny

wwww.Synxi.com

m
@nmoneypenny

wwww.Synxi.com
@nmoneypenny

wwww.Synxi.com
( )

( )
( ) ( ) ( )
( )
( )
( )
( ) ( )
( )
( )
( )
( )
( )
( )
( )
( )

(.)

Input space

Feature space
Note: feature space is of higher
dimension than the input space in
practice

@nmoneypenny

wwww.Synxi.com
@nmoneypenny

wwww.Synxi.com
Recommendations of
Content, People, and Topics

Relevancy & Quality

Recency

New to you?

Popularity

People like you

Ratings

Inferred Relative Expertise

Personalization

Topic 1

Topic 2

Topic 3

Topic 4

.

.

.

.

.

.

.

.

.

.

.

.

.

Topic N

.

.

.

.

.

.

.

Topic N

Inferred Interests

Topic 1

Contextualization

@nmoneypenny

wwww.Synxi.com

Topic 2

Topic 3

Topic 4

.

.

.

.

.

.
The Adaptive IT Stack
®

Learning Layer

Synxi /
Personalization Apps

Social Layer

Social Platforms

Process Layer
Content &
Applications Layer
Cloud
(Internal or External)
@nmoneypenny

wwww.Synxi.com

SharePoint
@nmoneypenny

wwww.Synxi.com
Content, subject
and people
recommendations
sourced from tibbr

Recommended
cross-contextualized
and personalized
SharePoint
documents

@nmoneypenny

wwww.Synxi.com
Context Aware
Personalizing and delivering what’s most
relevant to the user’s current activities
Personalization
Recommendations
Machine learningbased inferences
of interests and
expertise

@nmoneypenny

wwww.Synxi.com

Recommend knowledge and expertise
(i.e., content and other users).
Engineered serendipity!
@nmoneypenny

wwww.Synxi.com
@nmoneypenny

wwww.Synxi.com
n.moneypenny@manyworlds.com
www.Synxi.com
@nmoneypenny

wwww.Synxi.com

SPSKC Machine Learning in SharePoint

  • 1.
  • 2.
  • 3.
    Naomi Moneypenny n.moneypenny@manyworlds.com Technology forecastingand strategy manager at Shell, consulted at many Fortune 100 companies since 3000+ followers on Twitter 3+3 dogs 20+ patents in adaptive systems Astrophysicist Passionate about user adoption and enterprise collaboration & innovation @nmoneypenny wwww.Synxi.com geek
  • 4.
  • 5.
  • 6.
    Machine learning isthe most significant technology trend. Computers have to get smarter and anticipate. Kevin Turner, Microsoft COO, July 2012 @nmoneypenny wwww.Synxi.com
  • 7.
  • 8.
    ©2012 Microsoft Corporation.All rights reserved.
  • 12.
    Analysis Description Anchor text processing Anchortext processing analyzes how items in the content corpus are interlinked. It also includes the anchor texts associated with the links in the analysis. The Analytics Processing Component uses the results of the analysis to add rank points to the items in the search index. Click Distance The Click Distance analysis calculates the number of clicks between an authoritative page and the items in the search index. An authoritative page can be a top level site, for example http://www.contoso.com, or other pages that are viewed as important. You can define Authorative pages in Central Administration. The Analytics Processing Component uses the results of the analysis to add rank points to the items in the search index. Search Clicks Social Tags The Search Clicks analysis uses information about which items users click in search results to boost or demote items in the search index. The analysis calculates a new ranking of items compared to the base relevance. The clicks data is stored in the Link database. The Social Tags analysis analyses social tags, which are words or phrases that users can apply to content to categorize information in ways that are meaningful to them. In SharePoint Server 2013, social tags are not used for refinement, ranking, or recall by default. However, you can create custom search experiences that use social tags and the information from this analysis. Social Distance The Social Distance analysis calculates the relationship between users who use the Follow person feature. The analysis calculates first and second level Followings: first level Followings first, and then Followings of Following. The information is used to sort People Search results by social distance. Search Reports The Search Reports analysis aggregates data and stores the data in the Analytics reporting database where it's used to generate these search reports: •Number of queries •Top queries •Abandoned queries •No result queries •Query rule usage The report information is saved in the Search service application, and not with the items in the search index. If you delete the Search service application, the report information is also deleted. Deep Links The Deep Links analysis uses information about what people actually click in the search results to calculate what the most important sub-pages on a site are. These pages are displayed in the search results as important shortcuts for the site, and users can access the relevant sub-pages directly from the search results.
  • 13.
  • 14.
  • 15.
    + Follow when you know sources ofinformation that are generally relevant @nmoneypenny wwww.Synxi.com ? Search Discovery when you know what information you need now but don’t know where it is when you don’t know what you need now or even know that it exists
  • 16.
  • 17.
  • 18.
  • 19.
  • 20.
  • 21.
  • 22.
    ( ) ( ) () ( ) ( ) ( ) ( ) ( ) ( ) ( ) ( ) ( ) ( ) ( ) ( ) ( ) ( ) ( ) (.) Input space Feature space Note: feature space is of higher dimension than the input space in practice @nmoneypenny wwww.Synxi.com
  • 23.
  • 24.
    Recommendations of Content, People,and Topics Relevancy & Quality Recency New to you? Popularity People like you Ratings Inferred Relative Expertise Personalization Topic 1 Topic 2 Topic 3 Topic 4 . . . . . . . . . . . . . Topic N . . . . . . . Topic N Inferred Interests Topic 1 Contextualization @nmoneypenny wwww.Synxi.com Topic 2 Topic 3 Topic 4 . . . . . .
  • 25.
    The Adaptive ITStack ® Learning Layer Synxi / Personalization Apps Social Layer Social Platforms Process Layer Content & Applications Layer Cloud (Internal or External) @nmoneypenny wwww.Synxi.com SharePoint
  • 28.
  • 29.
    Content, subject and people recommendations sourcedfrom tibbr Recommended cross-contextualized and personalized SharePoint documents @nmoneypenny wwww.Synxi.com
  • 30.
    Context Aware Personalizing anddelivering what’s most relevant to the user’s current activities Personalization Recommendations Machine learningbased inferences of interests and expertise @nmoneypenny wwww.Synxi.com Recommend knowledge and expertise (i.e., content and other users). Engineered serendipity!
  • 31.
  • 32.
  • 33.

Editor's Notes

  • #10 There is a new analytics platform in SharePoint 2013 that completely replaces the Web Analytics service application from SharePoint 2010. We had some very specific reasons why we decided to take this approach. First, there was no ability to do item to item recommendations. For example, users who viewed this item also viewed these three other things. Secondly, it didn’t give us a way to promote search results based on an item’s popularity. This means being able to have items that are viewed more frequently percolate up higher in a set of search results. It also didn’t have a way to account for views of list items – so you couldn’t tell what items in a list were being viewed most frequently. Finally, from a hardware perspective it sometimes required a big server to power the Web Analytics service application, and even at that we hit certain thresholds where there was just more data than we could report on.**********************************************Pg. 121
  • #11 The new Analytics Processing features in SharePoint 2013 is designed to resolve those issues with these features. You can modify search relevance based on how frequently an item has been viewed – whether from clicking on a search result or just clicking through an item in a site. You can pull up reports directly in a list or library to see how frequently each items has been viewed, both individually and compared to other items in the library. You can look at discussion threads to see which ones are getting the most views, and you can also add this popularity information to page views you create with the Content By Search web part. The model is also extensible so third parties can add new events and track them using the same platform.********************************Pg. 121
  • #12 The analytics data processing process is done by the search service application in SharePoint 2013. Usage data like views and clicks from normal site traffic activity are combined with click through and other search metrics and then pushed in the analytics reporting database. A small piece of that data – the recent and all time view count info – is also pushed into the search index. That’s what gives you the capability to use that usage info when you’re looking at search results. An analytics processing job is responsible for examining data for clicks, links and tags, as well as aggregating all of the usage data, to create that data for the analytics reporting database.That concludes what’s new in analytics in SharePoint 2013 – now let’s look at a demo.****************************************************************************Pg. 122
  • #23 The kernel trick comes to rescue
  • #27 Additionally if no specific context is required, the most relevant content and expertise recommendations can be added to each users MySite or home page to a create a more sticky, truly personalized experience. Recommendations anticipate what users need.
  • #28 Additionally if no specific context is required, the most relevant content and expertise recommendations can be added to each users MySite or home page to a create a more sticky, truly personalized experience. Recommendations anticipate what users need.