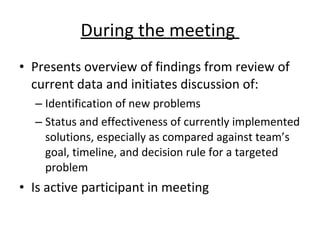
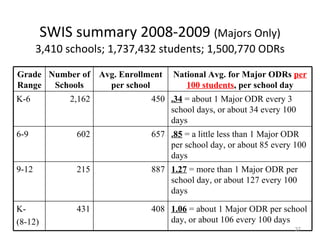
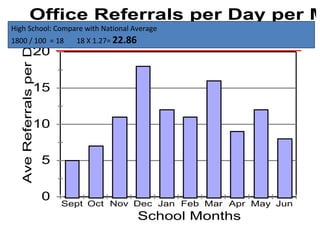
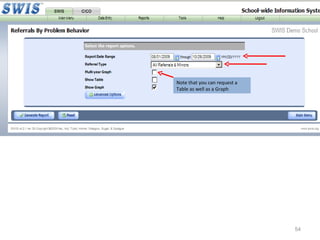
Becoming a Data Analyst Written by  Steve Newton, Rob Horner and Anne W. Todd, University of Oregon Bob Algozzine and Kate Algozzine, University of North Carolina at Charolette  &  Present by Anne Todd, UO and Rick Kirschmann, East County March 15, 2010 and April 1, 2010
“ Who is going to do it? Everyone’s just too worn out.” People aren’t tired from solving problems – they’re are tired from solving the same problem over and over.
Team-Initiated  Problem Solving (TIPS)  Authors:  Rob Horner, Steve Newton, & Anne Todd, University of Oregon Bob Algozzine & Kate Algozzine, University of North Carolina at Charlotte Background information Grant – “Enhancing Data-based Decision Making in Schools” Specifically to teach SW PBIS teams to use SWIS data Funded by U. S. Department of Education’s Institute of Education Sciences 4-year project Project goals Develop assessment instrument to measure decision making & problem solving of PBIS Teams Develop problem-solving model (“TIPS”) to enhance data-based decision making Conduct initial workshops and do field testing in  Oregon & North Carolina Conduct 2 rigorous research studies – Does instruction in use of TIPs actually enhance teams’ data-based decision making?
Collect and Use Data Develop  Hypothesis  Discuss and Select Solutions Develop and Implement Action Plan Evaluate and Revise Action Plan Problem Solving   Meeting Foundations Team Initiated Problem Solving (TIPS) Model Identify  Problems
Themes & Assumptions Decision making is aided by access to data (“data-based decision making”- DBDM) PBIS Team meetings are a major context for DBDM Providing instruction on how to embed DBDM in a problem-solving model (TIPS) will result in problem solving that is  Thorough Logical Efficient Effective Structure of meetings lays foundation for efficiency and effectiveness
Collect and Use Data Develop  Hypothesis  Discuss and Select Solutions Develop and Implement Action Plan Evaluate and Revise Action Plan Problem Solving   Meeting Foundations Team Initiated Problem Solving (TIPS) Model Identify  Problems
What we are learning Data analyst role is critical We all need back up plans Team training and coaching are critical Training critical skills to facilitator, minute taker, and data analyst Documenting decision, actions, timelines, evaluation plan is critical for sustainability Launch the meeting with data summary
Launch the meeting with a data summary that helps define the problem with precision How? Establish the role of a data analyst (and backup person) Teach data analyst to develop data summary Oakes, DIBELS, SWIS…. Etc Start meeting with defining the problem with precision Refine precision of problem statement through inferences and hypothesis  Have data accessible for custom report generation during the meeting
Problem-Solving  Meeting Foundations Structure of meetings lays foundation for efficiency & effectiveness
Building a system that is NOT person dependent We want to walk into a meeting having no previous history, review the previous meeting minutes be able to fit into any role needed Facilitator Minute taker Data analyst Active team member Example……
Using Meeting Minutes Documentation of  Logistics of meeting (date, time, location, roles) Agenda items for today’s meeting ( and next meeting) Discussion items, decisions made, tasks and timelines assigned Problem statements, solutions/decisions/tasks, people assigned to implement with timelines assigned, and an evaluation plan to determine the effect on student behavior  Reviewing Meeting minutes  An effective strategy for getting a snapshot of what happened at the previous meeting and what needs to be reviewed during the upcoming meeting What was the issue/problem?, What were we going to do?, Who was going to do it and by When?, and How are we measuring progress toward the goal? Visual tracking of focus topics during and after meetings Prevents side conversations Prevents repetition  Encourages completion of tasks
Documentation of  Logistics of meeting (date, time, location, roles) Agenda items for today’s meeting ( and next meeting) Discussion items, decisions made, tasks and timelines assigned Problem statements, solutions/decisions/tasks, people assigned to implement with timelines assigned, and an evaluation plan to determine the effect on student behavior  Reviewing Meeting minutes  An effective strategy for getting a snapshot of what happened at the previous meeting and what needs to be reviewed during the upcoming meeting What was the issue/problem?, What were we going to do?, Who was going to do it and by When?, and How are we measuring progress toward the goal? Visual tracking of focus topics during and after meetings Prevents side conversations Prevents repetition  Encourages completion of tasks  Using Meeting Minutes 03/15/10
Organizing for an effective  problem solving conversation 03/15/10 Problem Solution Out of Time Use Data  A key to collective problem solving is to provide a visual context that allows everyone to follow and contribute
Langley Elementary PBIS Team Meeting Minutes and Problem-Solving Action Plan Form Today’s Meeting:  Date, time, location:  Facilitator:  Minute Taker: Data Analyst:  Next Meeting: Date, time, location:  Facilitator:  Minute Taker: Data Analyst:  Team Members (bold are present today) Administrative/General Information and Issues Problem-Solving Action Plan Evaluation of Team Meeting (Mark your ratings with an “X”) Where in the Form would you place: Planning for next PTA meeting? Too many students in the “intensive support” for literacy Schedule for hallway monitoring for next month There have been five fights on playground in last month. Next meeting report on lunch-room status. 03/15/10 Today’s Agenda Items  Next Meeting Agenda Items 01.  02.  03.  Information for Team, or Issue for Team to Address Discussion/Decision/Task (if applicable) Who? By When? Implementation and Evaluation Precise Problem Statement, based on review of data (What, When, Where, Who, Why) Solution Actions (e.g., Prevent, Teach, Prompt, Reward, Correction, Extinction, Safety) Who? By When? Goal, Timeline,  Decision Rule, & Updates Our Rating Yes So-So No 1. Was today’s meeting a good use of our time? 2. In general, did we do a good job of  tracking  whether we’re completing the tasks we agreed on at previous meetings? 3. In general, have we done a good job of actually  completing  the tasks we agreed on at previous meetings? 4. In general, are the completed tasks having the  desired effects  on student behavior?
Langley Elementary PBIS Team Meeting Minutes and Problem-Solving Action Plan Form Today’s Meeting:  Date, time, location:  Facilitator:  Minute Taker: Data Analyst:  Next Meeting: Date, time, location:  Facilitator:  Minute Taker: Data Analyst:  Team Members (bold are present today) Administrative/General Information and Issues Problem-Solving Action Plan Evaluation of Team Meeting (Mark your ratings with an “X”) Today’s Agenda Items  Next Meeting Agenda Items 01.  02.  03.  Information for Team, or Issue for Team to Address Discussion/Decision/Task (if applicable) Who? By When? Implementation and Evaluation Precise Problem Statement, based on review of data (What, When, Where, Who, Why) Solution Actions (e.g., Prevent, Teach, Prompt, Reward, Correction, Extinction, Safety) Who? By When? Goal, Timeline,  Decision Rule, & Updates Our Rating Yes So-So No 1. Was today’s meeting a good use of our time? 2. In general, did we do a good job of  tracking  whether we’re completing the tasks we agreed on at previous meetings? 3. In general, have we done a good job of actually  completing  the tasks we agreed on at previous meetings? 4. In general, are the completed tasks having the  desired effects  on student behavior?
 
Important Structural Components Regular meetings & regular attendance The “right” people The right roles Facilitator Minute Taker Data Analyst Active Team Members Accomplishments – Products of successful meeting Meeting Minutes (record of decisions & tasks concerning administrative/general issues) Problem-Solving Action Plan (record of decisions & tasks concerning problems identified by team) (We’ll discuss these in more detail later in this workshop)
03/15/10 Any tasks assigned get copied to the meeting minutes of the next meeting as a follow up item Meeting Agenda Item:  Meeting Foundations  Tasks:  What, by whom, by when
03/15/10 Meeting Foundations
Role & Responsibilities Role: To create data summaries that will facilitate the team in  determining if there are problems  jump starting a problem solving discussion, and  evaluating the impact of solutions and fidelity of implementation General Responsibilities Prepares a brief written summary for distribution at meetings using each of the data sources needed for problem solving and decision making  Help to generate reports during the meeting as questions of the data arise
Before the meeting  Advises Backup team member in advance if unable to attend meeting, so that Backup team member is prepared to assume role Creates data summary to report status of solutions/decisions from previous meetings Creates a data summary report to identify Potential New Problems (if any) Asks the Facilitator to add Potential New Problems to agenda for upcoming meeting Brings Data notebook to meeting Is ready to make the following available at meeting, as appropriate: The SWIS “Big 5 ” reports (used to identify/show potential new problems) Custom or other reports (to confirm/disconfirm inferences regarding new problems; to show “pre-solution” data for identified problems that do not have currently implemented solutions; to show "post-solution” data for problems that do have currently implemented solutions Data can be made available to team members via projection through a laptop that can be passed from team member to team member or hard copies that can be passed from team member to team member; etc.
During the meeting  Presents overview of findings from review of current data and initiates discussion of: Identification of new problems Status and effectiveness of currently implemented solutions, especially as compared against team’s goal, timeline, and decision rule for a targeted problem Is active participant in meeting
After the meeting  Complete any assigned tasks Make a note in calendar to prepare data summary for next meeting
Necessary skills Fluency in navigating through the database to generate reports and to create more customized reports based on generated questions. Access to database before meetings and during the meeting
Necessary Resources A person or two with defined skills for meeting the responsibilities A person with some time (~30 minutes) to generate data summaries before the meeting
How SWIS TM  works Data Entry School Address and Contact Enrollment/Ethnicity/Days per month Staff Information Student Information Referrals Reporting Average Referrals per Day per month Referrals by Problem Behavior Referrals by Location Referrals by Time Referrals by Student Other Reports Tools
 
Organizing SWIS Data for Decision-making Universal Screening Tool Proportion of students with  0-1 Office Discipline Referrals (ODRs) 2-5 ODRs 6+ ODRs Progress Monitoring Tool  Compare data across time Prevent previous problem patterns  Define Problems with precision that lead to solvable problems
Using the Referrals by Student report as a Universal Screening Tool
~80% of Students ~15%  ~5%  0-1 office discipline referral 6+ office discipline referrals 2-5 office discipline referrals Using office discipline referrals as a metric for universal screening of student social behavior
Total Office Discipline Referrals Total Office Discipline Referrals as of January 10
 
SWIS summary 2008-2009  (Majors Only) 3,410 schools; 1,737,432 students; 1,500,770 ODRs Grade Range Number of Schools Avg. Enrollment per school National Avg. for Major ODRs  per   100 students , per school day K-6 2,162 450 .34  = about 1 Major ODR every 3 school days, or about 34 every 100 days 6-9 602 657 .85  = a little less than 1 Major ODR per school day, or about 85 every 100 days 9-12 215 887 1.27  = more than 1 Major ODR per school day, or about 127 every 100 days K- (8-12) 431 408 1.06  = about 1 Major ODR per school day, or about 106 every 100 days
This Elementary School has 150 Students Is there a problem?
Add slide for Elementary with 450 students/same data set as previous 450/100 = 4.5  4.5 X .34 = 1.53
This Middle School has 600 Students Is there a problem?
Add slide for Middle with 450 students/same data set as previous 450/100 = 4.5  4.5 X .85 = 3.8
High School of 1800 students High School: Compare with National Average 1800 / 100  = 18  18 X 1.27=  22.86
Add slide for high school with 450 students/same data set as previous 450/100 = 4.5  4.5 X 1.27 = 5.7
Middle School of 700 students
 
 
Identification of Problem (for example...) Our average Major ODRs per school day per month are higher than national average for a school of our enrollment size Our average ODRs per school day per month are higher this year than for corresponding months of previous year Our average ODRs per school day per month are showing an increasing trend Faculty, parents, and students say our ODR levels are too high
More Precision Is Required to Solve the Identified Problem Define  problem by identifying W hat  problem behaviors are involved in ODRs Clarify  problem by identifying When  ODRs are occurring (time of day) Where  ODRs are occurring (location) Who  is engaging in problem behaviors that result in ODRs
Problem Statements Ultimately, you want to write a “problem statement” that precisely specifies the problem you identified The more  Ws  (what, when, where, who) you incorporate into the problem statement, the more precise the problem statement will be The more precise the problem statement, the easier it will be to generate a solution that “fits” the problem
Which Statement Is More Precise? 1a. Too many ODRs 1b. Too many instances of disrespect 2a. Too many ODRs between 1:00pm and 1:30pm 2b. Too many ODRs in the afternoon 3a. Too many ODRs occurring outside the classrooms 3b. Too many ODRs on the playground 4a. 25% of students have at least 2 ODRs  4b. Many students are experiencing ODRs 5a. Too many ODRs on the playground 5b. Total of 12 aggression ODRs on  playground last month; more than last year & showing increasing trend this year; occurring during first recess; 8 different students involved
 
Defining the Problem What  Problem Behaviors are Occurring? Are there lots of different types of problems or just a few? How do the problem behaviors fit with the SW expectations? What other questions do these data pose?
Note that you can request a Table as well as a Graph
Are there lots of different types of problems or just a few? How do the problem behaviors fit with the SW expectations? What other questions do these data pose?
Clarifying the Problem When  Are Problem Behaviors Occurring? Are there lots of different times when problems occur or a period(s) of time when problems occur? How do the times fit with our daily schedule? What other questions do these data pose?
Are there lots of different times when problems occur or a period(s) of time when problems occur? How do the times fit with our daily schedule? What other questions do these data pose?
Clarifying the Problem Where  Are Problem Behaviors Occurring? Many locations or just a few?
Many locations or just a few? What other questions do these data pose?
Clarifying the Problem Who  Is Engaging in Problem Behaviors?
Achieving a Precise Problem Statement for Fictional Trevor Test School Middle School – Grades 6, 7, & 8 565 students
Trevor Test Middle School n= 565  grades 6-8 Is there a problem? Are there patterns, trends, peaks?
Trevor Test Middle School Identified Problem Identified problem for last 4 mos., Major ODRs per day higher than national avg. increasing trend across all 5 mos.
Trevor Test Middle School  11/01/2007 through 01/31/2008 (last 3 mos.)
Two problems The sixth graders are disruptive  & use inappropriate language in the cafeteria between 11:30 AM and 12:00 PM to get peer attention. A smaller number of students engage in  skipping and noncompliance/defiance  in classes, (mostly in rooms 13, 14 and 18), and these behaviors appear to be maintained by escape. Work on one problem at a time… prioritize
~80% of Students ~15%  ~5%  0-1 office discipline referral 6+ office discipline referrals 2-5 office discipline referrals Using office discipline referrals as a metric for universal screening of student social behavior
Using the Referrals by Student report as a Universal Screening Tool
 
JM The CICO Coordinator had a baby! no back up person no one looking at the data BAD… don’t do this!
Baseline Check In Check Out
 
Plan Change 2/10/2010: Check out with preferred adult
 
Brian Bender  SWIS Report  generated 3/10
 

Data Analyst Role

  • 1.
    Becoming a DataAnalyst Written by Steve Newton, Rob Horner and Anne W. Todd, University of Oregon Bob Algozzine and Kate Algozzine, University of North Carolina at Charolette & Present by Anne Todd, UO and Rick Kirschmann, East County March 15, 2010 and April 1, 2010
  • 2.
    “ Who isgoing to do it? Everyone’s just too worn out.” People aren’t tired from solving problems – they’re are tired from solving the same problem over and over.
  • 3.
    Team-Initiated ProblemSolving (TIPS) Authors: Rob Horner, Steve Newton, & Anne Todd, University of Oregon Bob Algozzine & Kate Algozzine, University of North Carolina at Charlotte Background information Grant – “Enhancing Data-based Decision Making in Schools” Specifically to teach SW PBIS teams to use SWIS data Funded by U. S. Department of Education’s Institute of Education Sciences 4-year project Project goals Develop assessment instrument to measure decision making & problem solving of PBIS Teams Develop problem-solving model (“TIPS”) to enhance data-based decision making Conduct initial workshops and do field testing in Oregon & North Carolina Conduct 2 rigorous research studies – Does instruction in use of TIPs actually enhance teams’ data-based decision making?
  • 4.
    Collect and UseData Develop Hypothesis Discuss and Select Solutions Develop and Implement Action Plan Evaluate and Revise Action Plan Problem Solving Meeting Foundations Team Initiated Problem Solving (TIPS) Model Identify Problems
  • 5.
    Themes & AssumptionsDecision making is aided by access to data (“data-based decision making”- DBDM) PBIS Team meetings are a major context for DBDM Providing instruction on how to embed DBDM in a problem-solving model (TIPS) will result in problem solving that is Thorough Logical Efficient Effective Structure of meetings lays foundation for efficiency and effectiveness
  • 6.
    Collect and UseData Develop Hypothesis Discuss and Select Solutions Develop and Implement Action Plan Evaluate and Revise Action Plan Problem Solving Meeting Foundations Team Initiated Problem Solving (TIPS) Model Identify Problems
  • 7.
    What we arelearning Data analyst role is critical We all need back up plans Team training and coaching are critical Training critical skills to facilitator, minute taker, and data analyst Documenting decision, actions, timelines, evaluation plan is critical for sustainability Launch the meeting with data summary
  • 8.
    Launch the meetingwith a data summary that helps define the problem with precision How? Establish the role of a data analyst (and backup person) Teach data analyst to develop data summary Oakes, DIBELS, SWIS…. Etc Start meeting with defining the problem with precision Refine precision of problem statement through inferences and hypothesis Have data accessible for custom report generation during the meeting
  • 9.
    Problem-Solving MeetingFoundations Structure of meetings lays foundation for efficiency & effectiveness
  • 10.
    Building a systemthat is NOT person dependent We want to walk into a meeting having no previous history, review the previous meeting minutes be able to fit into any role needed Facilitator Minute taker Data analyst Active team member Example……
  • 11.
    Using Meeting MinutesDocumentation of Logistics of meeting (date, time, location, roles) Agenda items for today’s meeting ( and next meeting) Discussion items, decisions made, tasks and timelines assigned Problem statements, solutions/decisions/tasks, people assigned to implement with timelines assigned, and an evaluation plan to determine the effect on student behavior Reviewing Meeting minutes An effective strategy for getting a snapshot of what happened at the previous meeting and what needs to be reviewed during the upcoming meeting What was the issue/problem?, What were we going to do?, Who was going to do it and by When?, and How are we measuring progress toward the goal? Visual tracking of focus topics during and after meetings Prevents side conversations Prevents repetition Encourages completion of tasks
  • 12.
    Documentation of Logistics of meeting (date, time, location, roles) Agenda items for today’s meeting ( and next meeting) Discussion items, decisions made, tasks and timelines assigned Problem statements, solutions/decisions/tasks, people assigned to implement with timelines assigned, and an evaluation plan to determine the effect on student behavior Reviewing Meeting minutes An effective strategy for getting a snapshot of what happened at the previous meeting and what needs to be reviewed during the upcoming meeting What was the issue/problem?, What were we going to do?, Who was going to do it and by When?, and How are we measuring progress toward the goal? Visual tracking of focus topics during and after meetings Prevents side conversations Prevents repetition Encourages completion of tasks Using Meeting Minutes 03/15/10
  • 13.
    Organizing for aneffective problem solving conversation 03/15/10 Problem Solution Out of Time Use Data A key to collective problem solving is to provide a visual context that allows everyone to follow and contribute
  • 14.
    Langley Elementary PBISTeam Meeting Minutes and Problem-Solving Action Plan Form Today’s Meeting: Date, time, location: Facilitator: Minute Taker: Data Analyst: Next Meeting: Date, time, location: Facilitator: Minute Taker: Data Analyst: Team Members (bold are present today) Administrative/General Information and Issues Problem-Solving Action Plan Evaluation of Team Meeting (Mark your ratings with an “X”) Where in the Form would you place: Planning for next PTA meeting? Too many students in the “intensive support” for literacy Schedule for hallway monitoring for next month There have been five fights on playground in last month. Next meeting report on lunch-room status. 03/15/10 Today’s Agenda Items Next Meeting Agenda Items 01. 02. 03. Information for Team, or Issue for Team to Address Discussion/Decision/Task (if applicable) Who? By When? Implementation and Evaluation Precise Problem Statement, based on review of data (What, When, Where, Who, Why) Solution Actions (e.g., Prevent, Teach, Prompt, Reward, Correction, Extinction, Safety) Who? By When? Goal, Timeline, Decision Rule, & Updates Our Rating Yes So-So No 1. Was today’s meeting a good use of our time? 2. In general, did we do a good job of tracking whether we’re completing the tasks we agreed on at previous meetings? 3. In general, have we done a good job of actually completing the tasks we agreed on at previous meetings? 4. In general, are the completed tasks having the desired effects on student behavior?
  • 15.
    Langley Elementary PBISTeam Meeting Minutes and Problem-Solving Action Plan Form Today’s Meeting: Date, time, location: Facilitator: Minute Taker: Data Analyst: Next Meeting: Date, time, location: Facilitator: Minute Taker: Data Analyst: Team Members (bold are present today) Administrative/General Information and Issues Problem-Solving Action Plan Evaluation of Team Meeting (Mark your ratings with an “X”) Today’s Agenda Items Next Meeting Agenda Items 01. 02. 03. Information for Team, or Issue for Team to Address Discussion/Decision/Task (if applicable) Who? By When? Implementation and Evaluation Precise Problem Statement, based on review of data (What, When, Where, Who, Why) Solution Actions (e.g., Prevent, Teach, Prompt, Reward, Correction, Extinction, Safety) Who? By When? Goal, Timeline, Decision Rule, & Updates Our Rating Yes So-So No 1. Was today’s meeting a good use of our time? 2. In general, did we do a good job of tracking whether we’re completing the tasks we agreed on at previous meetings? 3. In general, have we done a good job of actually completing the tasks we agreed on at previous meetings? 4. In general, are the completed tasks having the desired effects on student behavior?
  • 16.
  • 17.
    Important Structural ComponentsRegular meetings & regular attendance The “right” people The right roles Facilitator Minute Taker Data Analyst Active Team Members Accomplishments – Products of successful meeting Meeting Minutes (record of decisions & tasks concerning administrative/general issues) Problem-Solving Action Plan (record of decisions & tasks concerning problems identified by team) (We’ll discuss these in more detail later in this workshop)
  • 22.
    03/15/10 Any tasksassigned get copied to the meeting minutes of the next meeting as a follow up item Meeting Agenda Item: Meeting Foundations Tasks: What, by whom, by when
  • 23.
  • 24.
    Role & ResponsibilitiesRole: To create data summaries that will facilitate the team in determining if there are problems jump starting a problem solving discussion, and evaluating the impact of solutions and fidelity of implementation General Responsibilities Prepares a brief written summary for distribution at meetings using each of the data sources needed for problem solving and decision making Help to generate reports during the meeting as questions of the data arise
  • 25.
    Before the meeting Advises Backup team member in advance if unable to attend meeting, so that Backup team member is prepared to assume role Creates data summary to report status of solutions/decisions from previous meetings Creates a data summary report to identify Potential New Problems (if any) Asks the Facilitator to add Potential New Problems to agenda for upcoming meeting Brings Data notebook to meeting Is ready to make the following available at meeting, as appropriate: The SWIS “Big 5 ” reports (used to identify/show potential new problems) Custom or other reports (to confirm/disconfirm inferences regarding new problems; to show “pre-solution” data for identified problems that do not have currently implemented solutions; to show "post-solution” data for problems that do have currently implemented solutions Data can be made available to team members via projection through a laptop that can be passed from team member to team member or hard copies that can be passed from team member to team member; etc.
  • 26.
    During the meeting Presents overview of findings from review of current data and initiates discussion of: Identification of new problems Status and effectiveness of currently implemented solutions, especially as compared against team’s goal, timeline, and decision rule for a targeted problem Is active participant in meeting
  • 27.
    After the meeting Complete any assigned tasks Make a note in calendar to prepare data summary for next meeting
  • 28.
    Necessary skills Fluencyin navigating through the database to generate reports and to create more customized reports based on generated questions. Access to database before meetings and during the meeting
  • 29.
    Necessary Resources Aperson or two with defined skills for meeting the responsibilities A person with some time (~30 minutes) to generate data summaries before the meeting
  • 30.
    How SWIS TM works Data Entry School Address and Contact Enrollment/Ethnicity/Days per month Staff Information Student Information Referrals Reporting Average Referrals per Day per month Referrals by Problem Behavior Referrals by Location Referrals by Time Referrals by Student Other Reports Tools
  • 31.
  • 32.
    Organizing SWIS Datafor Decision-making Universal Screening Tool Proportion of students with 0-1 Office Discipline Referrals (ODRs) 2-5 ODRs 6+ ODRs Progress Monitoring Tool Compare data across time Prevent previous problem patterns Define Problems with precision that lead to solvable problems
  • 33.
    Using the Referralsby Student report as a Universal Screening Tool
  • 34.
    ~80% of Students~15% ~5% 0-1 office discipline referral 6+ office discipline referrals 2-5 office discipline referrals Using office discipline referrals as a metric for universal screening of student social behavior
  • 35.
    Total Office DisciplineReferrals Total Office Discipline Referrals as of January 10
  • 36.
  • 37.
    SWIS summary 2008-2009 (Majors Only) 3,410 schools; 1,737,432 students; 1,500,770 ODRs Grade Range Number of Schools Avg. Enrollment per school National Avg. for Major ODRs per 100 students , per school day K-6 2,162 450 .34 = about 1 Major ODR every 3 school days, or about 34 every 100 days 6-9 602 657 .85 = a little less than 1 Major ODR per school day, or about 85 every 100 days 9-12 215 887 1.27 = more than 1 Major ODR per school day, or about 127 every 100 days K- (8-12) 431 408 1.06 = about 1 Major ODR per school day, or about 106 every 100 days
  • 38.
    This Elementary Schoolhas 150 Students Is there a problem?
  • 39.
    Add slide forElementary with 450 students/same data set as previous 450/100 = 4.5 4.5 X .34 = 1.53
  • 40.
    This Middle Schoolhas 600 Students Is there a problem?
  • 41.
    Add slide forMiddle with 450 students/same data set as previous 450/100 = 4.5 4.5 X .85 = 3.8
  • 42.
    High School of1800 students High School: Compare with National Average 1800 / 100 = 18 18 X 1.27= 22.86
  • 43.
    Add slide forhigh school with 450 students/same data set as previous 450/100 = 4.5 4.5 X 1.27 = 5.7
  • 44.
    Middle School of700 students
  • 45.
  • 46.
  • 47.
    Identification of Problem(for example...) Our average Major ODRs per school day per month are higher than national average for a school of our enrollment size Our average ODRs per school day per month are higher this year than for corresponding months of previous year Our average ODRs per school day per month are showing an increasing trend Faculty, parents, and students say our ODR levels are too high
  • 48.
    More Precision IsRequired to Solve the Identified Problem Define problem by identifying W hat problem behaviors are involved in ODRs Clarify problem by identifying When ODRs are occurring (time of day) Where ODRs are occurring (location) Who is engaging in problem behaviors that result in ODRs
  • 49.
    Problem Statements Ultimately,you want to write a “problem statement” that precisely specifies the problem you identified The more Ws (what, when, where, who) you incorporate into the problem statement, the more precise the problem statement will be The more precise the problem statement, the easier it will be to generate a solution that “fits” the problem
  • 50.
    Which Statement IsMore Precise? 1a. Too many ODRs 1b. Too many instances of disrespect 2a. Too many ODRs between 1:00pm and 1:30pm 2b. Too many ODRs in the afternoon 3a. Too many ODRs occurring outside the classrooms 3b. Too many ODRs on the playground 4a. 25% of students have at least 2 ODRs 4b. Many students are experiencing ODRs 5a. Too many ODRs on the playground 5b. Total of 12 aggression ODRs on playground last month; more than last year & showing increasing trend this year; occurring during first recess; 8 different students involved
  • 51.
  • 52.
    Defining the ProblemWhat Problem Behaviors are Occurring? Are there lots of different types of problems or just a few? How do the problem behaviors fit with the SW expectations? What other questions do these data pose?
  • 54.
    Note that youcan request a Table as well as a Graph
  • 55.
    Are there lotsof different types of problems or just a few? How do the problem behaviors fit with the SW expectations? What other questions do these data pose?
  • 56.
    Clarifying the ProblemWhen Are Problem Behaviors Occurring? Are there lots of different times when problems occur or a period(s) of time when problems occur? How do the times fit with our daily schedule? What other questions do these data pose?
  • 59.
    Are there lotsof different times when problems occur or a period(s) of time when problems occur? How do the times fit with our daily schedule? What other questions do these data pose?
  • 60.
    Clarifying the ProblemWhere Are Problem Behaviors Occurring? Many locations or just a few?
  • 63.
    Many locations orjust a few? What other questions do these data pose?
  • 64.
    Clarifying the ProblemWho Is Engaging in Problem Behaviors?
  • 68.
    Achieving a PreciseProblem Statement for Fictional Trevor Test School Middle School – Grades 6, 7, & 8 565 students
  • 69.
    Trevor Test MiddleSchool n= 565 grades 6-8 Is there a problem? Are there patterns, trends, peaks?
  • 70.
    Trevor Test MiddleSchool Identified Problem Identified problem for last 4 mos., Major ODRs per day higher than national avg. increasing trend across all 5 mos.
  • 71.
    Trevor Test MiddleSchool 11/01/2007 through 01/31/2008 (last 3 mos.)
  • 73.
    Two problems Thesixth graders are disruptive & use inappropriate language in the cafeteria between 11:30 AM and 12:00 PM to get peer attention. A smaller number of students engage in skipping and noncompliance/defiance in classes, (mostly in rooms 13, 14 and 18), and these behaviors appear to be maintained by escape. Work on one problem at a time… prioritize
  • 74.
    ~80% of Students~15% ~5% 0-1 office discipline referral 6+ office discipline referrals 2-5 office discipline referrals Using office discipline referrals as a metric for universal screening of student social behavior
  • 75.
    Using the Referralsby Student report as a Universal Screening Tool
  • 76.
  • 77.
    JM The CICOCoordinator had a baby! no back up person no one looking at the data BAD… don’t do this!
  • 78.
  • 79.
  • 80.
    Plan Change 2/10/2010:Check out with preferred adult
  • 81.
  • 82.
    Brian Bender SWIS Report generated 3/10
  • 83.

Editor's Notes

  • #3 It isn’t whether you have a problem, it’s whether you have the same problem again next year.
  • #4 03/17/10 Newton, J. S., Todd, A. W., Algozzine, K., Horner, R. H., & Algozzine, B. 2008
  • #5 The full TIPS model. Two parts. Implementation of Problem Solving Meeting Foundations Use of the problem solving process (strategy?)
  • #12 03/17/10 Newton, J. S., Todd, A. W., Algozzine, K., Horner, R. H., & Algozzine, B. 2008
  • #15 This slide is animated to teach the different parts of the meeting minute form each click adds the next section Most schools have the title at the top and write/type as the meeting progresses Make a point that we don’t need to document everything that happened (i.e., NM rolled her eyes KJ entered the room, SW continued to repeat the same issue, we took at 5 minute bathroom break)
  • #16 A completed example… IF a person knows how to use the meeting minute form, the person should be able to pick these minutes up from Jan 7, 2010 and be able to organize previous items to update and facilitate creation of the Feb 3, 2010 agenda
  • #17 03/17/10 Newton, J. S., Todd, A. W., Algozzine, K., Horner, R. H., & Algozzine, B. 2008
  • #31 OK…. Building precision problem statements is a skill that is needed for using the data. organizing and interpreting the data requires another set of skills. Slides 25-47 provide a sequence of slides to illustrate different precision statements based on different pictures of the same type of data.
  • #34 Let’s talk about accuracy of the data again. When you begin to use the data and draw comparisons, the data need to be comparable. Look at the data above. First, as a data analyst, you look and see, ‘wow.. Things are getting better, the graph is going down’…. Then you do what you are supposed to do first, and look at the label on the Y axis. This label says total office discipline referrals. It is great to compare the total ODRs, but now… look at the X-axis. There are a different number of days in each month and the number of schools day in each much has a wide range (Dec may have 10 school days, January may have 19 school days). These months, the way they are arrayed here, are not comparable and this data should not be used! If you aren’t using SWIS, do the math to get average referrals per day per month by using the total referrals and the total days each month. If you are using SWIS, do not fear….. (next slide)
  • #35 SWIS does that calculation for you. look at the Y-axis label now. Average referrals per day per month allow us to compare months. Now look at the trend….. ‘we are going to have a wild spring term if we don’t do anything differently!). This is the same set of data on the previous slide and look at what the pattern of data does for the problem solving process. Accurate data and data that are formatted for purposes of making decisions is critical. I like to make this a bit dramatic by going back and forth between this slide and previous, telling them they are the team and they are reviewing this data…
  • #40 Build the routine when reviewing these slides: How many students? How many hundreds? What is the per 100 rate for your school? How are you doing? Is there a trend, are there peaks, patterns?; what can we anticipate?
  • #41 Build the routine when reviewing these slides: How many students? How many hundreds? What is the per 100 rate for your school? How are you doing? Is there a trend, are there peaks, patterns?; what can we anticipate?
  • #42 Slides 31-33 work as a set. This slide is a precursor to the next slide to show how to start with ‘this years’ data and then use it to compare to last year (slide 32) Build the routine when reviewing these slides: How many students? How many hundreds? What is the per 100 rate for your school? How are you doing? Is there a trend, are there peaks, patterns?; what can we anticipate?
  • #43 Build the routine when reviewing these slides: How many students? How many hundreds? What is the per 100 rate for your school? How are you doing? Is there a trend, are there peaks, patterns?; what can we anticipate? What happened last year that we don’t want to repeat?
  • #44 Final slide of this set Build the routine when reviewing these slides: How many students? How many hundreds? What is the per 100 rate for your school? How are you doing? Is there a trend, are there peaks, patterns?; what can we anticipate? What are we going to do next fall to maintain this success?