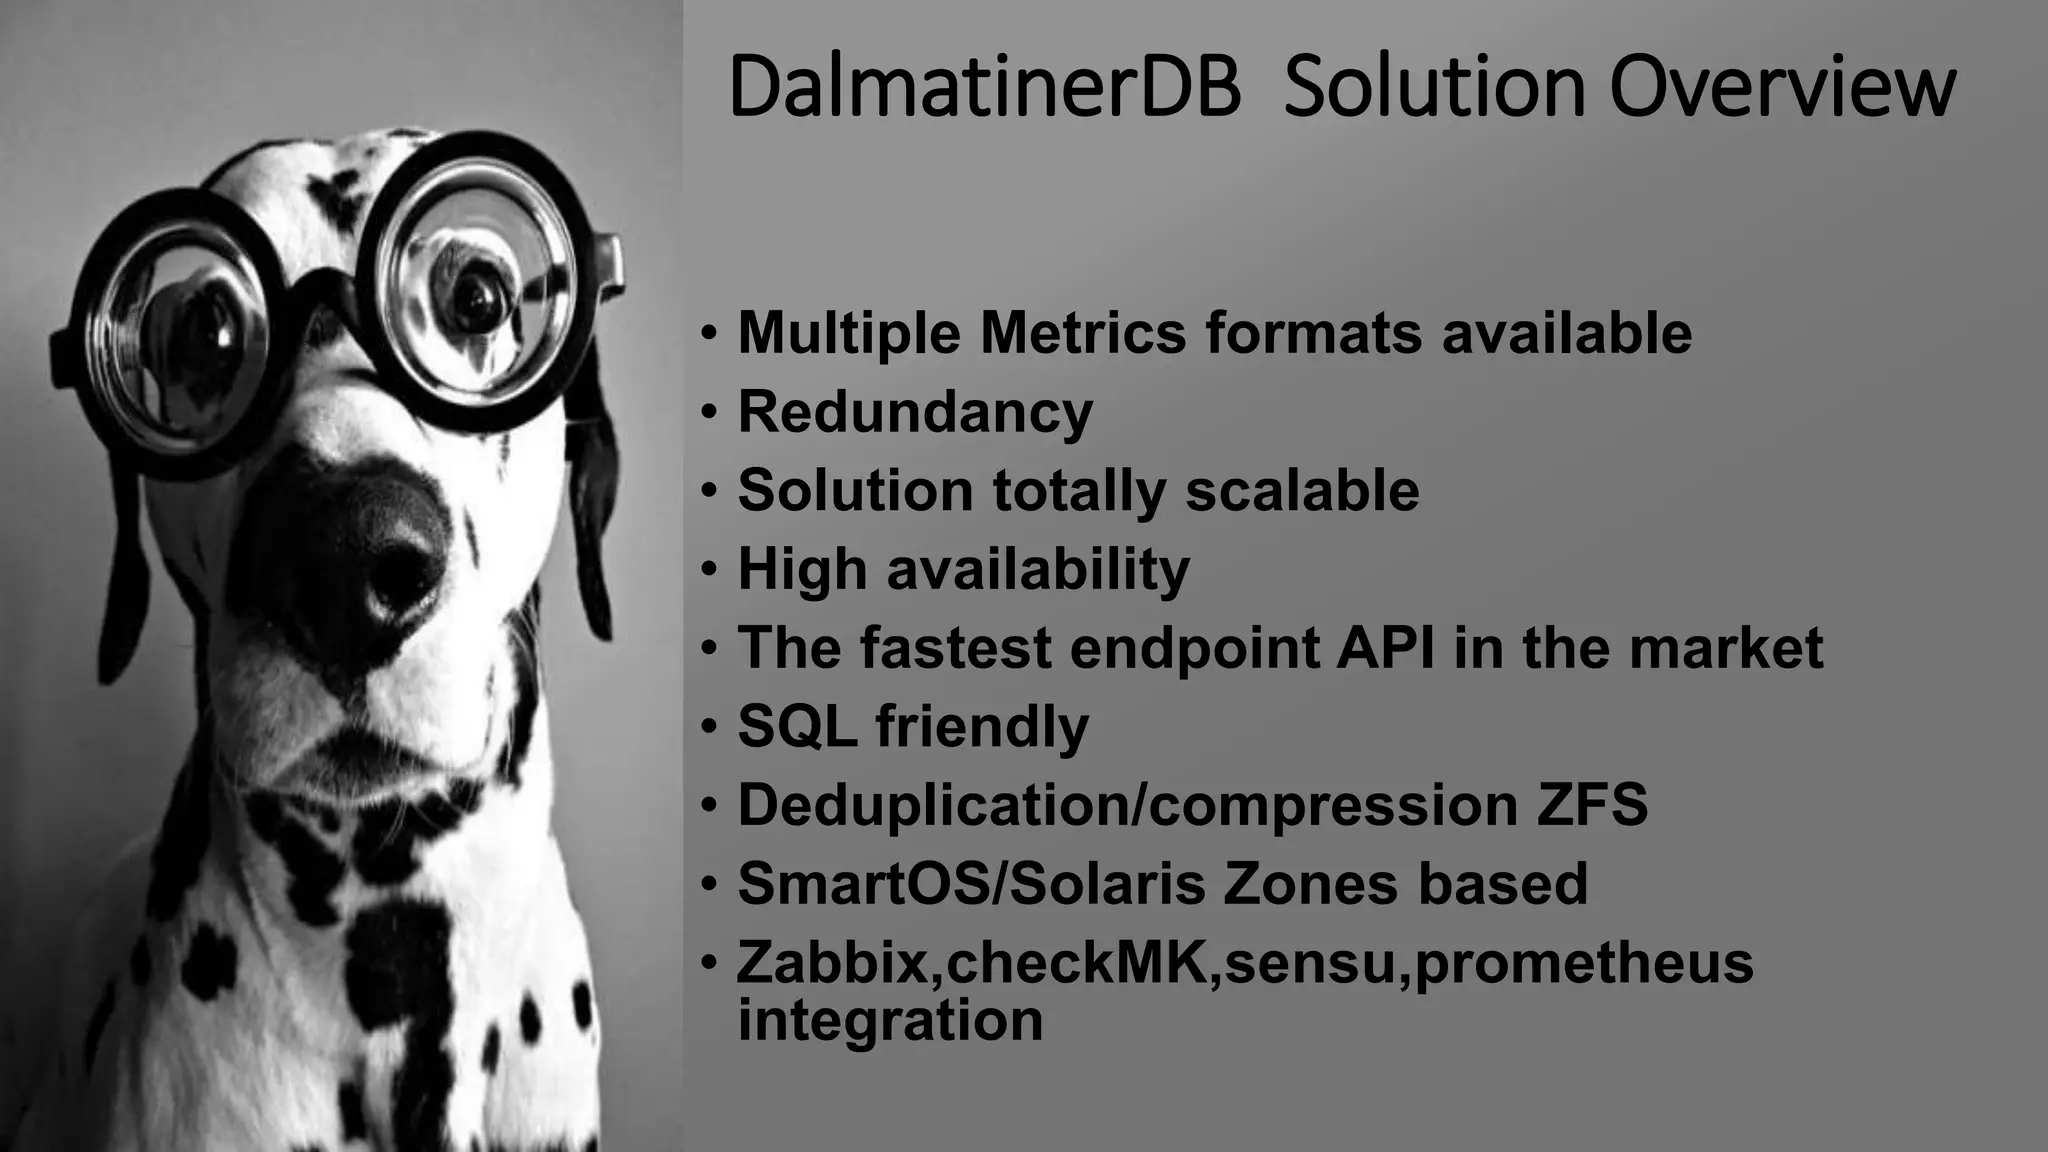
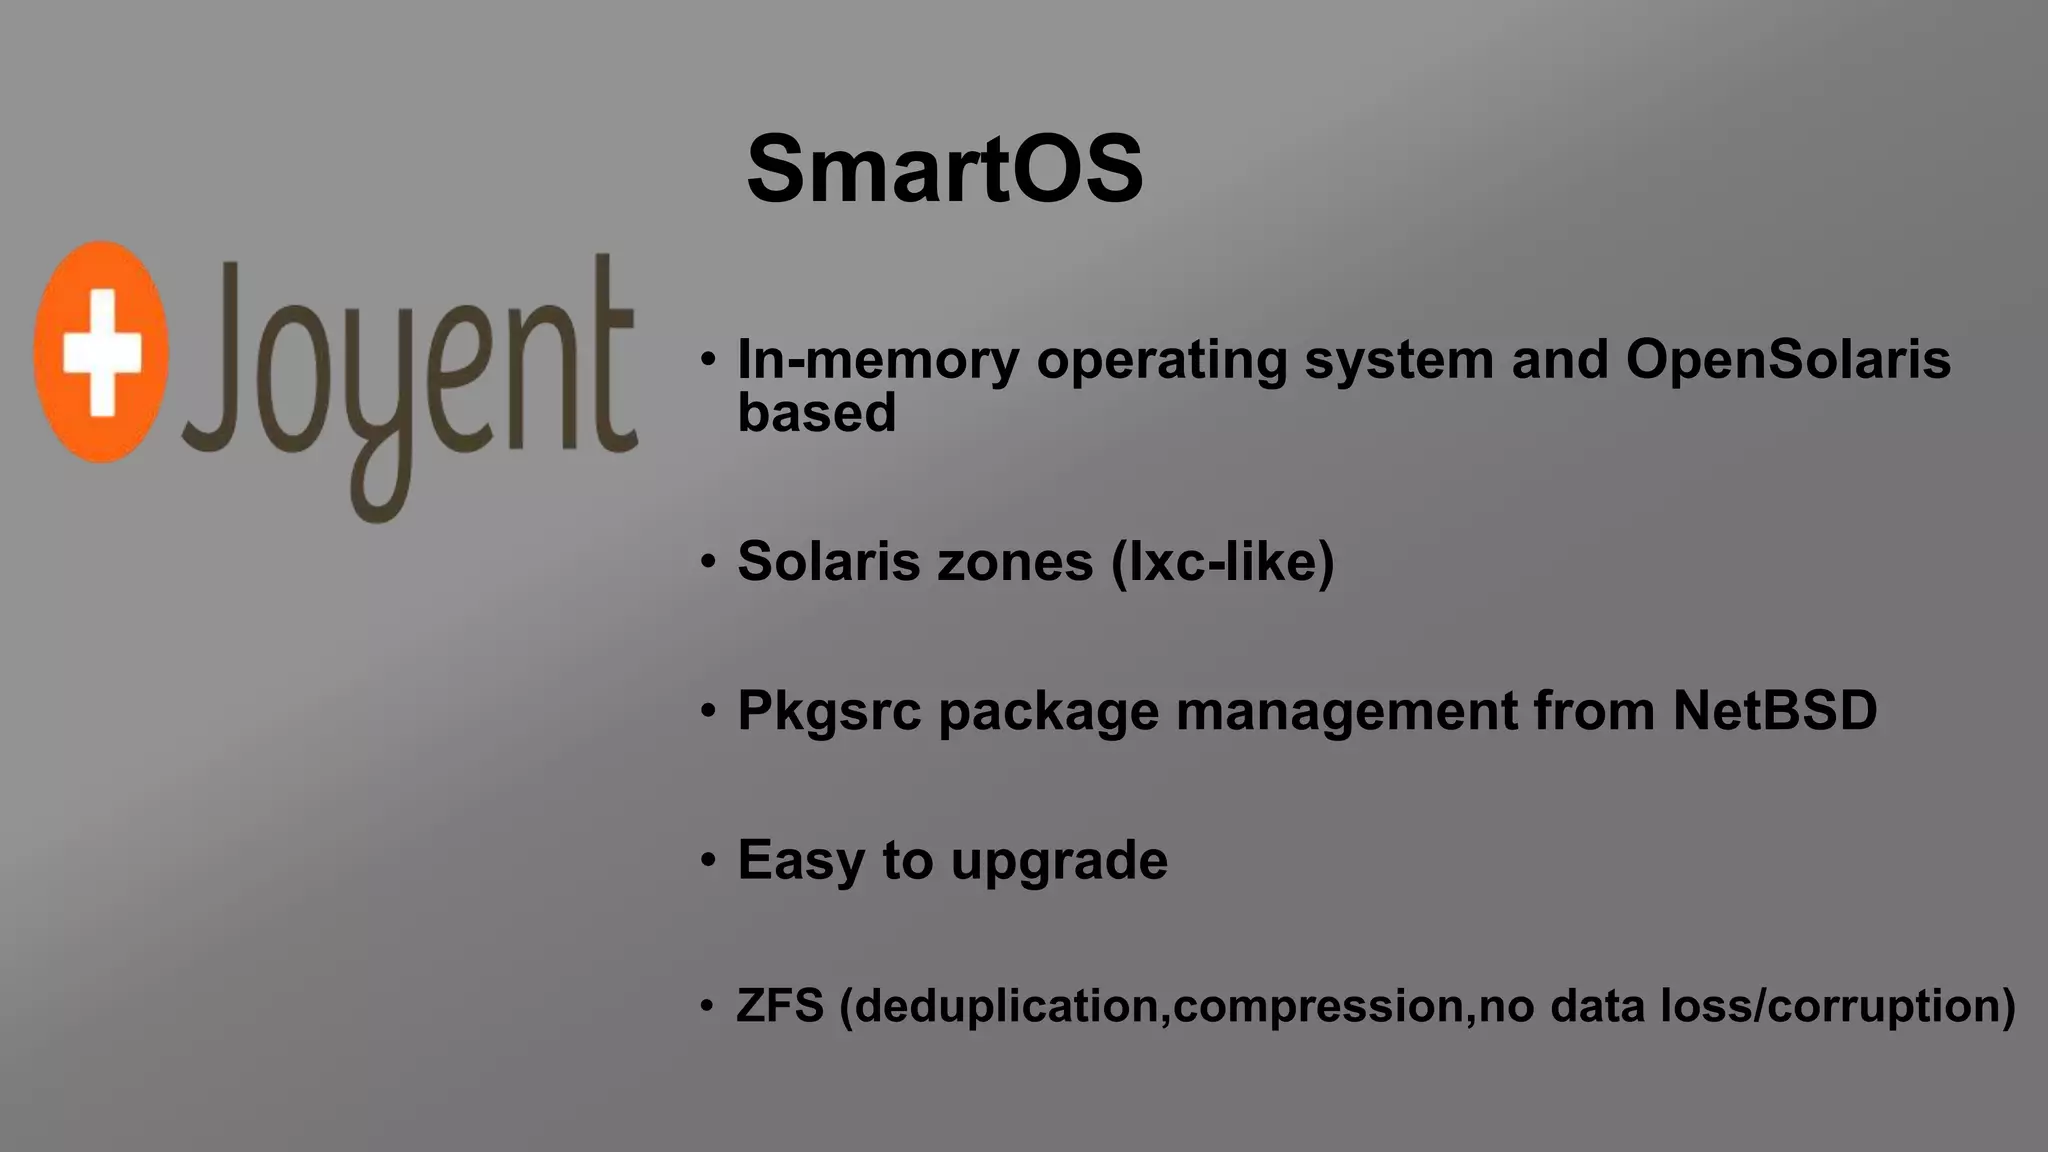
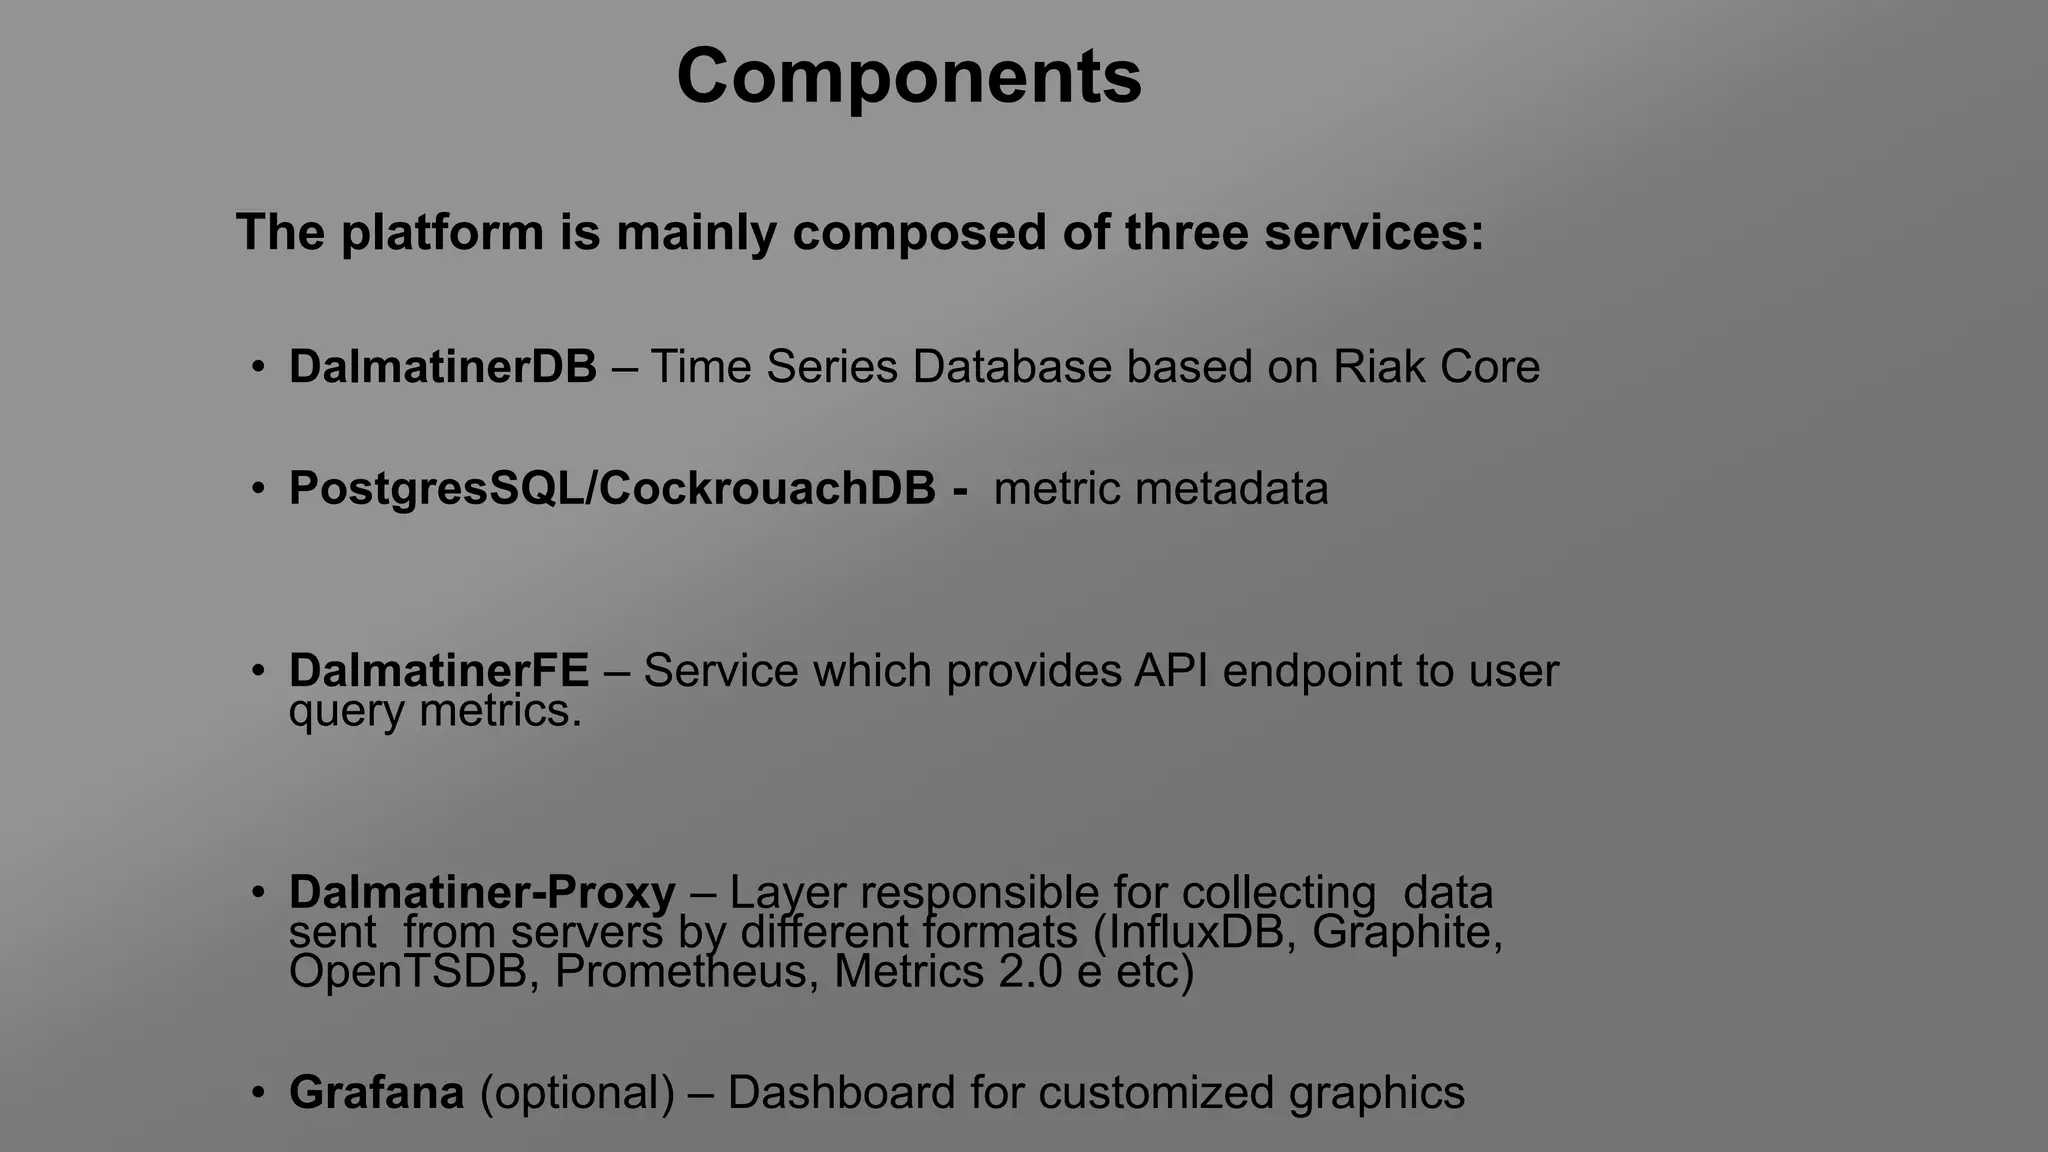
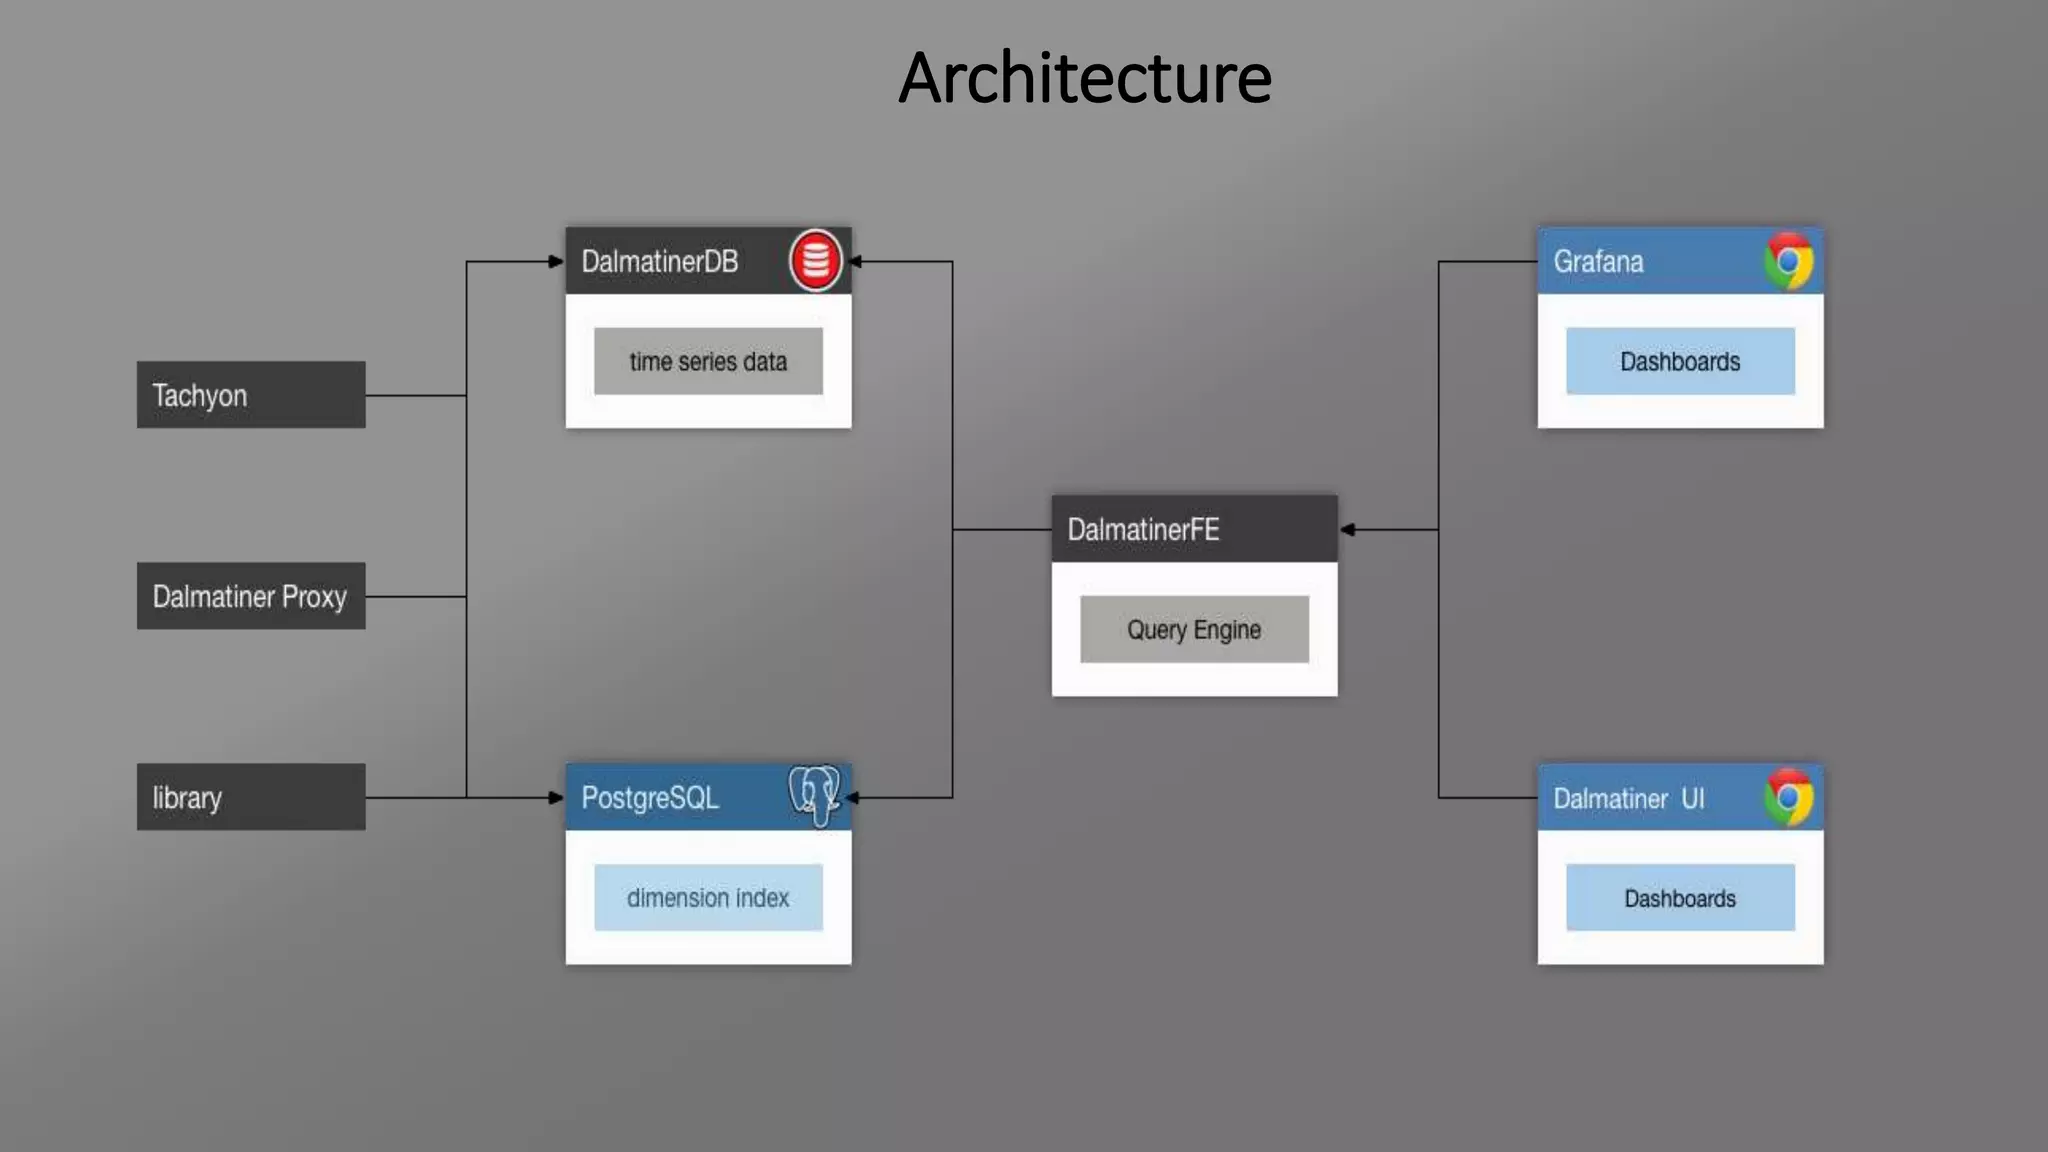
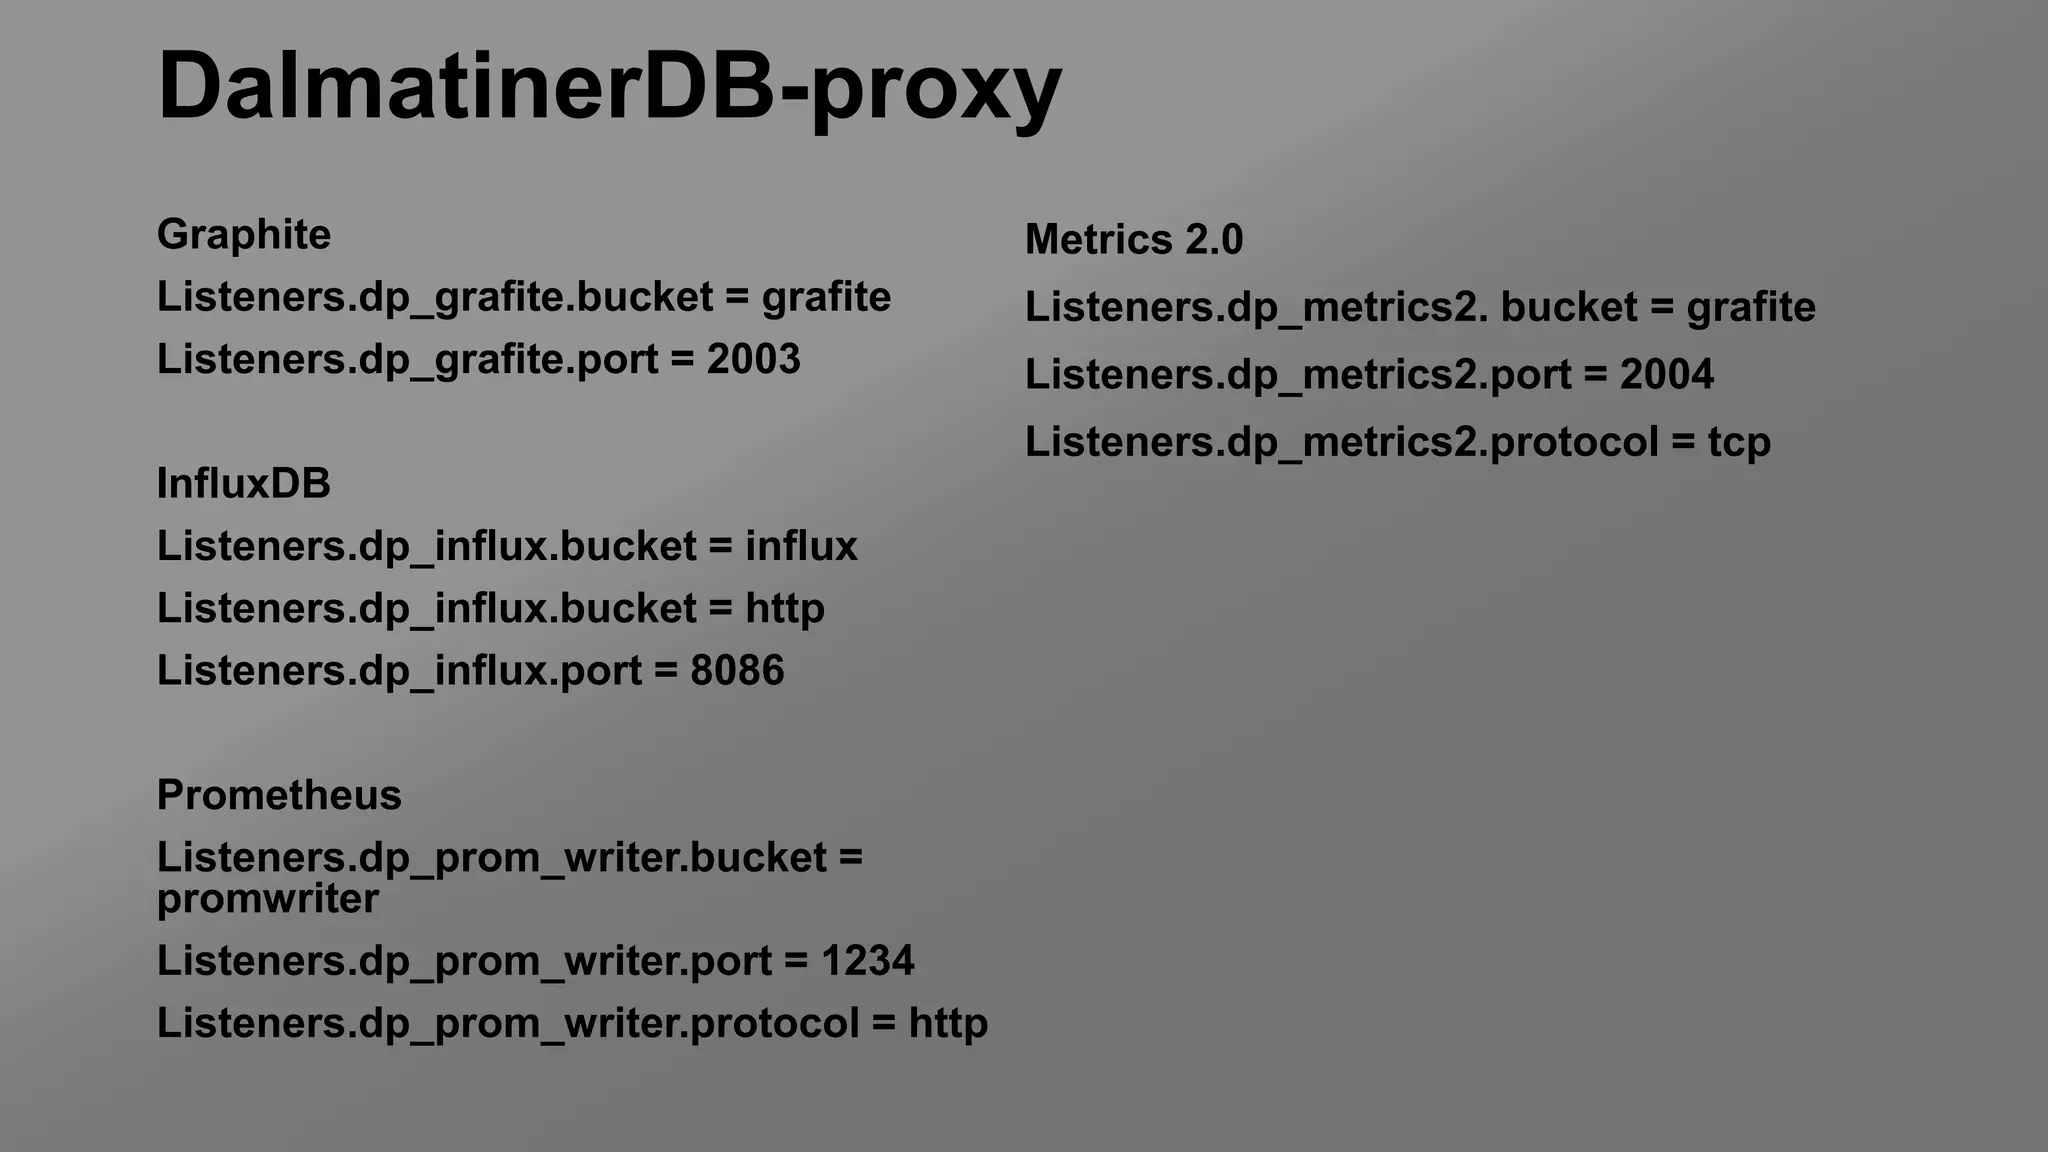
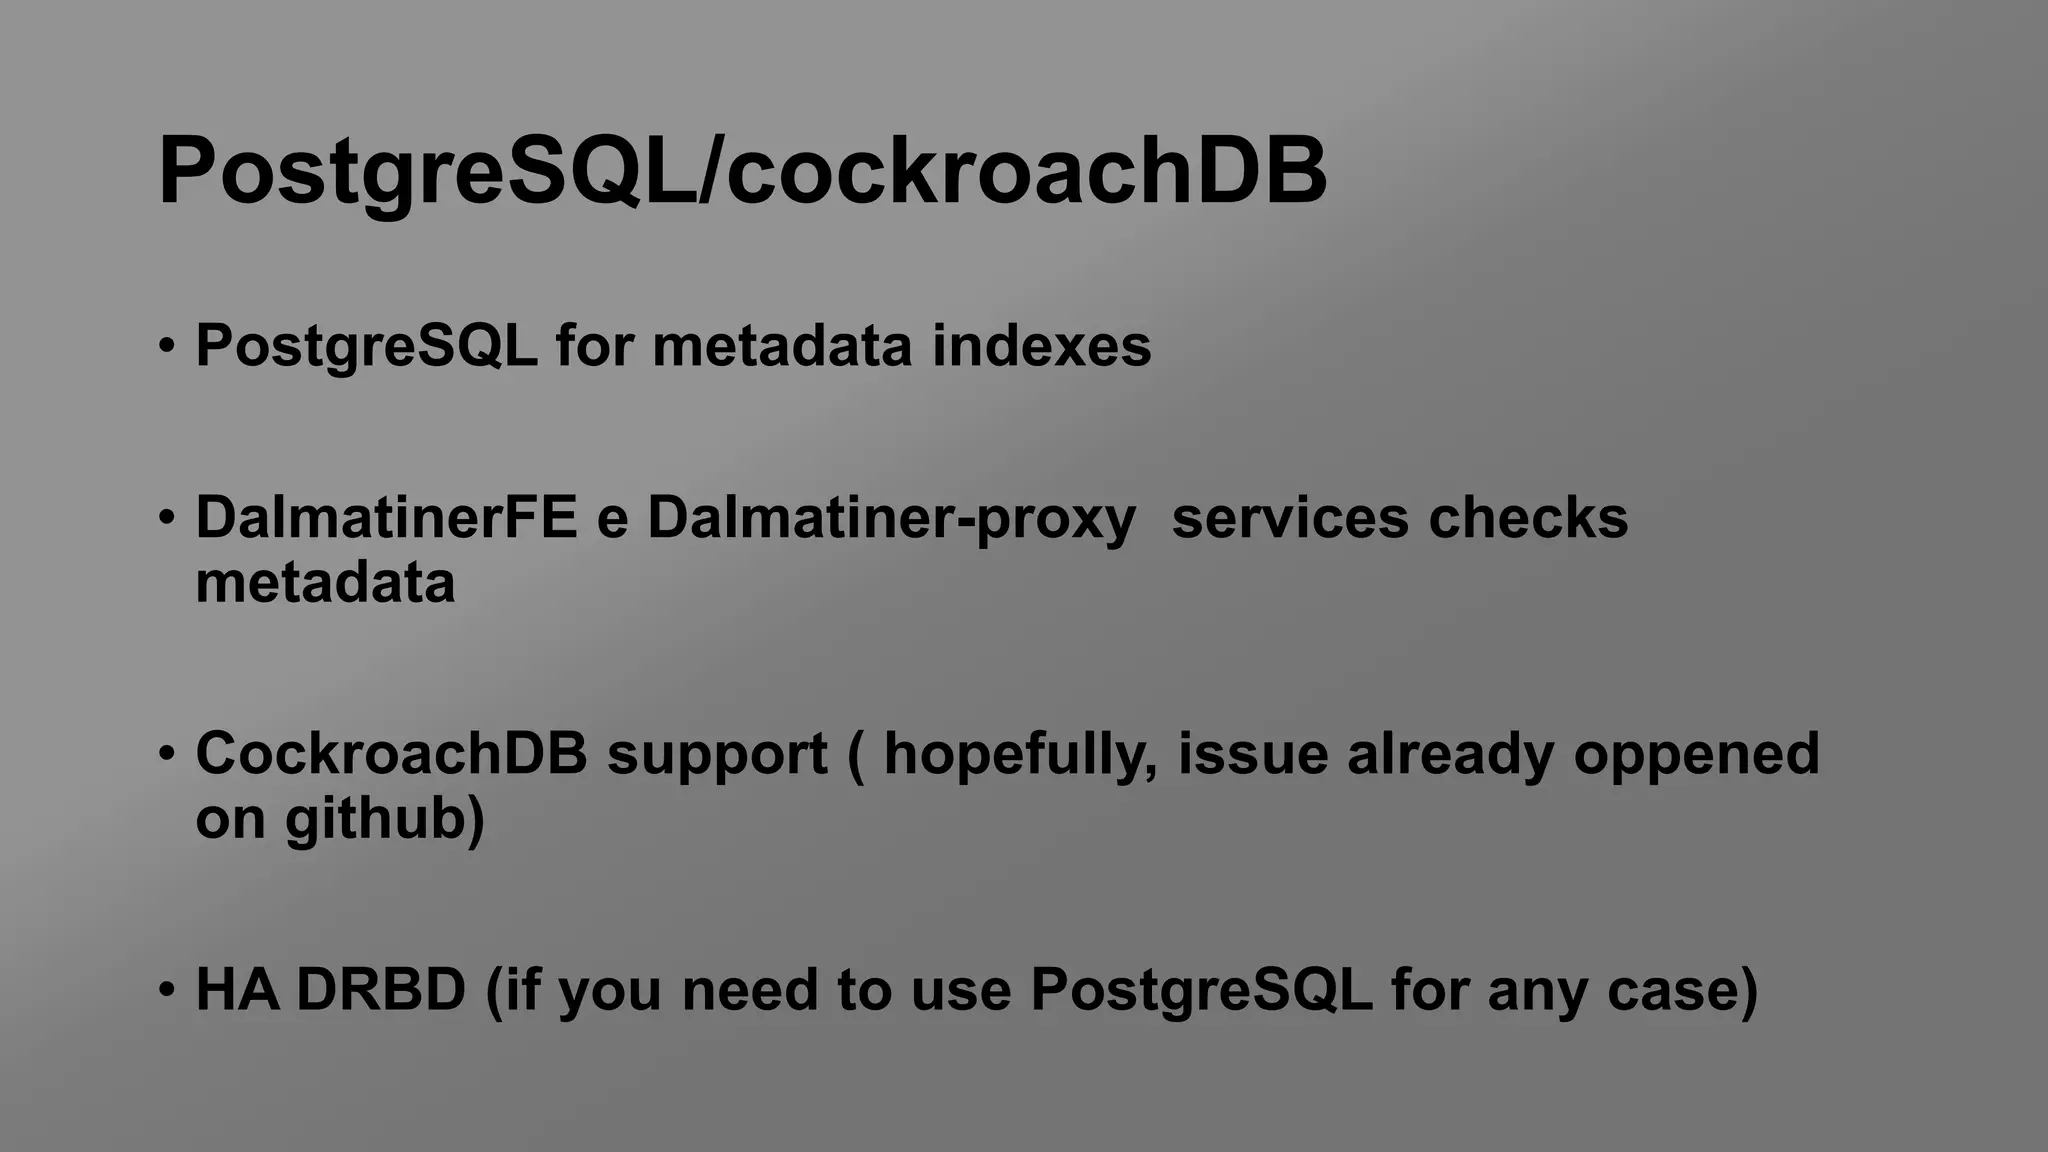
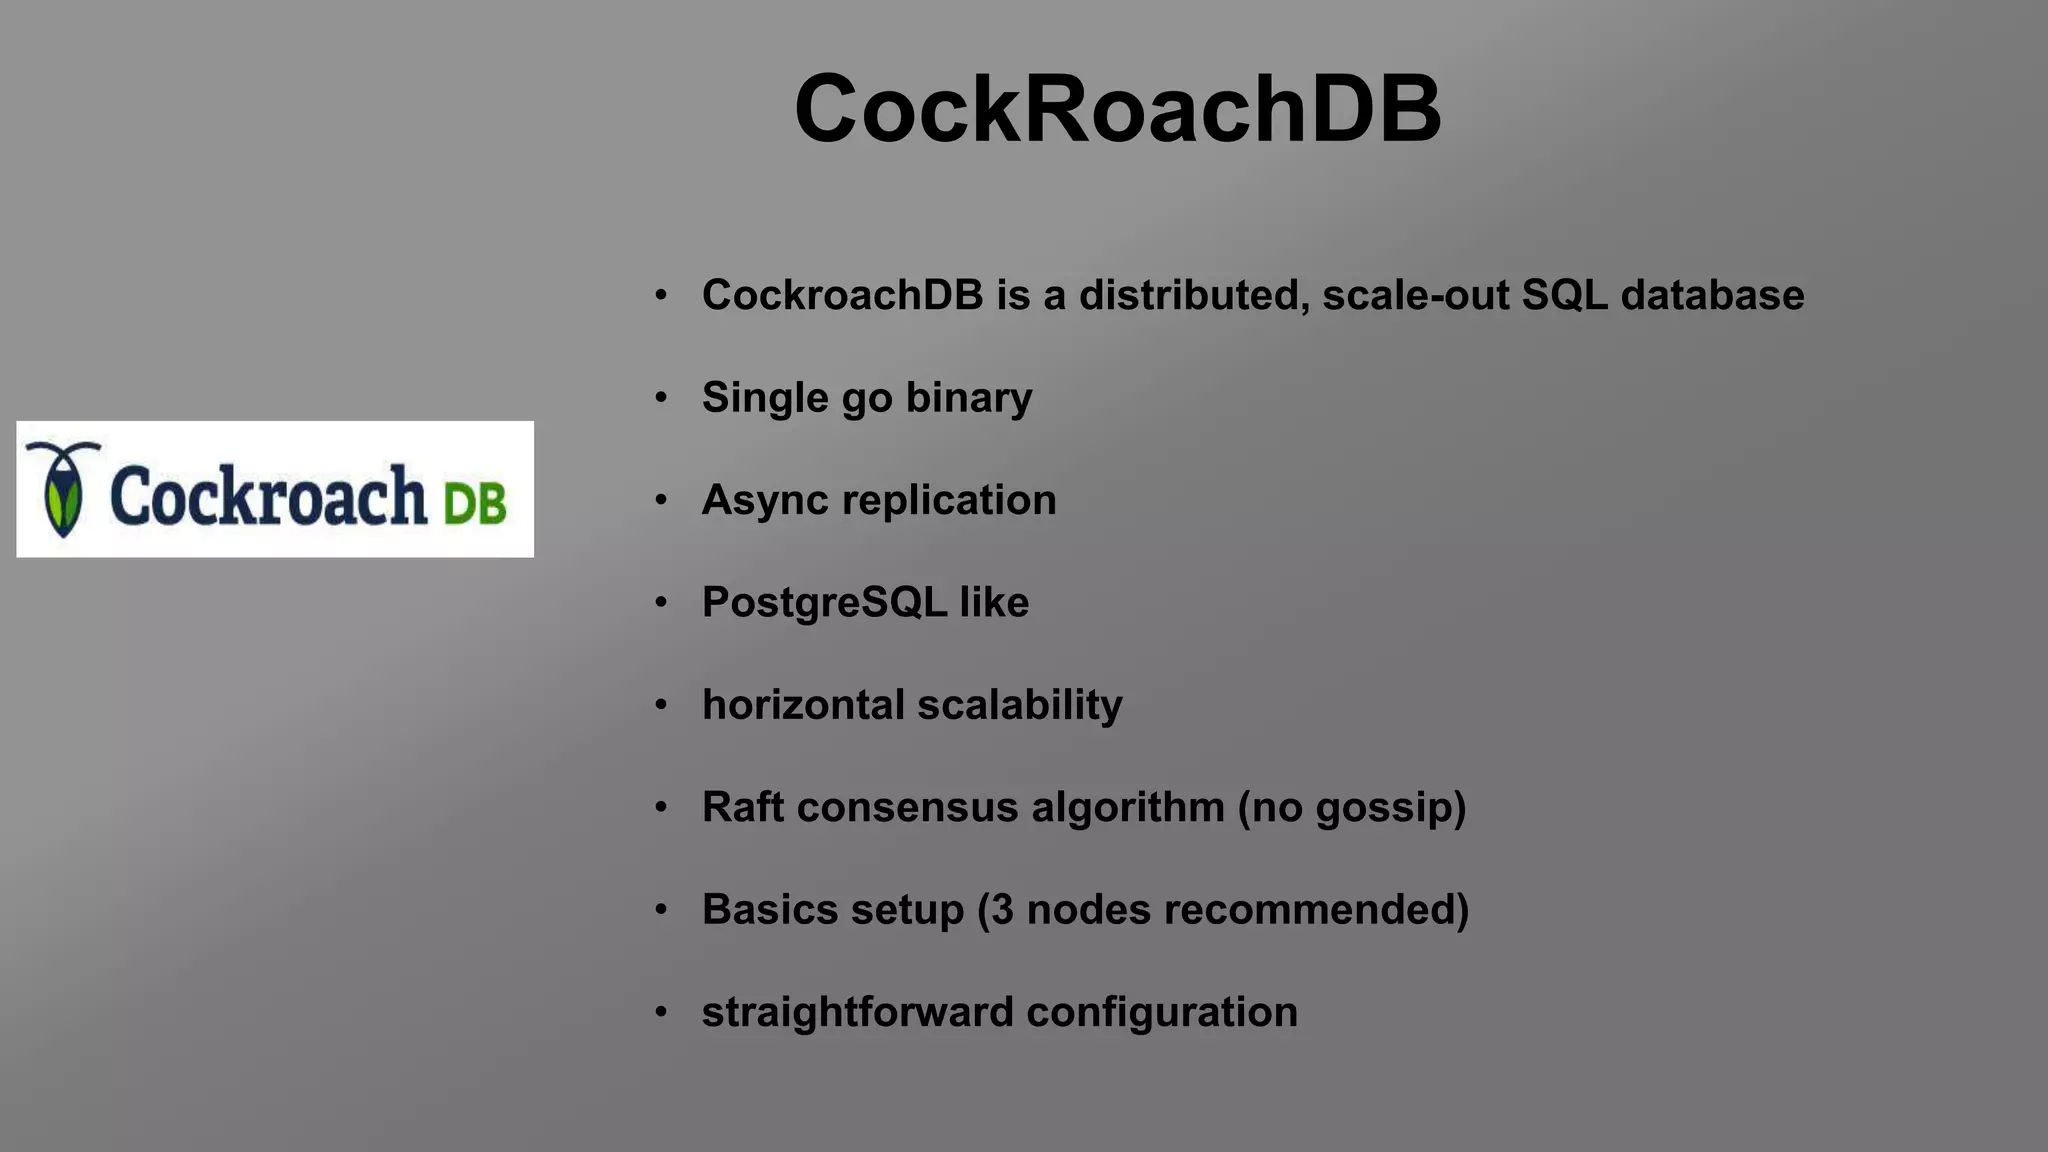
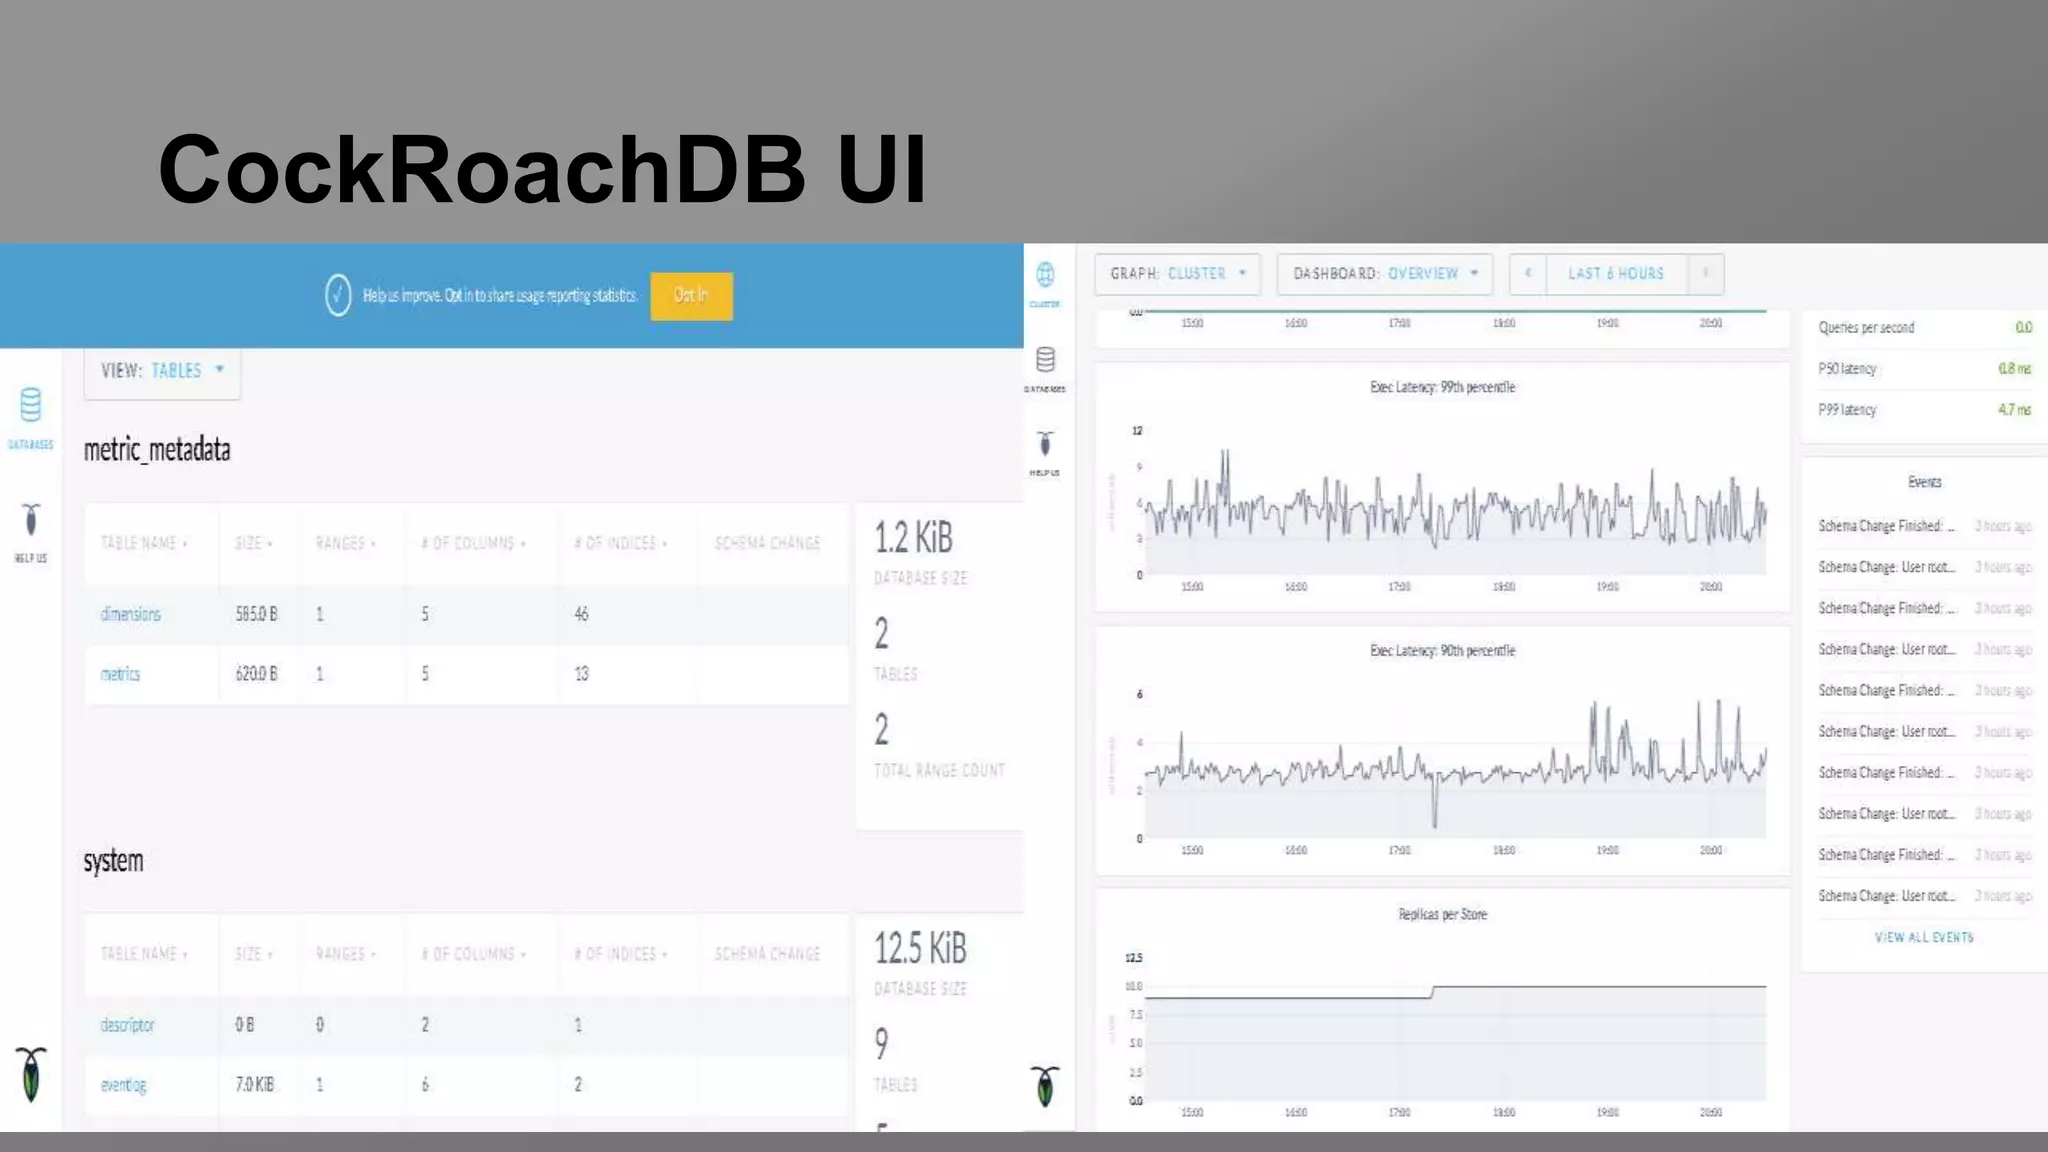
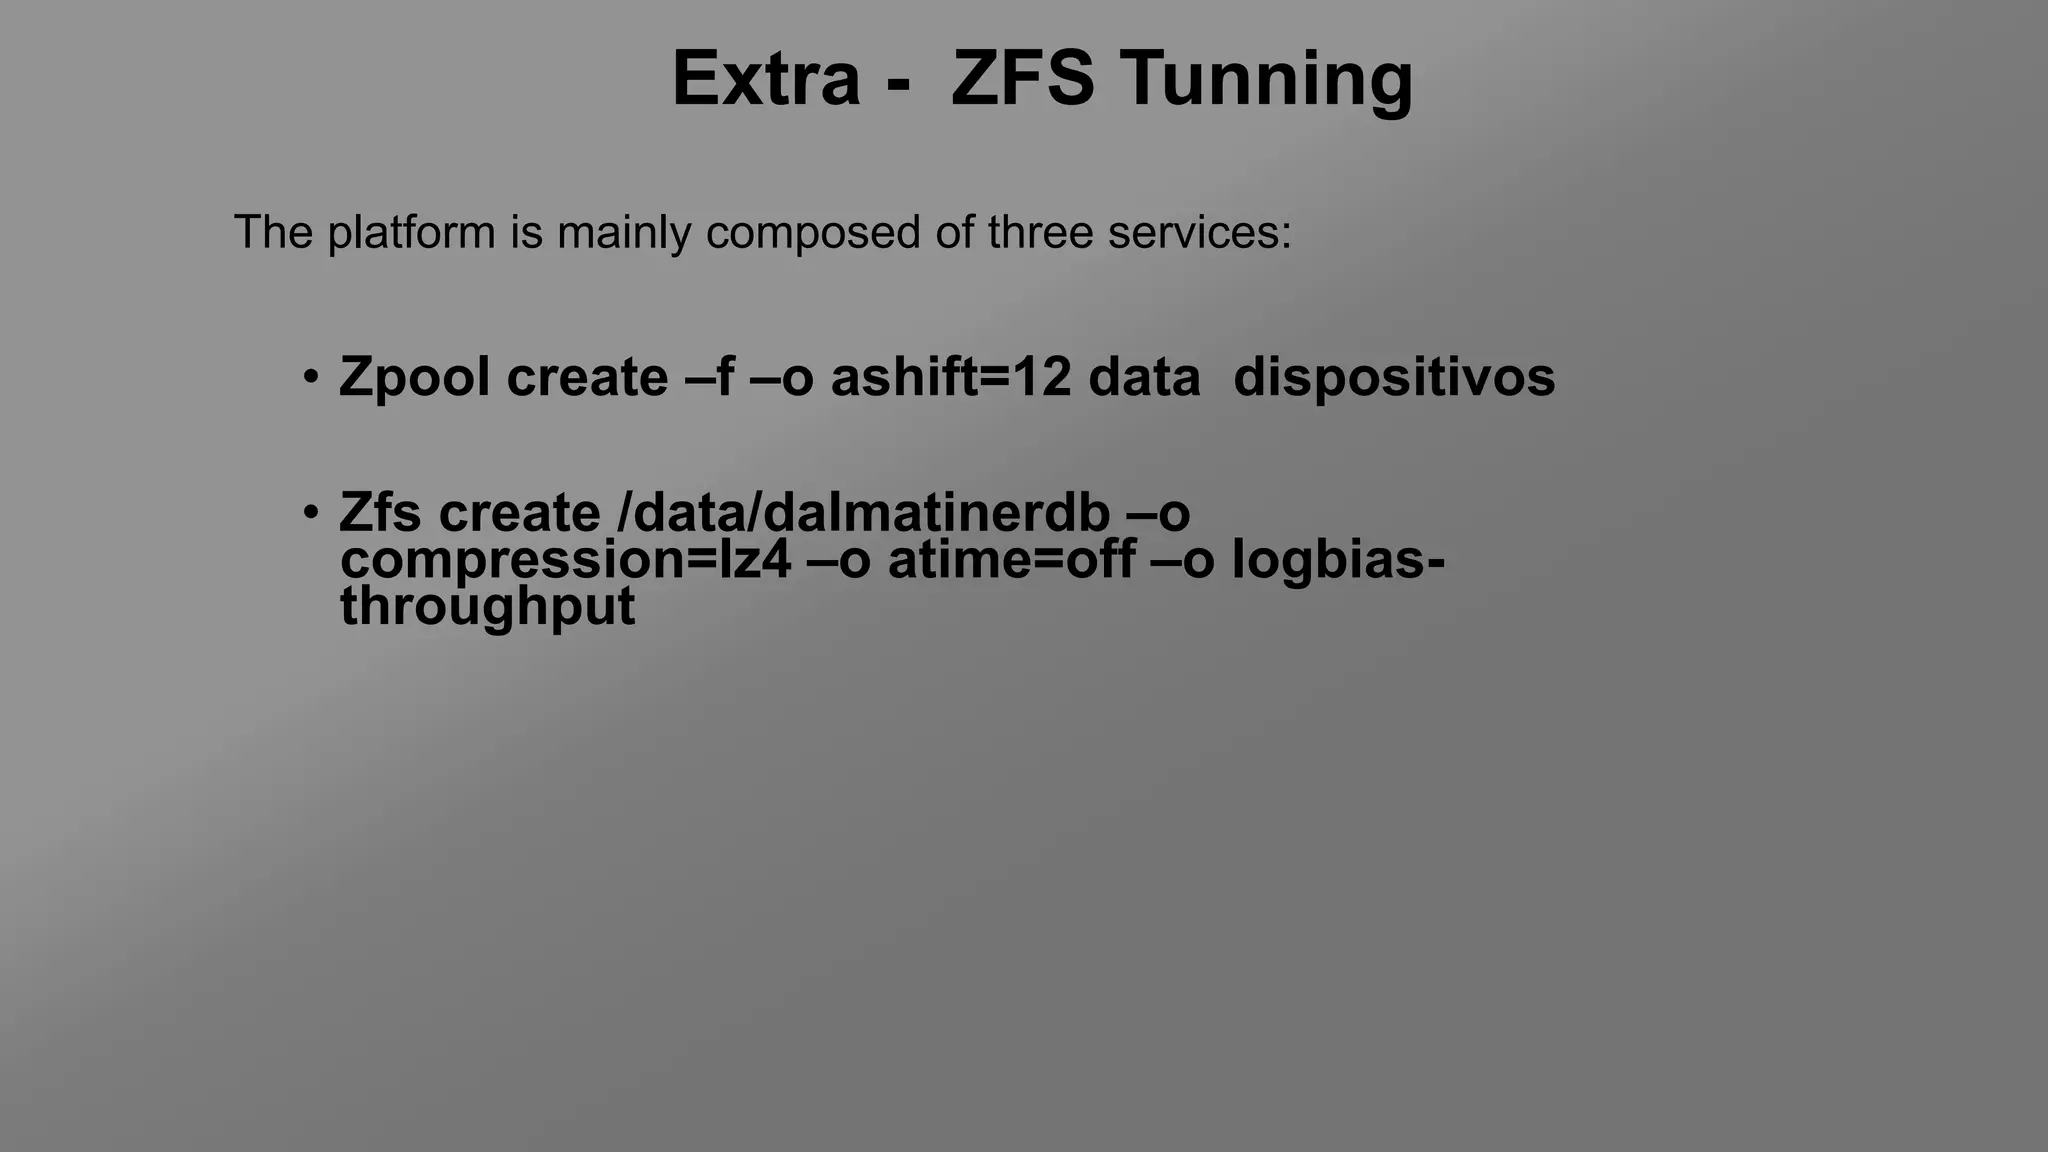
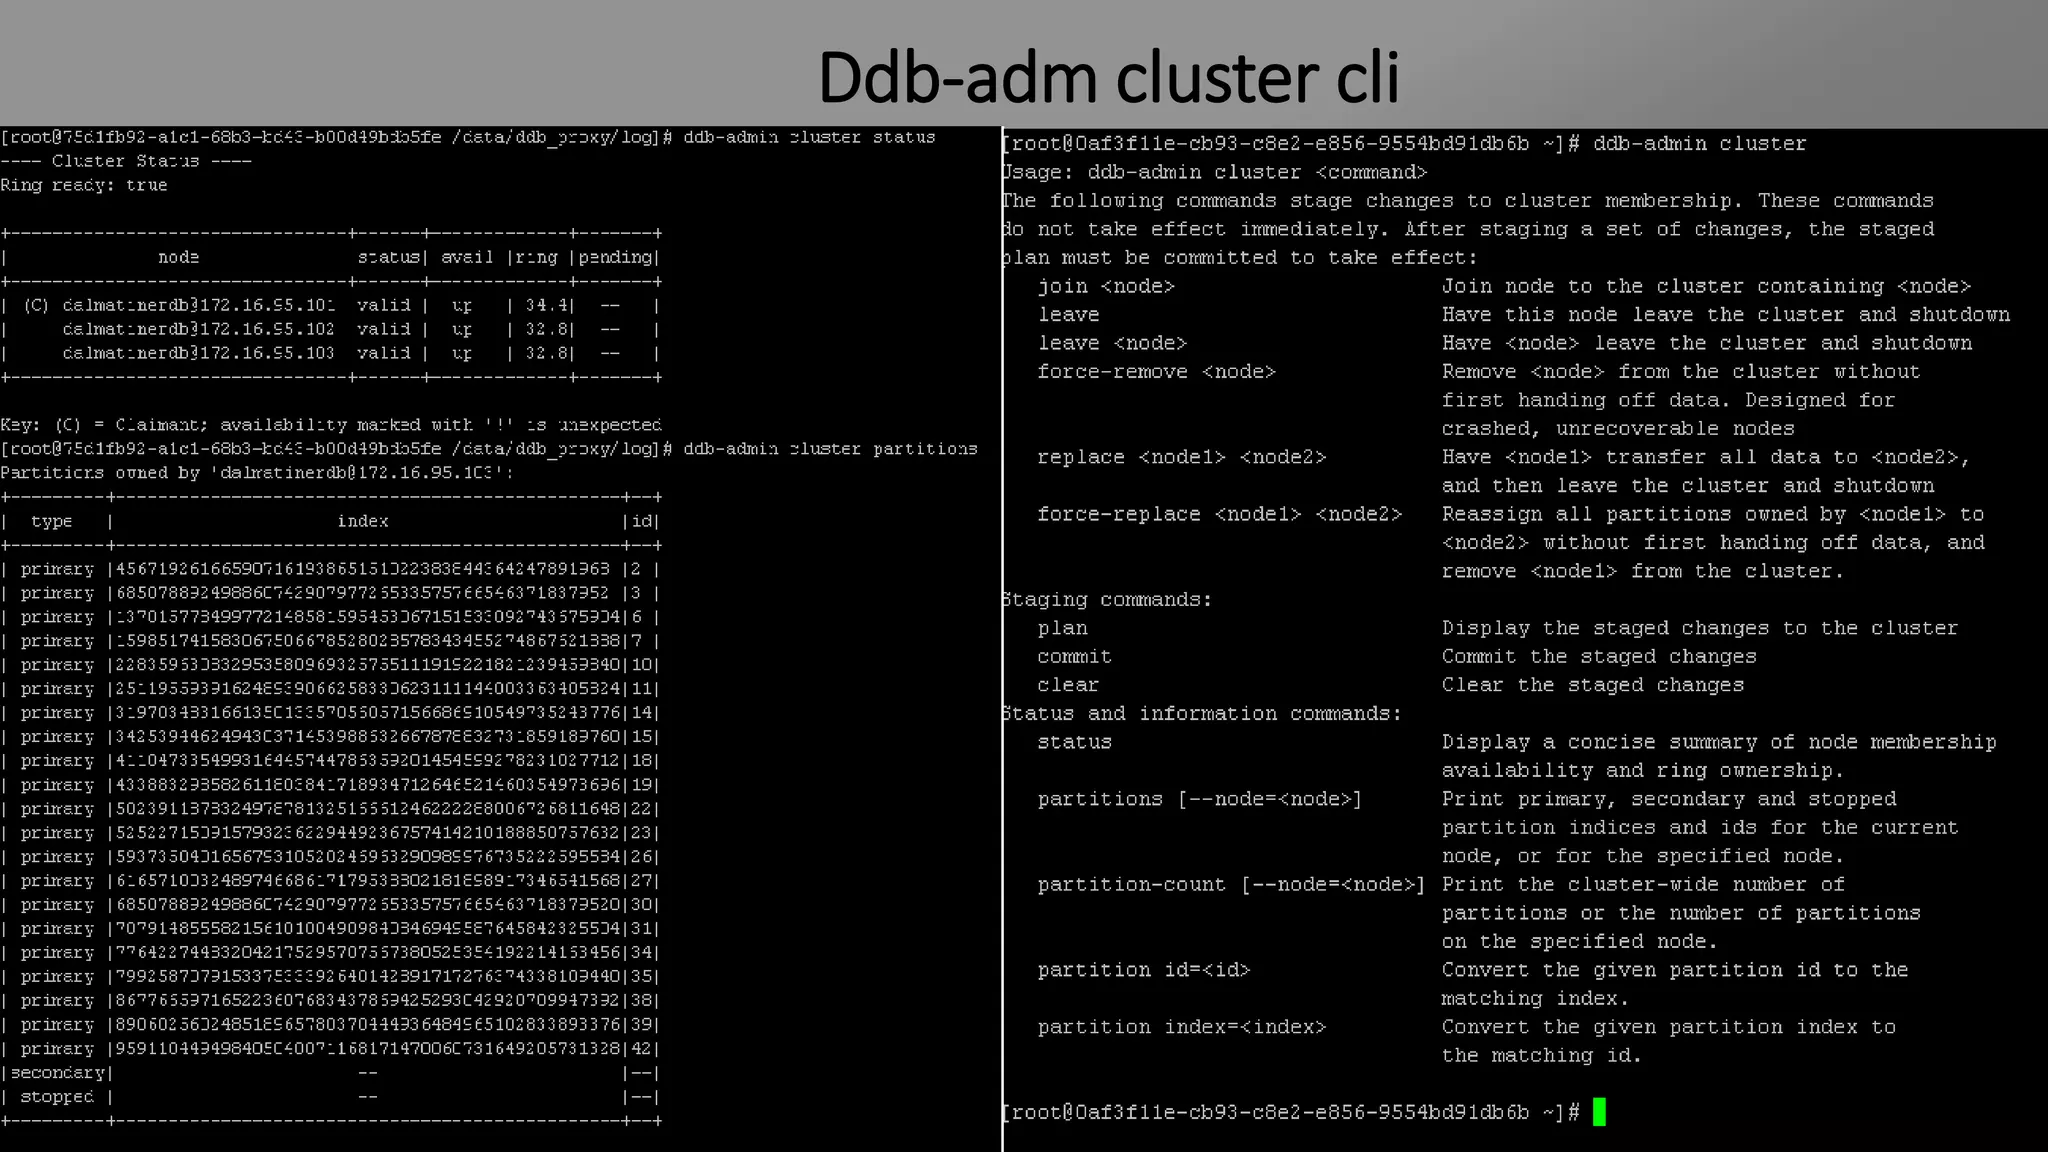
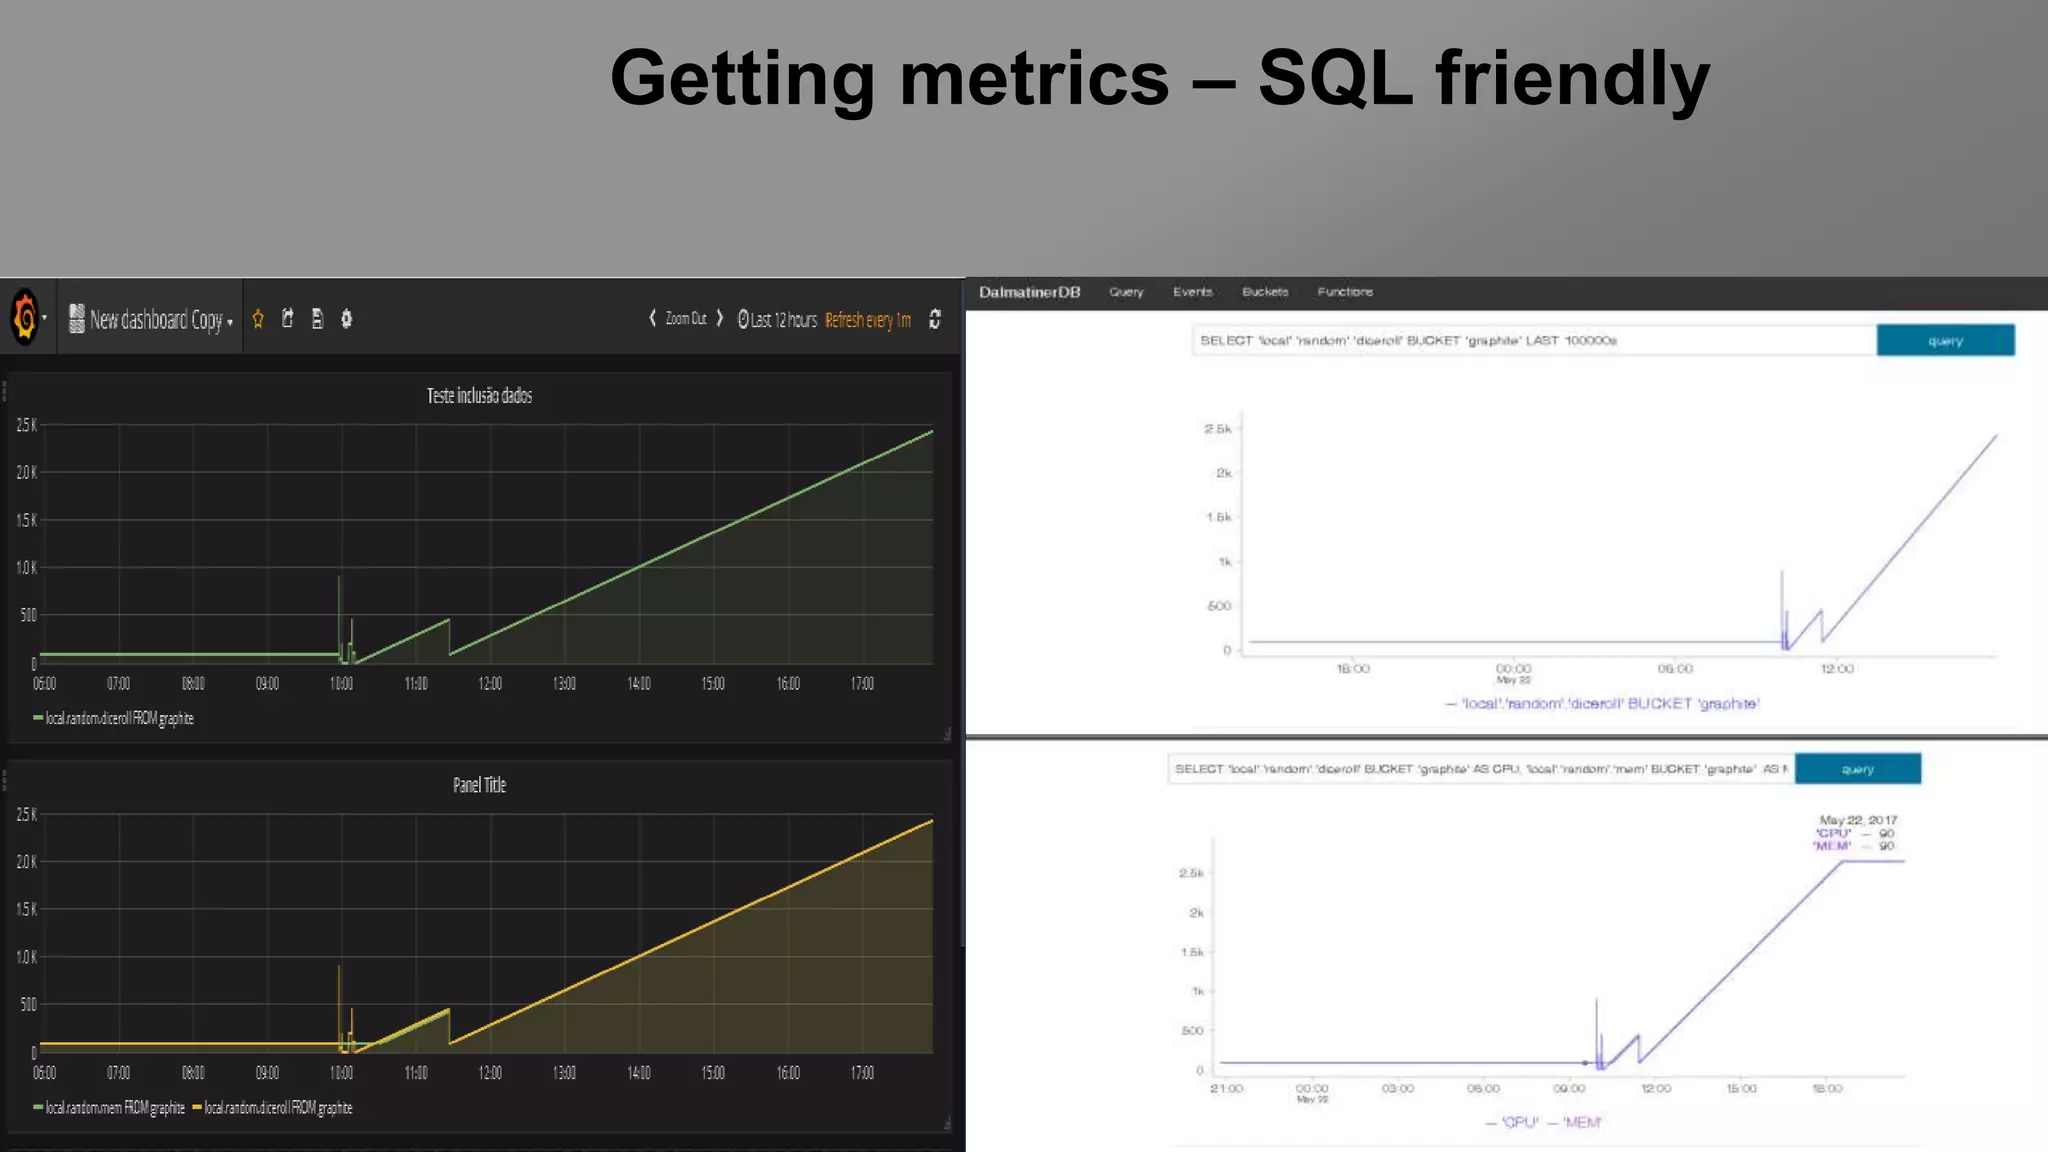
Monitoring solution
DalmatinerDB and
CockroachDB
DalmatinerDB Solution Overview
• Multiple Metrics formats available
• Redundancy
• Solution totally scalable
• High availability
• The fastest endpoint API in the market
• SQL friendly
• Deduplication/compression ZFS
• SmartOS/Solaris Zones based
• Zabbix,checkMK,sensu,prometheus
integration
Why not?
• Prometheus – federation still too complicated for metrics HA
(no cluster)
• OpenTSDB – depends on HDFS (nameservice sucks)
• InfluxDB– change product architecture every week
• KairosDB – depends on Cassandra which is not Time Series
Database and have some limitations.
SmartOS
• In-memory operating system and OpenSolaris
based
• Solaris zones (lxc-like)
• Pkgsrc package management from NetBSD
• Easy to upgrade
• ZFS (deduplication,compression,no data loss/corruption)
Creating Zones
The platform is mainly composed of three services:
• DalmatinerDB – Time Series Database based on Riak Core
• PostgresSQL/CockrouachDB - metric metadata
• DalmatinerFE – Service which provides API endpoint to user
query metrics.
• Dalmatiner-Proxy – Layer responsible for collecting data
sent from servers by different formats (InfluxDB, Graphite,
OpenTSDB, Prometheus, Metrics 2.0 e etc)
• Grafana (optional) – Dashboard for customized graphics
Components
Architecture
DalmatinerDB Concepts
• Each node in the cluster has a copy of this
ring. (Cassandra like)
• Each virtual node (or vnode) is a process
responsible for a given partition in the ring.
A node will host any number of vnodes,
depending on the size of the ring and the
number of nodes in the cluster.
• Buckets are nothing but namespaces with
configuration properties.
• Changes to the ring need to be propagated
throughout the cluster. This is what the
gossip protocol is for.
DalmatinerDB-proxy
Graphite
Listeners.dp_grafite.bucket = grafite
Listeners.dp_grafite.port = 2003
InfluxDB
Listeners.dp_influx.bucket = influx
Listeners.dp_influx.bucket = http
Listeners.dp_influx.port = 8086
Prometheus
Listeners.dp_prom_writer.bucket =
promwriter
Listeners.dp_prom_writer.port = 1234
Listeners.dp_prom_writer.protocol = http
Metrics 2.0
Listeners.dp_metrics2. bucket = grafite
Listeners.dp_metrics2.port = 2004
Listeners.dp_metrics2.protocol = tcp
PostgreSQL/cockroachDB
• PostgreSQL for metadata indexes
• DalmatinerFE e Dalmatiner-proxy services checks
metadata
• CockroachDB support ( hopefully, issue already oppened
on github)
• HA DRBD (if you need to use PostgreSQL for any case)
CockRoachDB
• CockroachDB is a distributed, scale-out SQL database
• Single go binary
• Async replication
• PostgreSQL like
• horizontal scalability
• Raft consensus algorithm (no gossip)
• Basics setup (3 nodes recommended)
• straightforward configuration
CockRoachDB UI
Sending Data
• Collectd/statsd
• Sensu Handler available for every protocols (grafite, influxDB etc)
• Using Graphios to import perfdata files
• Netcat/curl for testing purposes
The platform is mainly composed of three services:
• Zpool create –f –o ashift=12 data dispositivos
• Zfs create /data/dalmatinerdb –o
compression=lz4 –o atime=off –o logbias-
throughput
Extra - ZFS Tunning
Ddb-adm cluster cli
Getting metrics – SQL friendly
Thank you!
Questions?
More information:
Linkedin
https://www.linkedin.com/in/leandro-totino-pereira-06726227
Facebook:
https://www.facebook.com/leandro.totinopereira

DalmatinerDB and cockroachDB monitoring plataform

  • 1.
  • 2.
    DalmatinerDB Solution Overview •Multiple Metrics formats available • Redundancy • Solution totally scalable • High availability • The fastest endpoint API in the market • SQL friendly • Deduplication/compression ZFS • SmartOS/Solaris Zones based • Zabbix,checkMK,sensu,prometheus integration
  • 3.
    Why not? • Prometheus– federation still too complicated for metrics HA (no cluster) • OpenTSDB – depends on HDFS (nameservice sucks) • InfluxDB– change product architecture every week • KairosDB – depends on Cassandra which is not Time Series Database and have some limitations.
  • 4.
    SmartOS • In-memory operatingsystem and OpenSolaris based • Solaris zones (lxc-like) • Pkgsrc package management from NetBSD • Easy to upgrade • ZFS (deduplication,compression,no data loss/corruption)
  • 5.
  • 6.
    The platform ismainly composed of three services: • DalmatinerDB – Time Series Database based on Riak Core • PostgresSQL/CockrouachDB - metric metadata • DalmatinerFE – Service which provides API endpoint to user query metrics. • Dalmatiner-Proxy – Layer responsible for collecting data sent from servers by different formats (InfluxDB, Graphite, OpenTSDB, Prometheus, Metrics 2.0 e etc) • Grafana (optional) – Dashboard for customized graphics Components
  • 7.
  • 8.
    DalmatinerDB Concepts • Eachnode in the cluster has a copy of this ring. (Cassandra like) • Each virtual node (or vnode) is a process responsible for a given partition in the ring. A node will host any number of vnodes, depending on the size of the ring and the number of nodes in the cluster. • Buckets are nothing but namespaces with configuration properties. • Changes to the ring need to be propagated throughout the cluster. This is what the gossip protocol is for.
  • 9.
    DalmatinerDB-proxy Graphite Listeners.dp_grafite.bucket = grafite Listeners.dp_grafite.port= 2003 InfluxDB Listeners.dp_influx.bucket = influx Listeners.dp_influx.bucket = http Listeners.dp_influx.port = 8086 Prometheus Listeners.dp_prom_writer.bucket = promwriter Listeners.dp_prom_writer.port = 1234 Listeners.dp_prom_writer.protocol = http Metrics 2.0 Listeners.dp_metrics2. bucket = grafite Listeners.dp_metrics2.port = 2004 Listeners.dp_metrics2.protocol = tcp
  • 10.
    PostgreSQL/cockroachDB • PostgreSQL formetadata indexes • DalmatinerFE e Dalmatiner-proxy services checks metadata • CockroachDB support ( hopefully, issue already oppened on github) • HA DRBD (if you need to use PostgreSQL for any case)
  • 11.
    CockRoachDB • CockroachDB isa distributed, scale-out SQL database • Single go binary • Async replication • PostgreSQL like • horizontal scalability • Raft consensus algorithm (no gossip) • Basics setup (3 nodes recommended) • straightforward configuration
  • 12.
  • 13.
    Sending Data • Collectd/statsd •Sensu Handler available for every protocols (grafite, influxDB etc) • Using Graphios to import perfdata files • Netcat/curl for testing purposes
  • 14.
    The platform ismainly composed of three services: • Zpool create –f –o ashift=12 data dispositivos • Zfs create /data/dalmatinerdb –o compression=lz4 –o atime=off –o logbias- throughput Extra - ZFS Tunning
  • 15.
  • 16.
    Getting metrics –SQL friendly
  • 17.