Downloaded 2,015 times
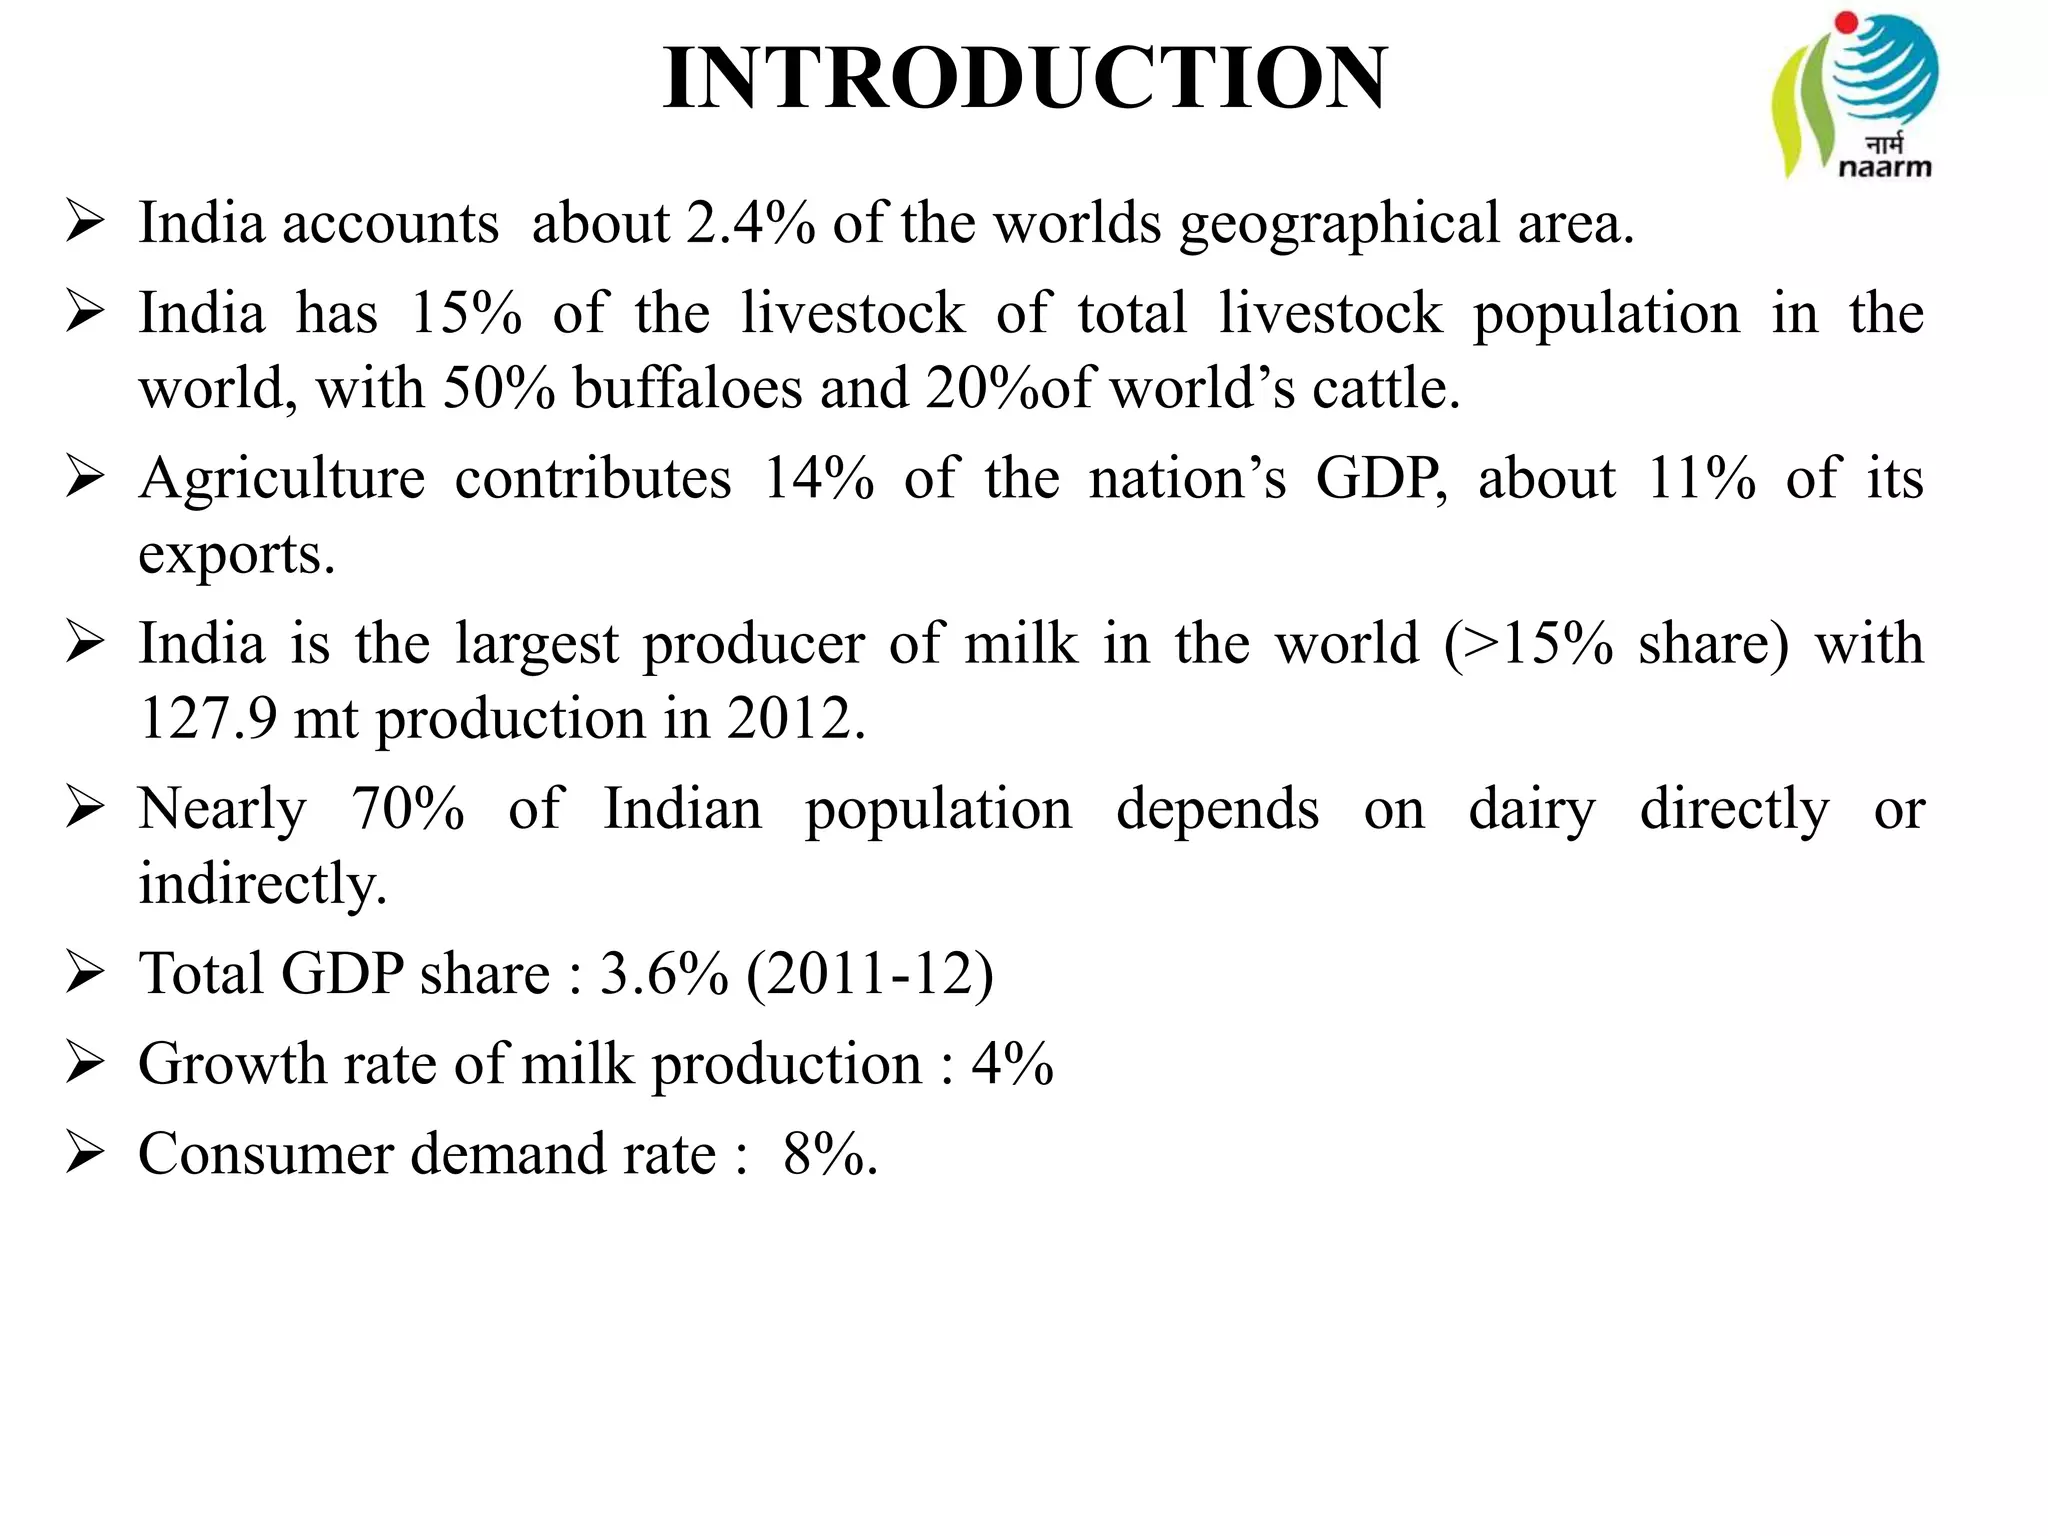
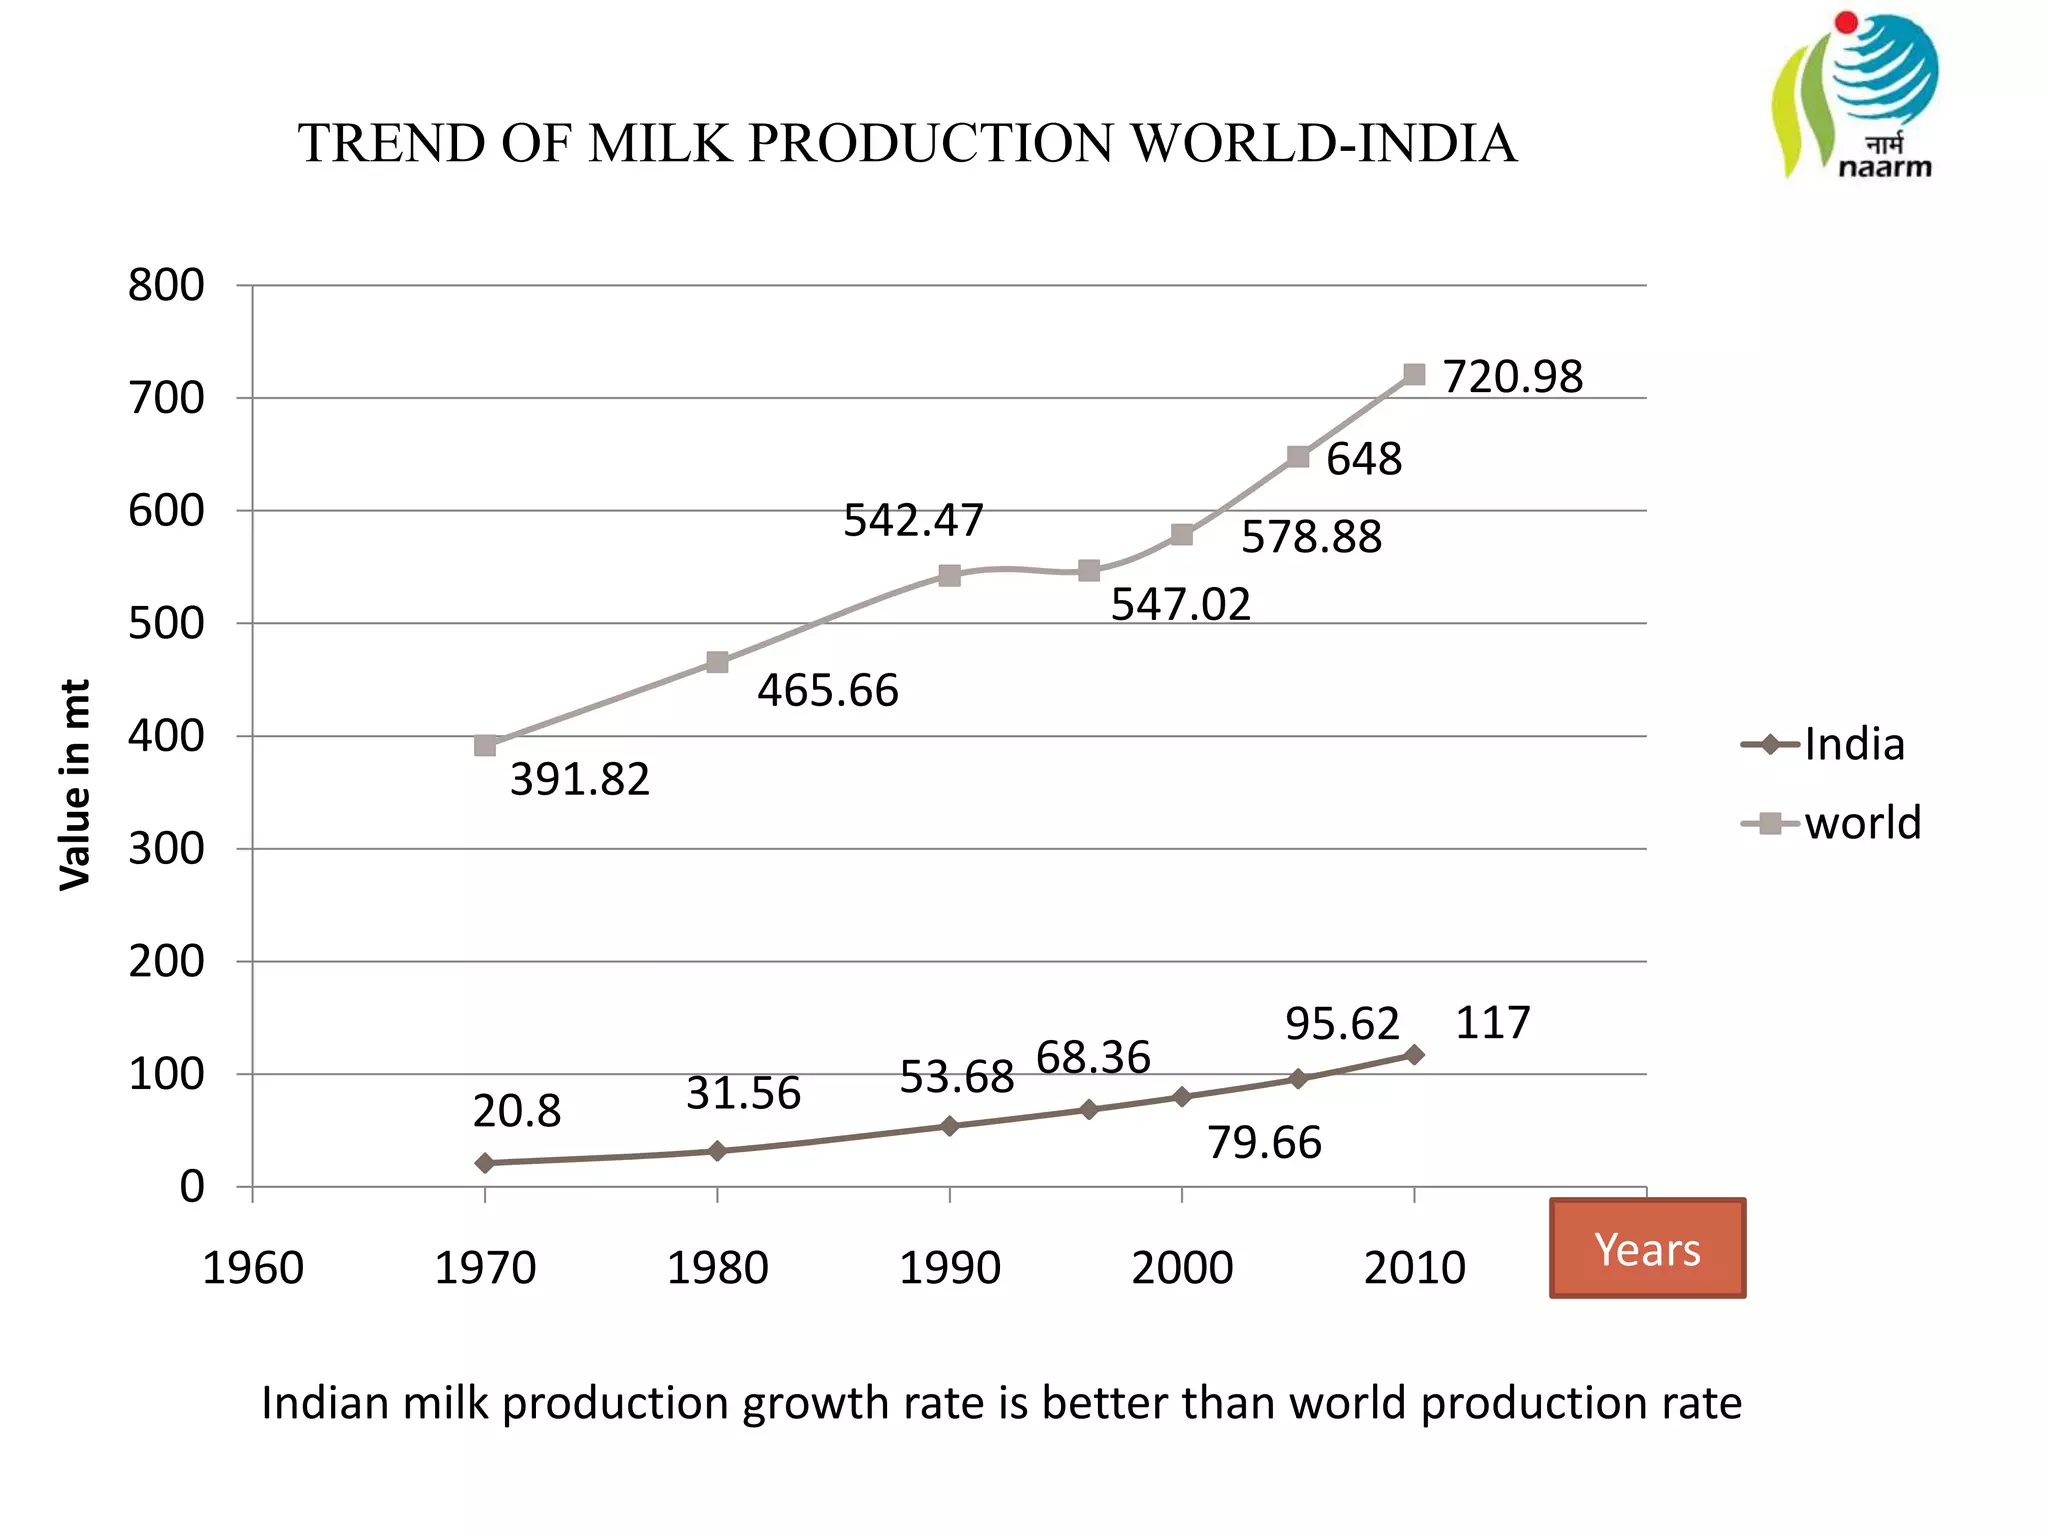
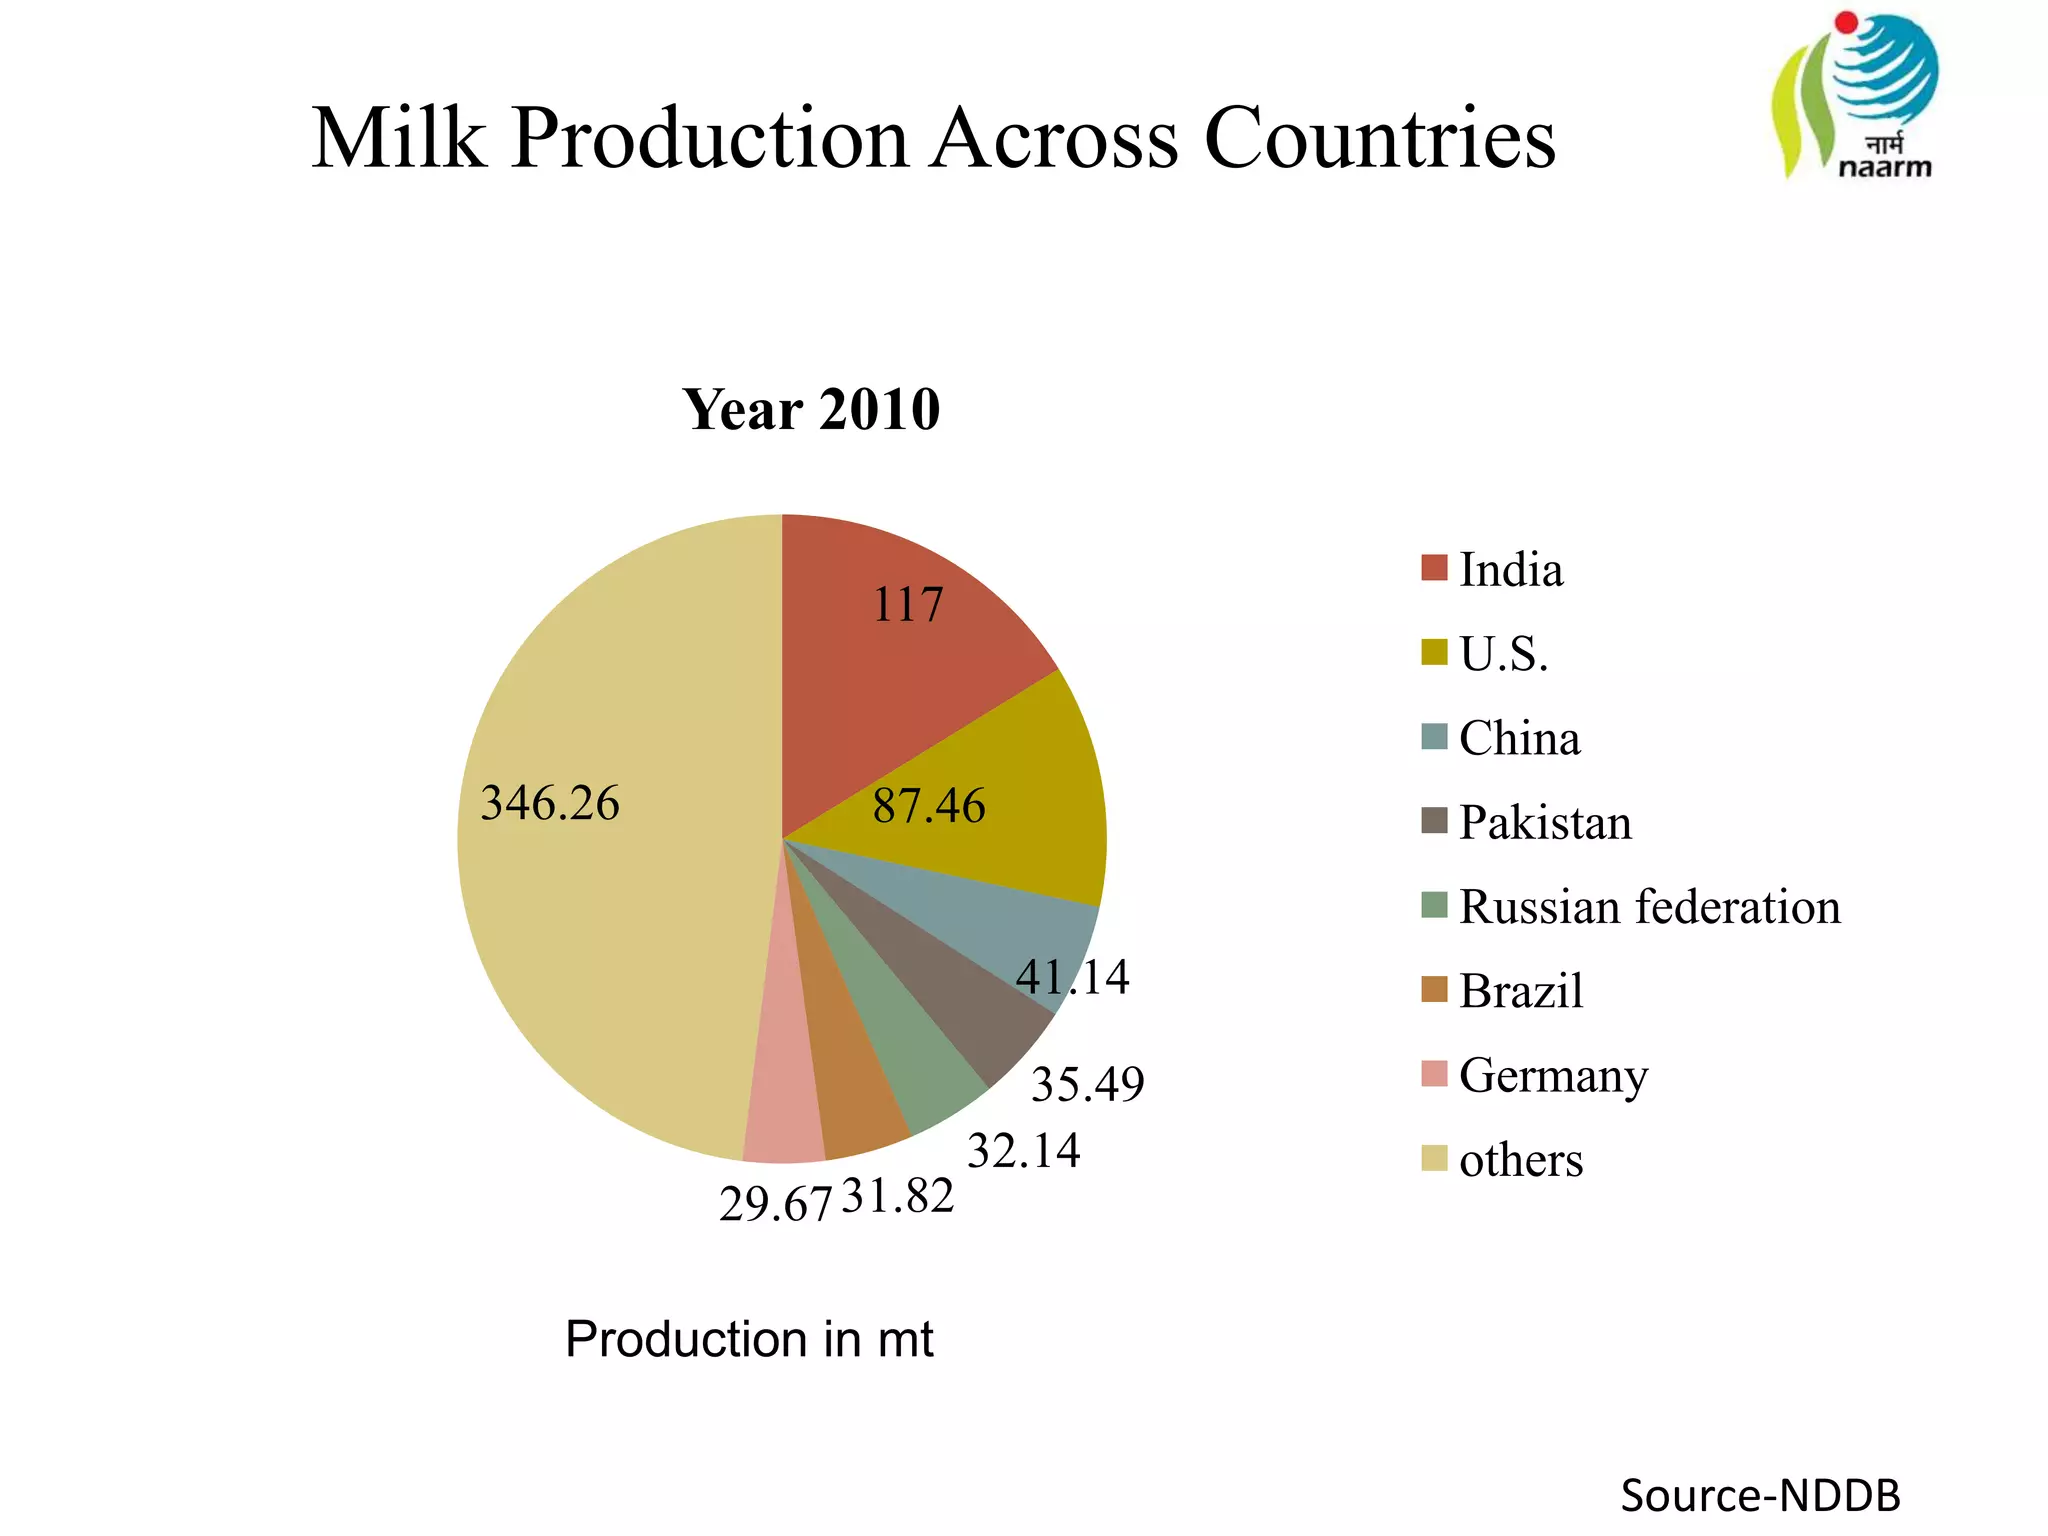
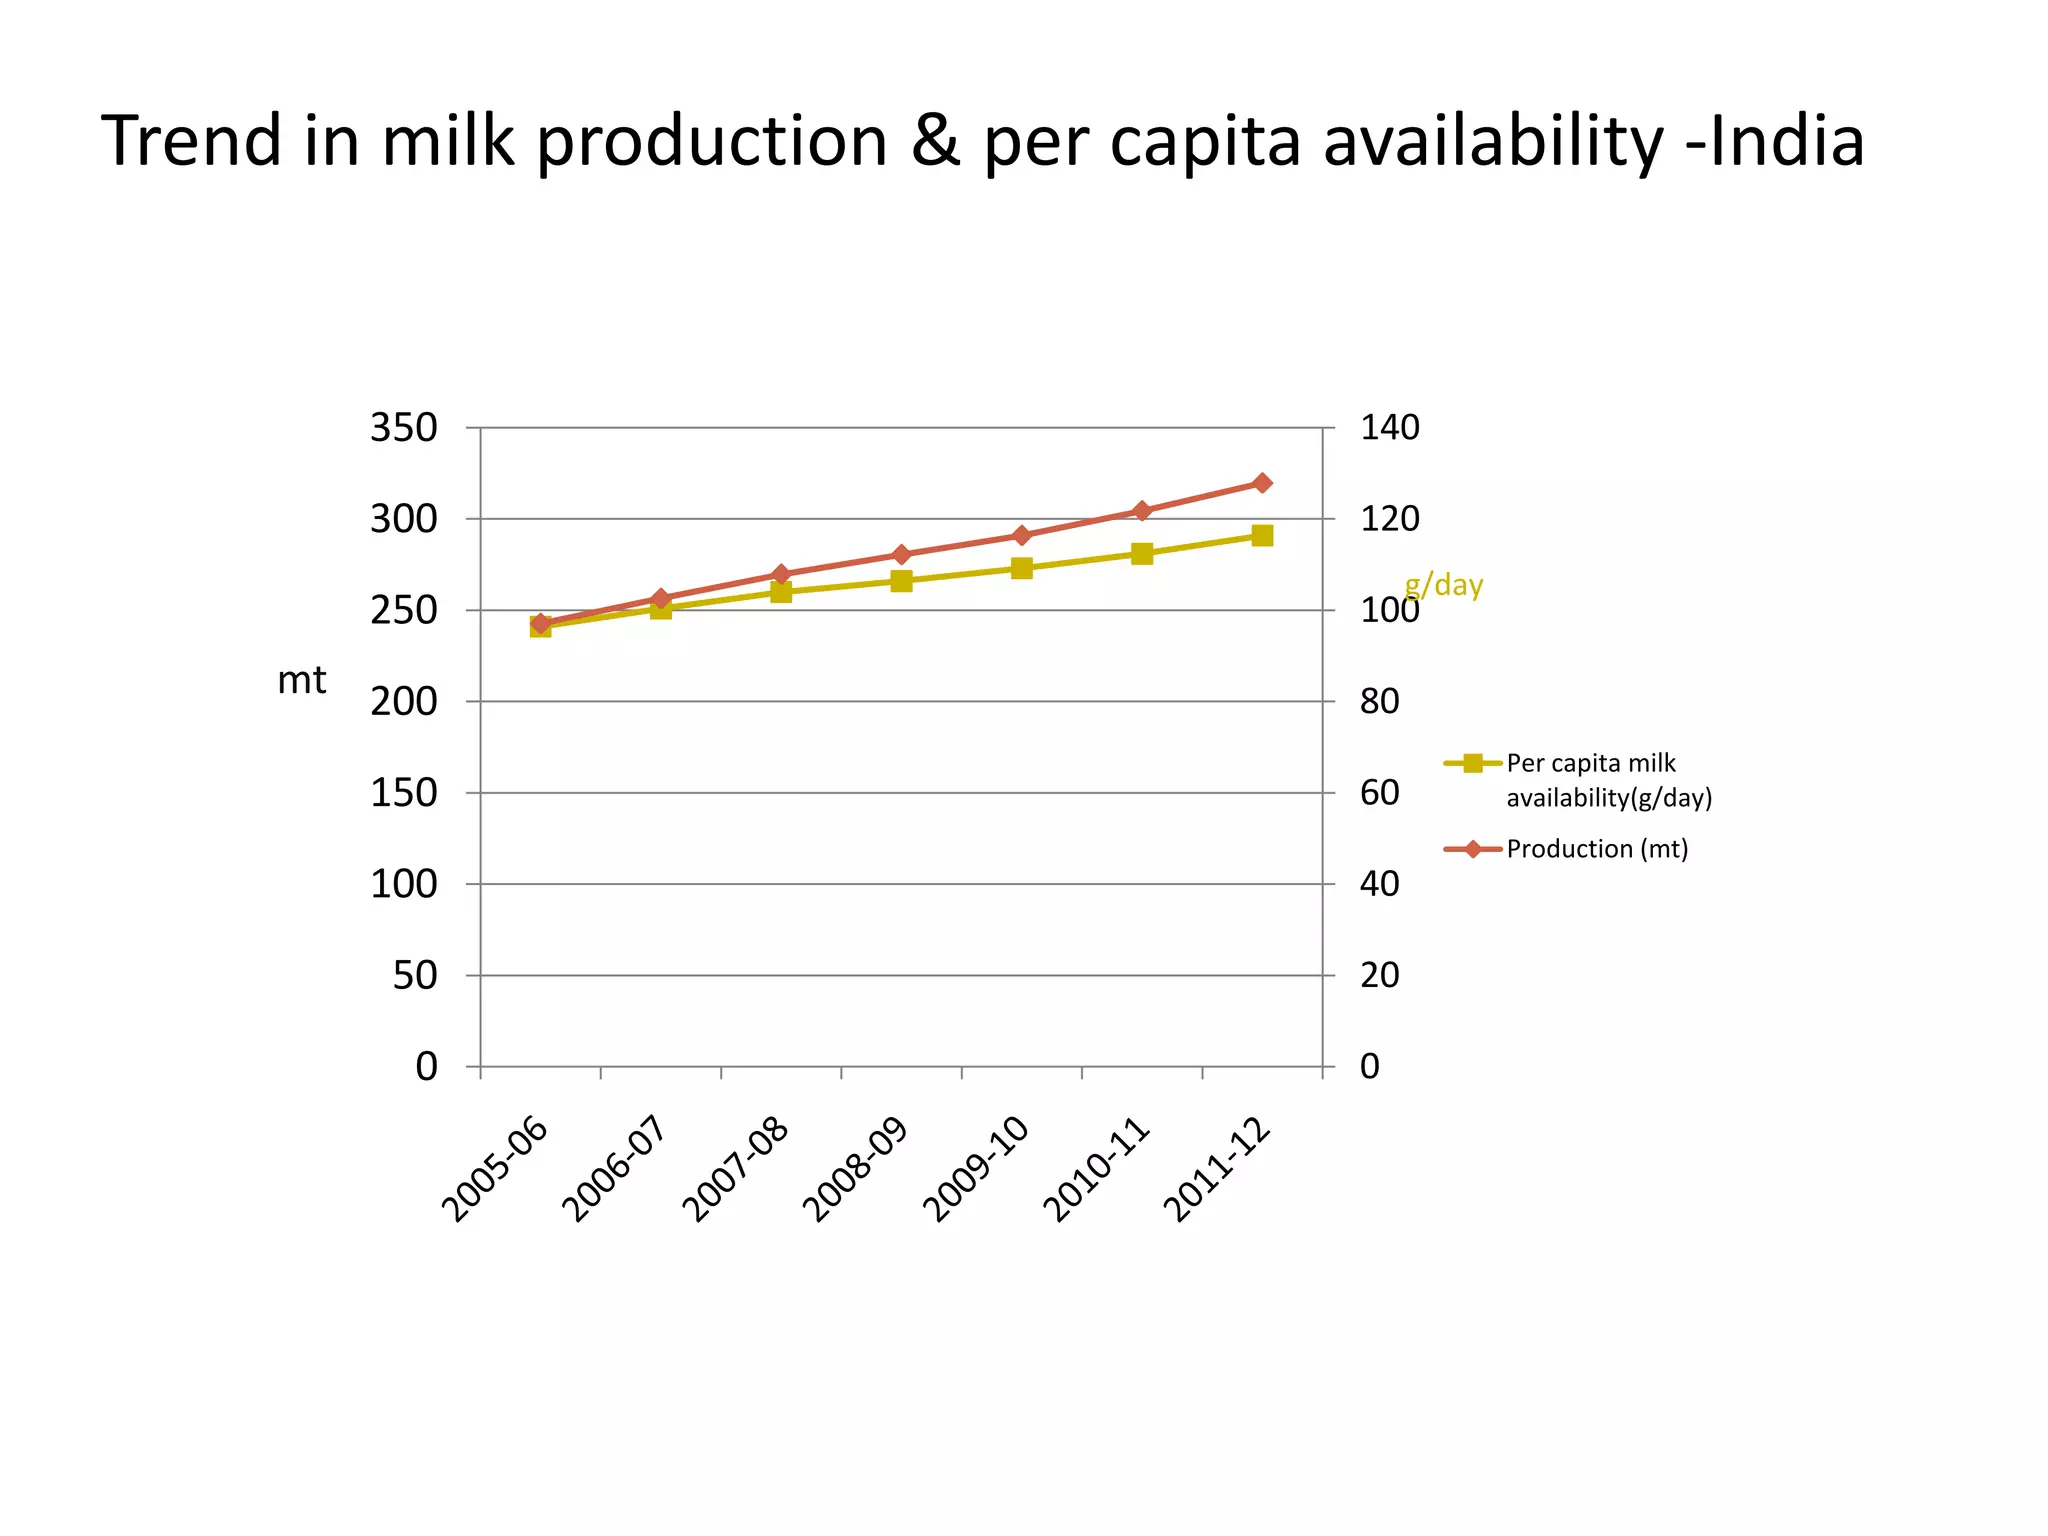
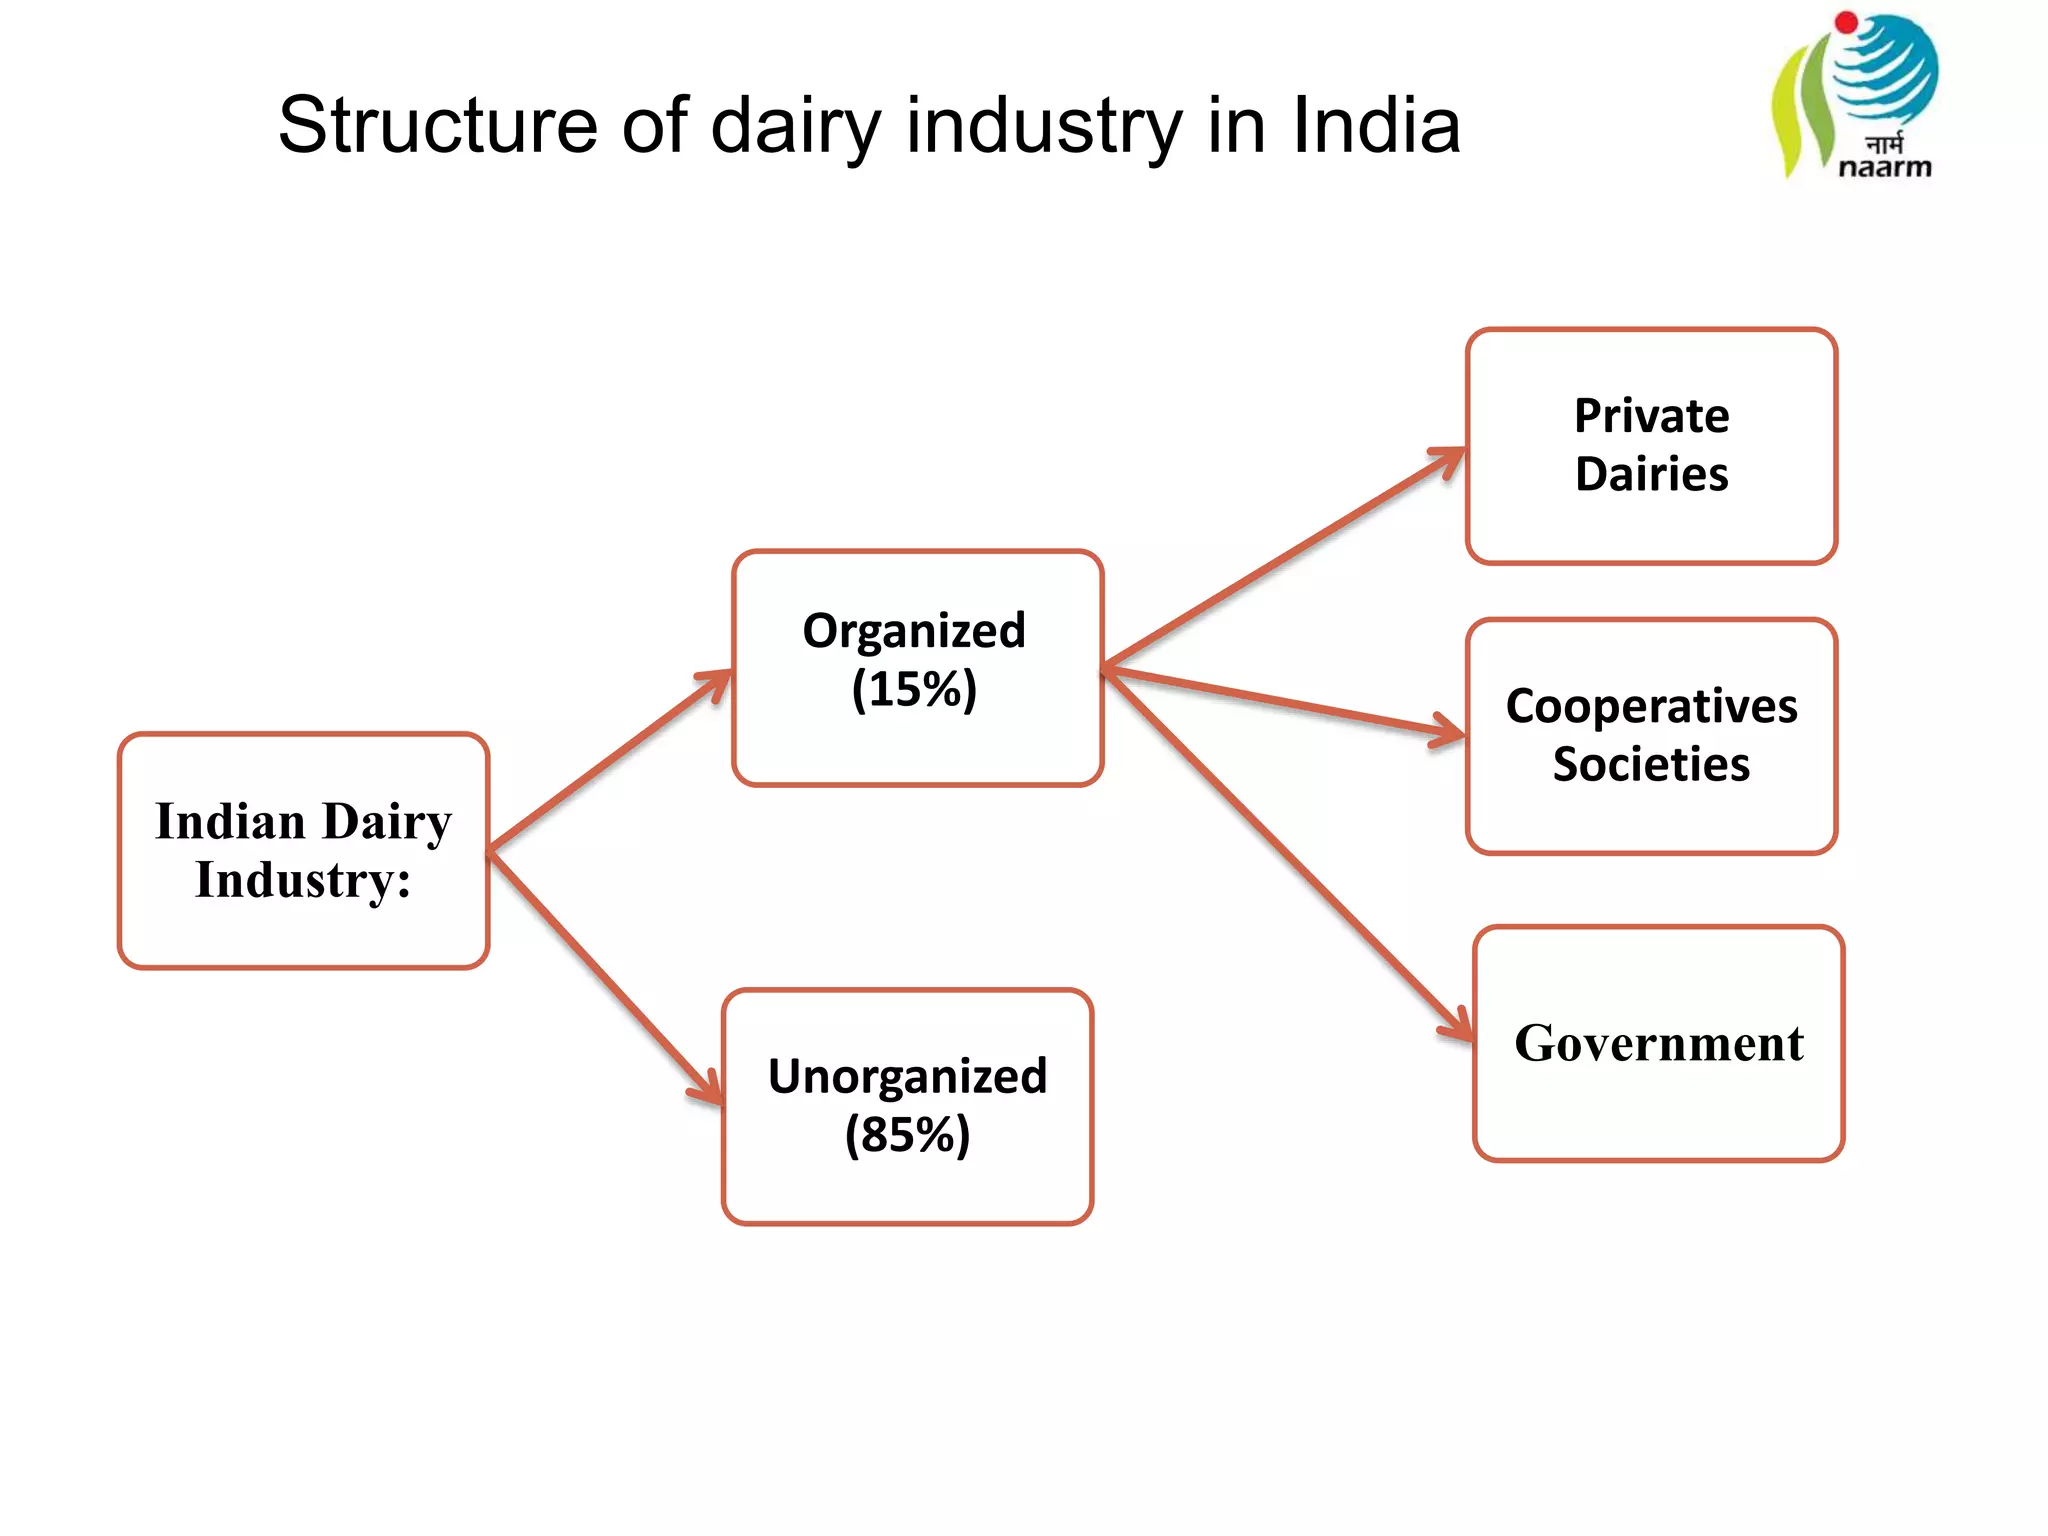
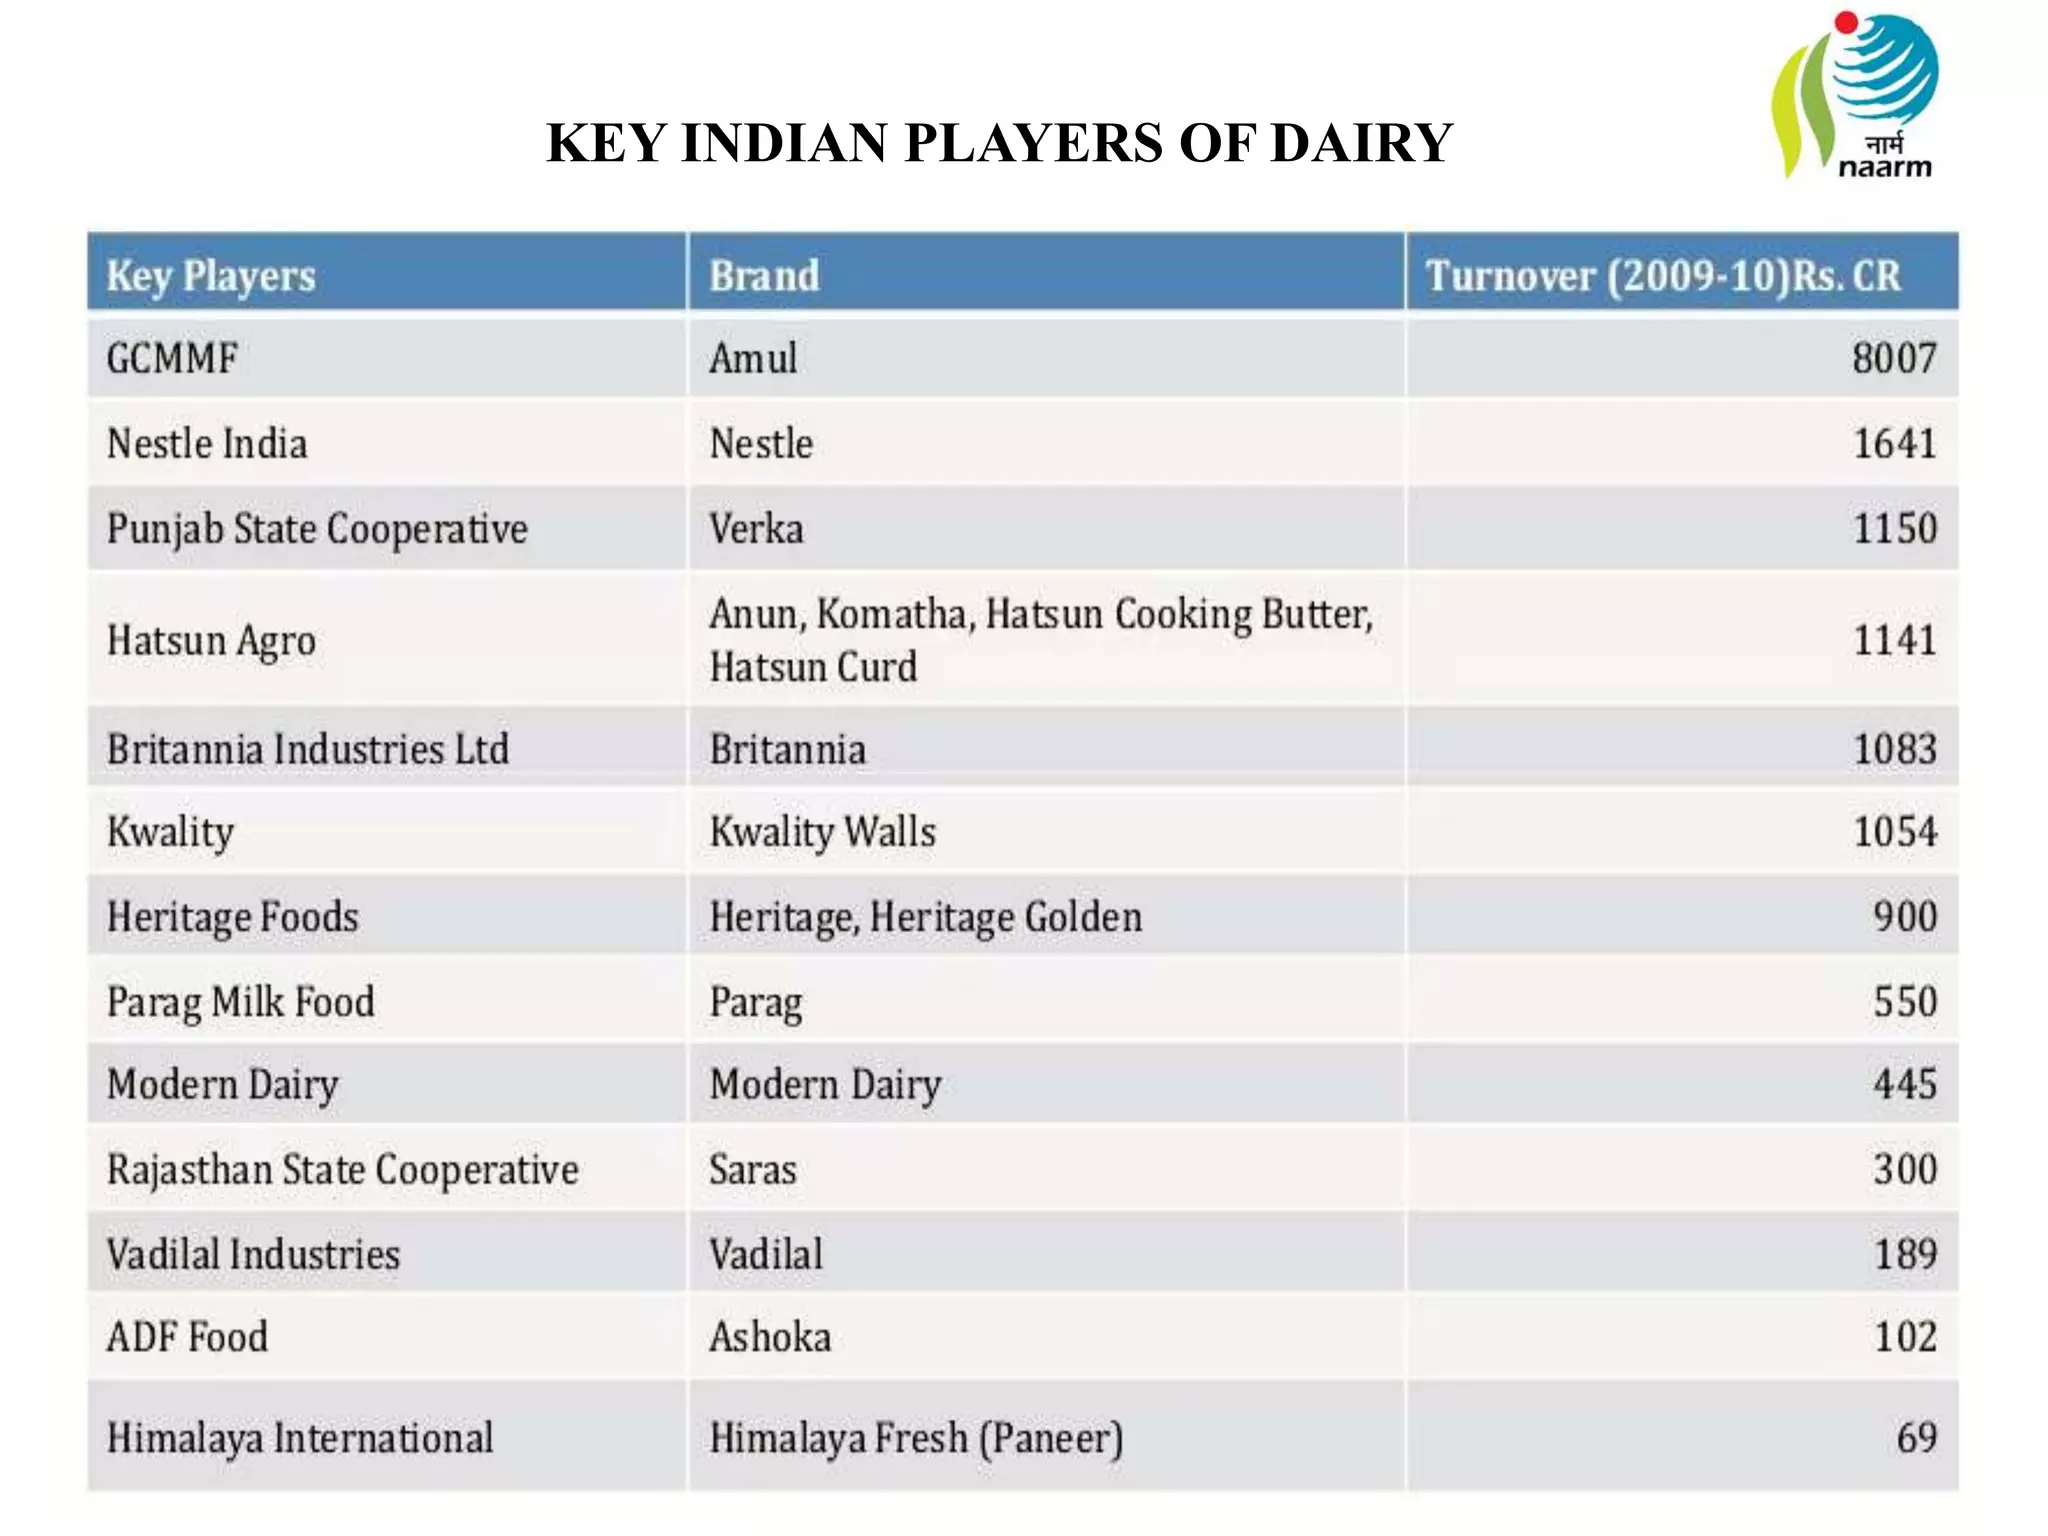
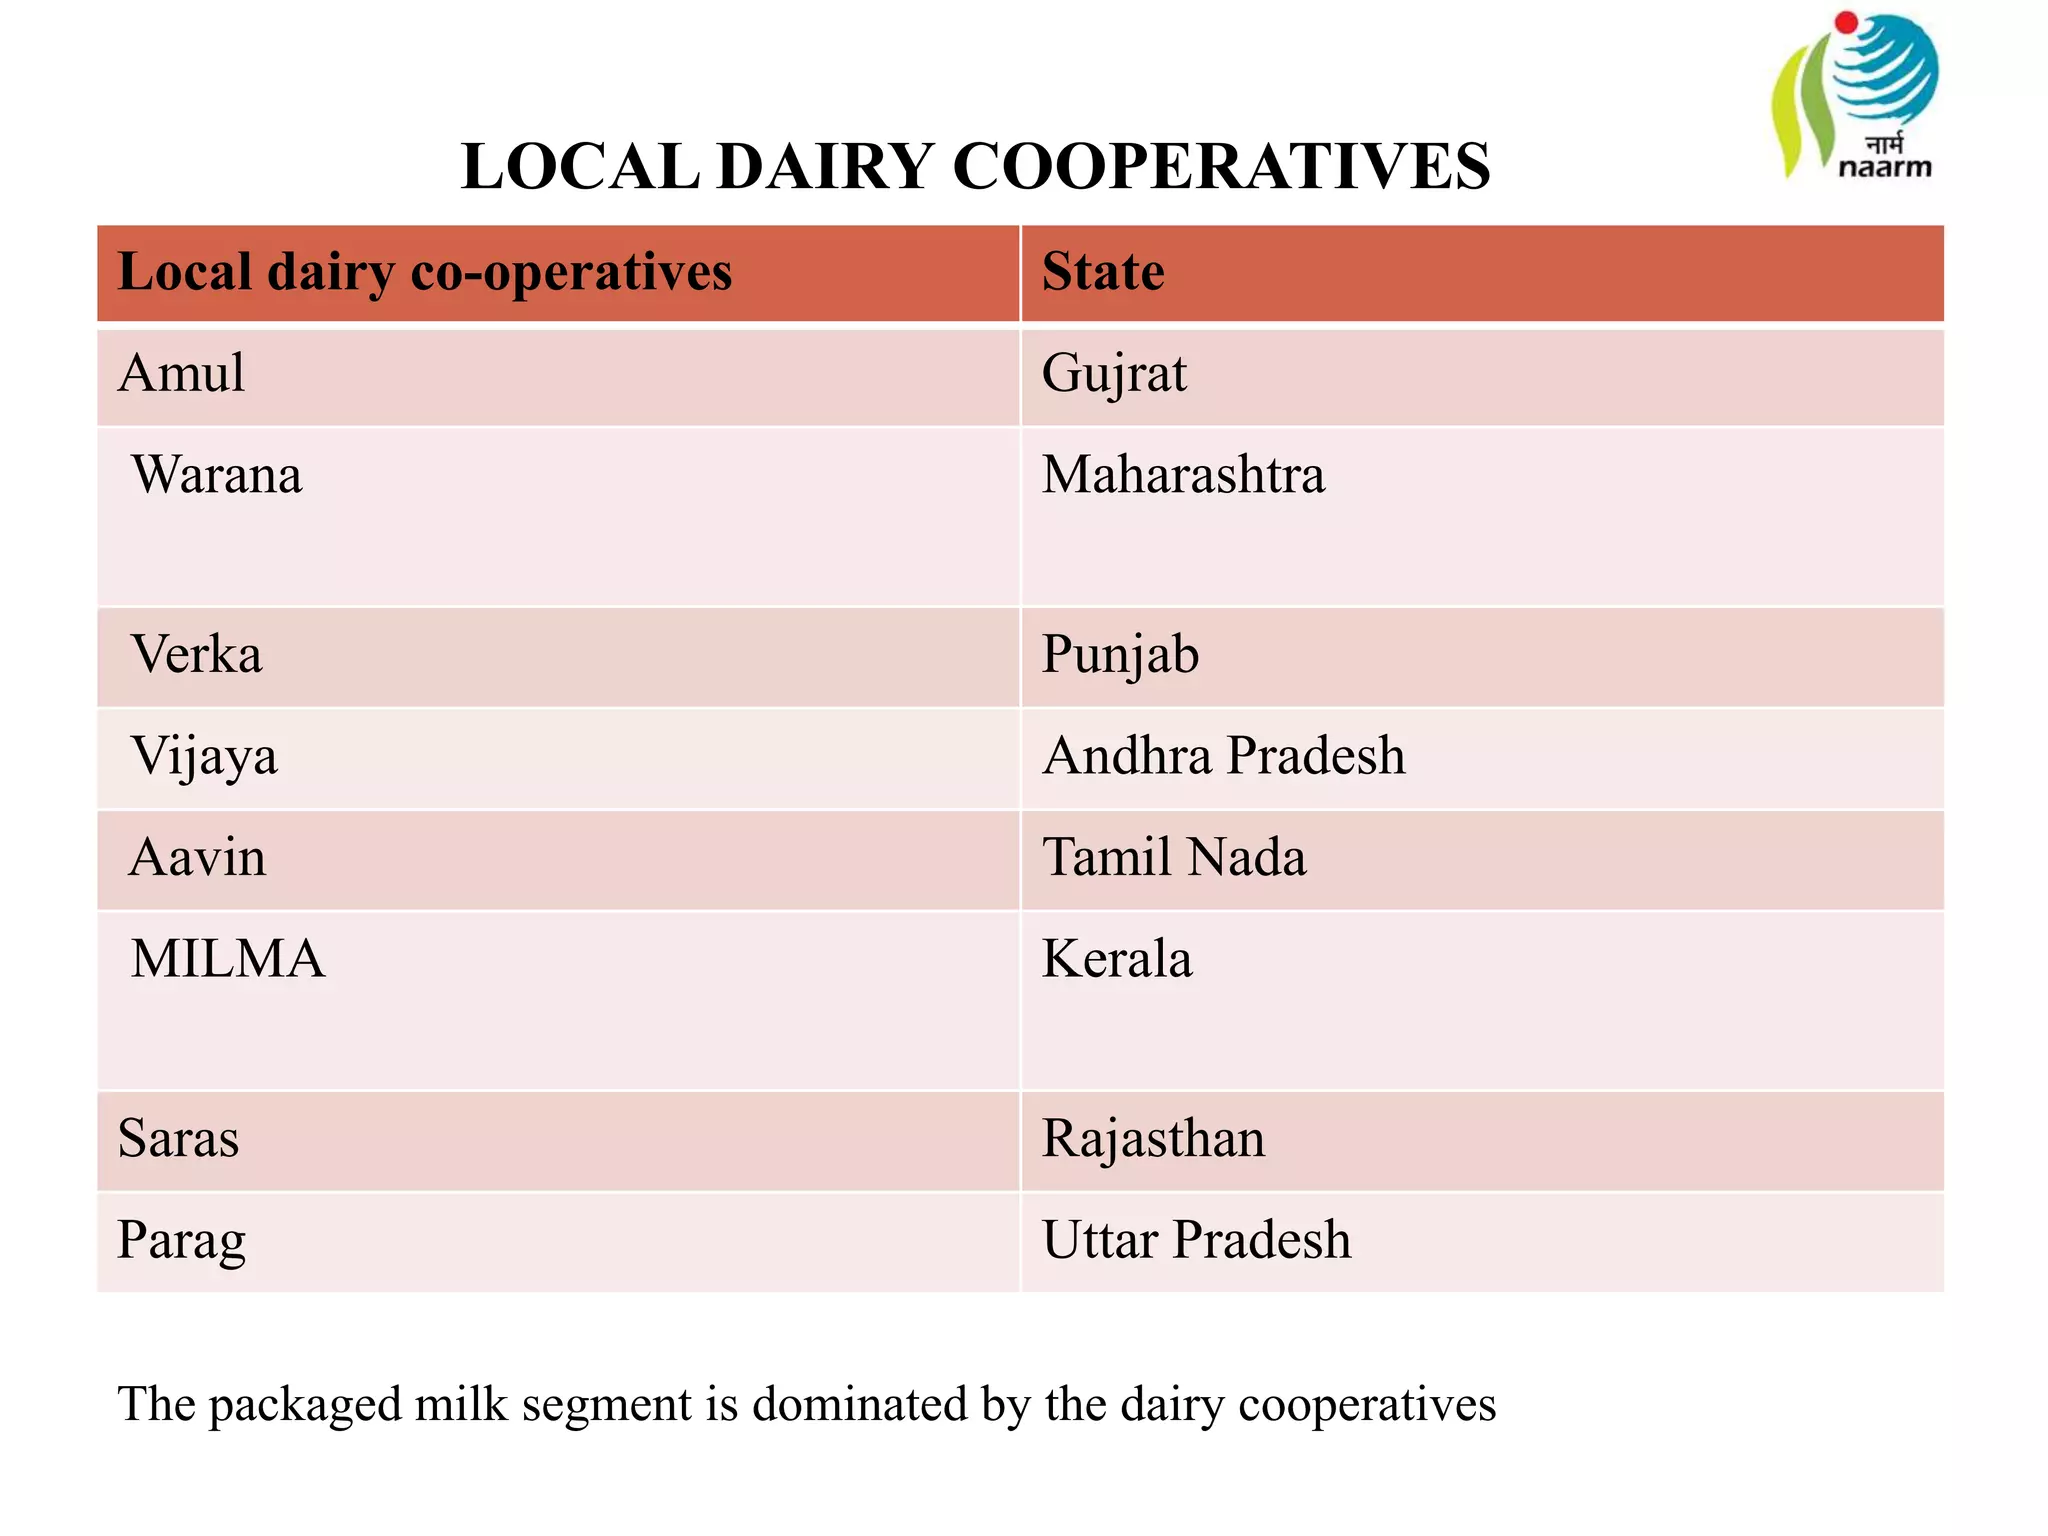
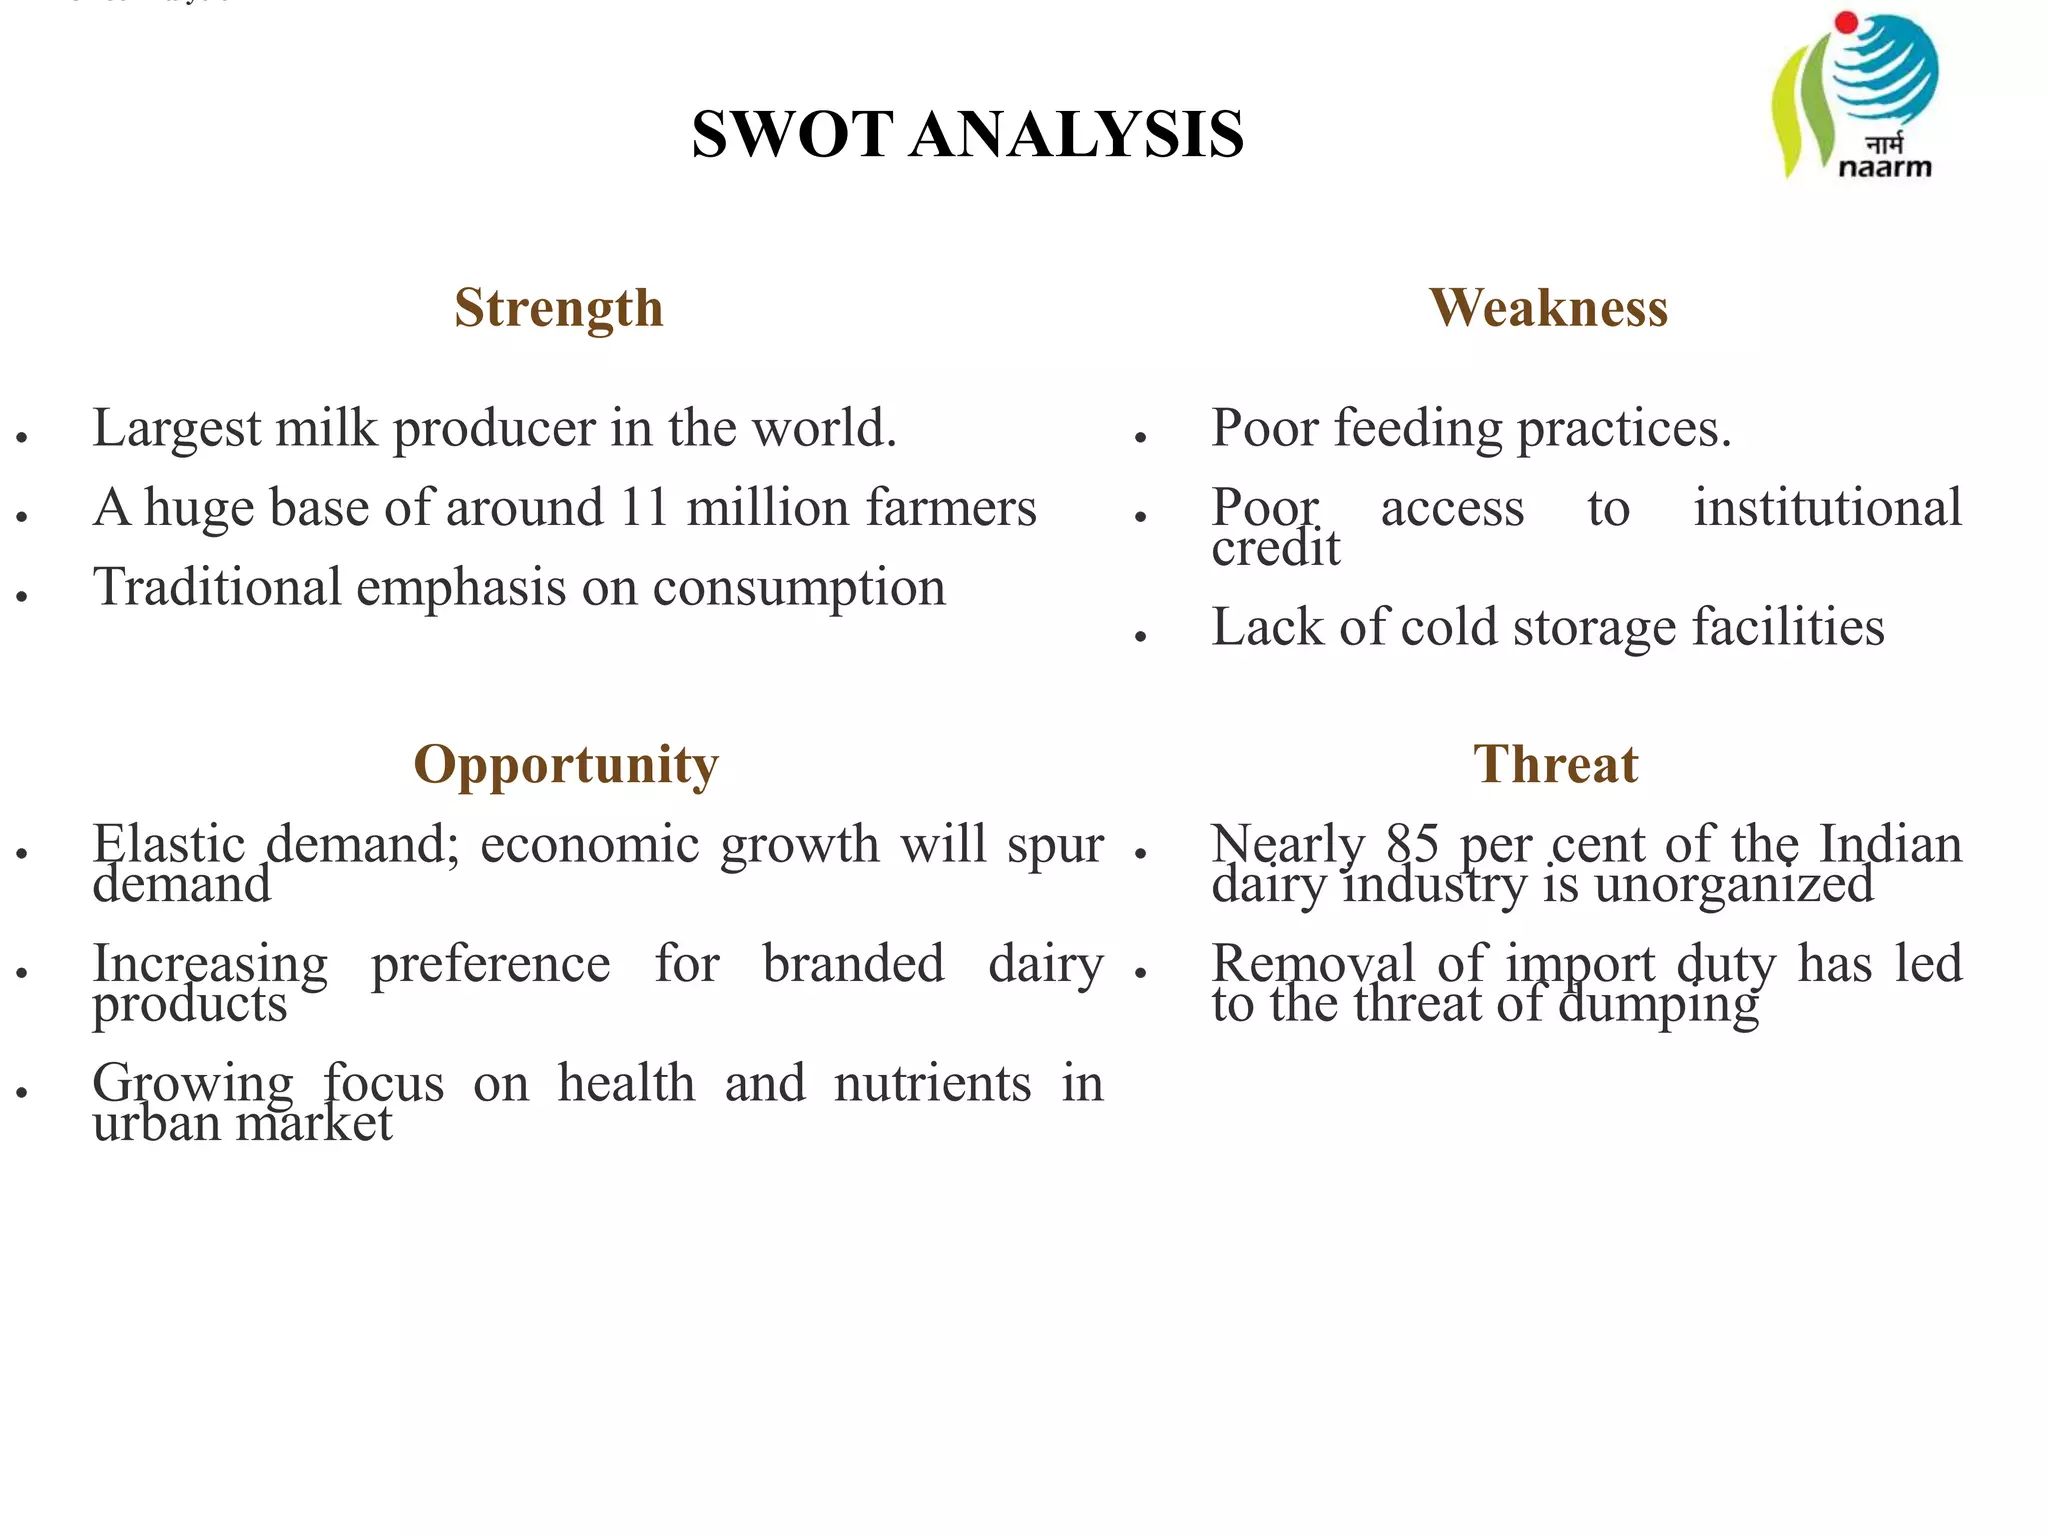


This document provides an overview of the dairy industry in India. It discusses that India is the largest producer and consumer of milk globally, producing over 127 million tons annually. The dairy industry is made up of mostly small farmers (85%) and some large cooperatives and private dairies (15%). The cooperative model pioneered by Operation Flood led by the National Dairy Development Board has helped transform India into the top dairy producer. Key players in the organized sector include cooperative dairies such as Amul, Vijaya, and Milma. The document outlines trends in production, consumption, exports and imports as well as policies and institutions supporting the dairy industry.


