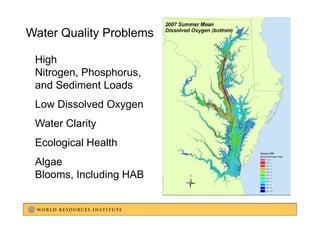
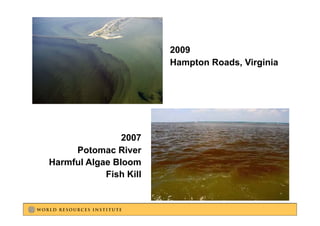
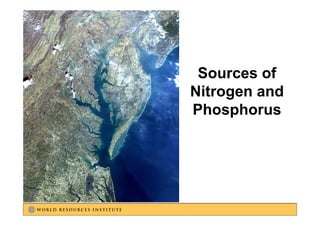
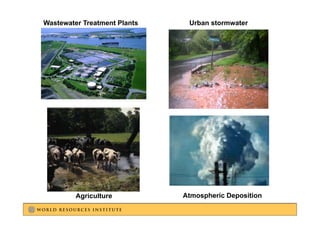
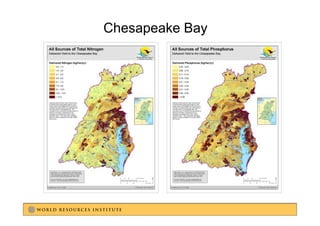
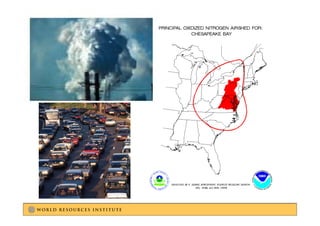
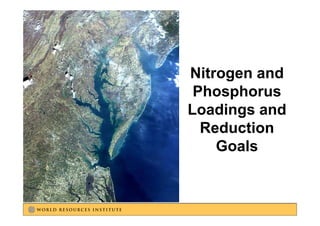
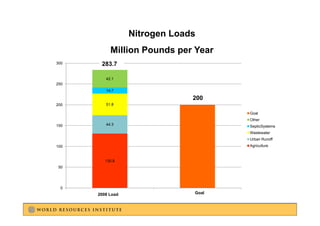
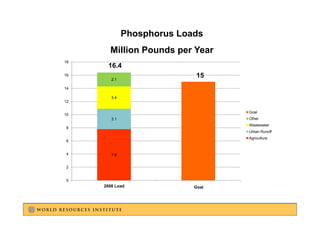
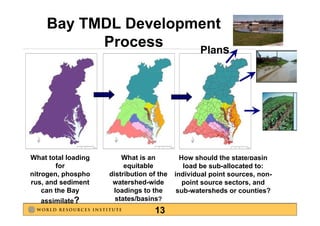
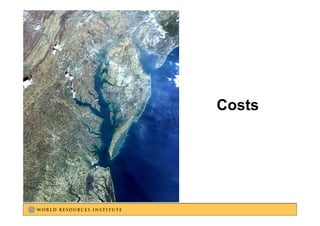
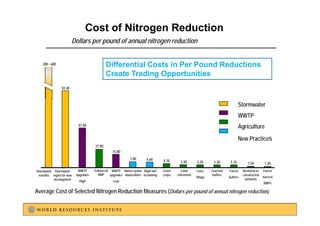
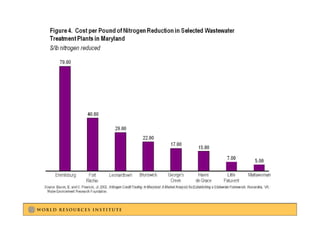
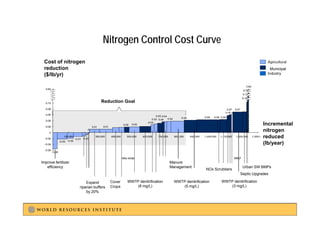
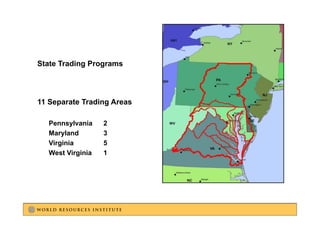
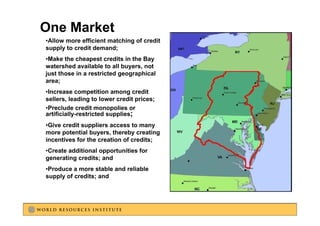
Regional Nitrogen and
  Phosphorus Trading in the
  Chesapeake B W t h d
  Ch      k Bay Watershed

                Cy Jones
        World Resources Institute


Building New Clean Water Networks in China
     Nanjing University, Nanjing, China
             January 14, 2010

                    1
Pennsylvania
Maryland
West Virginia
Delaware
Virginia
New York
Washington, D.C.
Water Quality Problems

 High
 Nitrogen, Phosphorus,
 and Sediment Loads
 Low Dissolved Oxygen
 Water Clarity
 Ecological Health
 E l i lH lh
 Algae
 Blooms, Including HAB
2009
                        Hampton Roads Virginia
                                Roads,


                2007
     Potomac River
Harmful Algae Bloom
            Fish Kill
Sources of
Nitrogen and
Nit        d
Phosphorus
Wastewater Treatment Plants    Urban stormwater


         Agriculture          Atmospheric Deposition
Chesapeake Bay
Nitrogen and
 Phosphorus
 Ph   h
Loadings and
  Reduction
    Goals
Nitrogen Loads
           Million Pounds per Year
300    283.7
       283 7

         42.1
250
         14.7

                               200
200      51.8

                                      Goal
                                      Other
150      44.3                         SepticSystems
                                      Wastewater
                                      Urban Runoff
100                                   Agriculture


         130.8
 50


  0
           1
      2008 Load                Goal
                               2
Phosphorus Loads
       Million Pounds per Year
18
      16.4
16
        2.1
                             15
14

        3.4
12

                                   Goal
10
        3.1                        Other
                                   Wastewater
8
                                   Urban Runoff
                                   Agriculture
6


4       7.8


2


0
     20081Load               2
                            Goal
Bay TMDL Development
           Process    Plans


What total loading       What is an          How should the state/basin
        for
        f                 equitable
                              it bl           load b
                                              l d be sub-allocated to:
                                                        b ll    t dt
nitrogen, phospho    distribution of the   individual point sources, non-
rus, and sediment     watershed-wide          point source sectors, and
    can the Bay       loadings to the       sub-watersheds
                                            sub watersheds or counties?
   assimilate?         states/basins?
                                   13
U. S Government                     Non-government
                                        g
President of the United States      NGOs
U.S. Congress                         Environmental Advocacy
Federal Agencies                      Conservation
  Environmental Protection Agency   Academic Community
  Department of Agriculture         Businesses
  Many Others                       Citizens


States
Governors
Legislatures
State Agencies
  Environmental Protection
  Natural Resources
Local Governments
Public Schools
Costs
Cost of Nitrogen Reduction
                         Dollars per pound of annual nitrogen reduction

   Average dollars per pound of annual nitrogen load
   200 - 600
   reduction        Differential Costs in Per Pound Reductions
                    Diff     i lC      i P P      dR d    i
                                              Create Trading Opportunities
                 92.40
                 92 40


                                                                                                                                 Stormwater
                                                                                                                                 WWTP
                            47.40                                                                                                Agriculture
                                                                                                                                 New Practices
                                      21.90
                                                 15.80
                                                            7.00      6.60      4.70      3.30       3.20       3.20      3.10        1.50        1.20

Stormwater Stormwater       WWTP      Enhanced WWTP Native oyster Algal turf    Cover      Land      Cons.     Grassed   Forest    Restored or   Forest
  retrofits mgmt for new   upgrades     NMP    upgrades aquaculture scrubbing   crops   retirement             buffers             constructed
                                                                                                     tillage             buffers                 harvest
            development                                                                                                             wetlands
                            -High-               -Low-
                                                                                                                                                 BMPs

Average Cost of Selected Nitrogen Reduction Measures (D ll per pound of annual nitrogen reduction)
A       C t f S l t d Nit         R d ti M            Dollars      d f       l it         d ti )
Nitrogen Control Cost Curve
                                   Nit      C t lC tC
 Cost of nitrogen
 reduction                                                                                                                   Municipal
 ($/lb/yr)


                                  Reduction Goal


                                                                                                                        Incremental
                                                                                                                        nitrogen
                                                                                                                        reduced
                                                                                                                        (lb/year)


Improve fertilizer
  p                                                                    Manure
   efficiency                                                          Management                           Urban SW BMPs
                                                                                          NOx Scrubbers
                                                                                                           Septic Upgrades

                         Expand         Cover   WWTP denitrification    WWTP denitrification     WWTP denitrification
                     riparian buffers   Crops      (8 mg/L)                (5 mg/L)                 (3 mg/L)
                         by 20%
Nutrient Trading
Wastewater treatment plants buy and sell each
                      p       y
other nitrogen and phosphorus credits or
emission allowances.


Wastewater treatment plants buy nitrogen
and phosphorus load reductions from
nonpoint sources, such as farmers.
   p            ,
Nutrient Trading

 Lower cost

 Accommodate growth
 and development
Intrastate Trading (Current Situation)


State Trading Programs
St t T di     P


11 Separate Trading Areas

   Pennsylvania    2
   Maryland        3                 Patuxent
   Virginia        5
   West Virginia   1
Intrastate Trading (Current Situation)
One Market
•Allow more efficient matching of credit
supply to credit demand;
•Make the cheapest credits in the Bay
                p                    y
watershed available to all buyers, not
just those in a restricted geographical
area;
•Increase competition among credit
sellers, leading to lower credit prices;
•Preclude credit monopolies or
artificially restricted supplies;
artificially-restricted
•Give credit suppliers access to many
more potential buyers, thereby creating
                                           Patuxent
incentives for the creation of credits;
•Create additional opportunities for
generating credits; and
•Produce a more stable and reliable
supply of credits; and
Cy Jones
     Senior Associate
 World Resources Institute
10 G. Street, NE, Suite 800
  Washington, DC 20002
      (202) 729-7899
      cjones@wri.org
        www.wri.org
                  g

Cy Jones

  • 1.
    Regional Nitrogen and Phosphorus Trading in the Chesapeake B W t h d Ch k Bay Watershed Cy Jones World Resources Institute Building New Clean Water Networks in China Nanjing University, Nanjing, China January 14, 2010 1
  • 2.
  • 4.
    Water Quality Problems High Nitrogen, Phosphorus, and Sediment Loads Low Dissolved Oxygen Water Clarity Ecological Health E l i lH lh Algae Blooms, Including HAB
  • 5.
    2009 Hampton Roads Virginia Roads, 2007 Potomac River Harmful Algae Bloom Fish Kill
  • 6.
  • 7.
    Wastewater Treatment Plants Urban stormwater Agriculture Atmospheric Deposition
  • 8.
  • 10.
    Nitrogen and Phosphorus Ph h Loadings and Reduction Goals
  • 11.
    Nitrogen Loads Million Pounds per Year 300 283.7 283 7 42.1 250 14.7 200 200 51.8 Goal Other 150 44.3 SepticSystems Wastewater Urban Runoff 100 Agriculture 130.8 50 0 1 2008 Load Goal 2
  • 12.
    Phosphorus Loads Million Pounds per Year 18 16.4 16 2.1 15 14 3.4 12 Goal 10 3.1 Other Wastewater 8 Urban Runoff Agriculture 6 4 7.8 2 0 20081Load 2 Goal
  • 13.
    Bay TMDL Development Process Plans What total loading What is an How should the state/basin for f equitable it bl load b l d be sub-allocated to: b ll t dt nitrogen, phospho distribution of the individual point sources, non- rus, and sediment watershed-wide point source sectors, and can the Bay loadings to the sub-watersheds sub watersheds or counties? assimilate? states/basins? 13
  • 15.
    U. S Government Non-government g President of the United States NGOs U.S. Congress Environmental Advocacy Federal Agencies Conservation Environmental Protection Agency Academic Community Department of Agriculture Businesses Many Others Citizens States Governors Legislatures State Agencies Environmental Protection Natural Resources Local Governments Public Schools
  • 16.
  • 17.
    Cost of NitrogenReduction Dollars per pound of annual nitrogen reduction Average dollars per pound of annual nitrogen load 200 - 600 reduction Differential Costs in Per Pound Reductions Diff i lC i P P dR d i Create Trading Opportunities 92.40 92 40 Stormwater WWTP 47.40 Agriculture New Practices 21.90 15.80 7.00 6.60 4.70 3.30 3.20 3.20 3.10 1.50 1.20 Stormwater Stormwater WWTP Enhanced WWTP Native oyster Algal turf Cover Land Cons. Grassed Forest Restored or Forest retrofits mgmt for new upgrades NMP upgrades aquaculture scrubbing crops retirement buffers constructed tillage buffers harvest development wetlands -High- -Low- BMPs Average Cost of Selected Nitrogen Reduction Measures (D ll per pound of annual nitrogen reduction) A C t f S l t d Nit R d ti M Dollars d f l it d ti )
  • 19.
    Nitrogen Control CostCurve Nit C t lC tC Cost of nitrogen reduction Municipal ($/lb/yr) Reduction Goal Incremental nitrogen reduced (lb/year) Improve fertilizer p Manure efficiency Management Urban SW BMPs NOx Scrubbers Septic Upgrades Expand Cover WWTP denitrification WWTP denitrification WWTP denitrification riparian buffers Crops (8 mg/L) (5 mg/L) (3 mg/L) by 20%
  • 20.
    Nutrient Trading Wastewater treatmentplants buy and sell each p y other nitrogen and phosphorus credits or emission allowances. Wastewater treatment plants buy nitrogen and phosphorus load reductions from nonpoint sources, such as farmers. p ,
  • 21.
    Nutrient Trading Lowercost Accommodate growth and development
  • 22.
    Intrastate Trading (CurrentSituation) State Trading Programs St t T di P 11 Separate Trading Areas Pennsylvania 2 Maryland 3 Patuxent Virginia 5 West Virginia 1
  • 23.
    Intrastate Trading (CurrentSituation) One Market •Allow more efficient matching of credit supply to credit demand; •Make the cheapest credits in the Bay p y watershed available to all buyers, not just those in a restricted geographical area; •Increase competition among credit sellers, leading to lower credit prices; •Preclude credit monopolies or artificially restricted supplies; artificially-restricted •Give credit suppliers access to many more potential buyers, thereby creating Patuxent incentives for the creation of credits; •Create additional opportunities for generating credits; and •Produce a more stable and reliable supply of credits; and
  • 24.
    Cy Jones Senior Associate World Resources Institute 10 G. Street, NE, Suite 800 Washington, DC 20002 (202) 729-7899 cjones@wri.org www.wri.org g