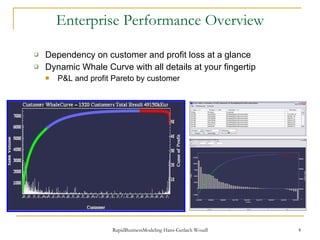
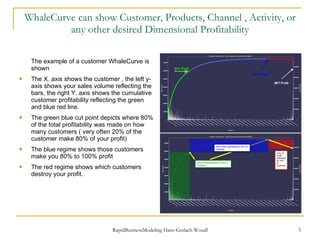
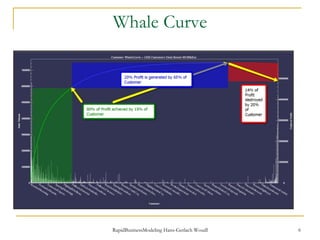
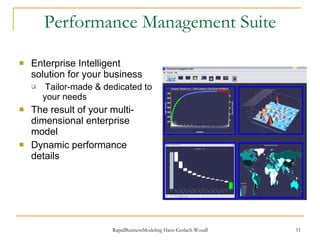
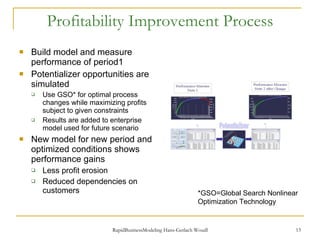
We Improve Profitability Hans-Gerlach Woudboer September 2009 Customer Profitability   Analysis and Improvement  by building a multi-dimensional enterprise model
Hans-Gerlach Woudboer Passionate about   Customer-Profitability- Improvement by using our state of the art RapidBusinessModeling tool In a consulting for 10 years - dedicated to customer profitability improvement based on ABC/ABM 27 year with ExxonMobil in various technical and managerial positions within manufacturing, business and marketing ExxonChemical President award winner for an enterprise re-engineering and cost reduction project of 30% Chemical Engineer, earned his Master degree at the Aachen University of Technology
Do You Know Your Customers True Profitability? Does your company have any unprofitable customers? How much money do you leave on the table with your customers? What profit does each of your customer add or destroy to your companies profit? How much profit do you make or lose with activities performed for your customers? We can help you to answer all of those questions
Enterprise Performance Overview Dependency on customer and profit loss at a glance Dynamic Whale Curve with all details at your fingertip P&L and profit Pareto by customer
WhaleCurve can show Customer, Products, Channel , Activity, or any other desired Dimensional Profitability The example of a customer WhaleCurve is shown  The X. axis shows the customer , the left y-axis shows your sales volume reflecting the bars, the right Y. axis shows the cumulative customer profitability reflecting the green and blue red line. The green blue cut point depicts where 80% of the total profitability was made on how many customers ( very often 20% of the customer make 80% of your profit) The blue regime shows those customers make you 80% to 100% profit The red regime shows which customers destroy your profit.
Whale Curve
Dependence on  Customer versus Loss of Profit Loss of Profit Dependence on  Customer
Potentializer Potentializer perspective by customer and product Gap-analysis of prices and costs.  The basis of holistic and significant profit improvement!
Multi-Dimensional Calculator
 
Performance Management Suite Enterprise Intelligent solution for your business Tailor-made & dedicated to your needs The result of your multi-dimensional enterprise model Dynamic performance details
Performance Management Suite
Profitability Improvement Process Build model and measure performance of period1 Potentializer opportunities are simulated  Use GSO* for optimal process changes while maximizing profits subject to given constraints Results are added to enterprise model used for future scenario New model for new period and optimized conditions shows performance gains Less profit erosion Reduced dependencies on customers *GSO=Global Search Nonlinear Optimization Technology
Our Approach and Performance Build a multi-dimensional enterprise business model for your company  Performance measurement by a WhaleCurve  and Potentializer shows where you stand and what are your chances for improvement Performance Management Suite shows all business model details Low hanging fruits are revealed and can be captured Potentializer identifies best routes for changes Global Search Nonlinear Optimization Technology applied to identified opportunities provides best answers for change Conservatively improve your bottom-line by 3- 6% of revenue
One-day   workshop and focused Customer Profitability Analysis One-day  workshop: We can develop from scratch at your site a substantial model of your business in order to demonstrate the capabilities and your potential advantages All data based on management interviews  A detailed  RapidBusinessModel  can be built at an competitive price within  weeks Presented to Management with proposed action for change Performance Management Suite enables access to all results Precondition: Access to data and model owner as coordinator
Resources and Data Commitment and Ownership of Management Management Steering Committee to report to A Model Owner and Coordinator Data Accounting Costs and Income Statement/General Ledger Organizational and Process Charts Personnel File Transactional Business Data for Activity Driver Creation Customer, Products, Volume, Net Revenue, Markets.. For Mfg:  Production Details Line, Product1-n, Volume, produced from to Raw materials and product recipe
References Technische Glaswerke Ilmenau Evonik-Degussa Calpam  a Kuwait Petroleum Company A Medical Care Company

Customer Profitability Improvement

  • 1.
    We Improve ProfitabilityHans-Gerlach Woudboer September 2009 Customer Profitability Analysis and Improvement by building a multi-dimensional enterprise model
  • 2.
    Hans-Gerlach Woudboer Passionateabout Customer-Profitability- Improvement by using our state of the art RapidBusinessModeling tool In a consulting for 10 years - dedicated to customer profitability improvement based on ABC/ABM 27 year with ExxonMobil in various technical and managerial positions within manufacturing, business and marketing ExxonChemical President award winner for an enterprise re-engineering and cost reduction project of 30% Chemical Engineer, earned his Master degree at the Aachen University of Technology
  • 3.
    Do You KnowYour Customers True Profitability? Does your company have any unprofitable customers? How much money do you leave on the table with your customers? What profit does each of your customer add or destroy to your companies profit? How much profit do you make or lose with activities performed for your customers? We can help you to answer all of those questions
  • 4.
    Enterprise Performance OverviewDependency on customer and profit loss at a glance Dynamic Whale Curve with all details at your fingertip P&L and profit Pareto by customer
  • 5.
    WhaleCurve can showCustomer, Products, Channel , Activity, or any other desired Dimensional Profitability The example of a customer WhaleCurve is shown The X. axis shows the customer , the left y-axis shows your sales volume reflecting the bars, the right Y. axis shows the cumulative customer profitability reflecting the green and blue red line. The green blue cut point depicts where 80% of the total profitability was made on how many customers ( very often 20% of the customer make 80% of your profit) The blue regime shows those customers make you 80% to 100% profit The red regime shows which customers destroy your profit.
  • 6.
  • 7.
    Dependence on Customer versus Loss of Profit Loss of Profit Dependence on Customer
  • 8.
    Potentializer Potentializer perspectiveby customer and product Gap-analysis of prices and costs. The basis of holistic and significant profit improvement!
  • 9.
  • 10.
  • 11.
    Performance Management SuiteEnterprise Intelligent solution for your business Tailor-made & dedicated to your needs The result of your multi-dimensional enterprise model Dynamic performance details
  • 12.
  • 13.
    Profitability Improvement ProcessBuild model and measure performance of period1 Potentializer opportunities are simulated Use GSO* for optimal process changes while maximizing profits subject to given constraints Results are added to enterprise model used for future scenario New model for new period and optimized conditions shows performance gains Less profit erosion Reduced dependencies on customers *GSO=Global Search Nonlinear Optimization Technology
  • 14.
    Our Approach andPerformance Build a multi-dimensional enterprise business model for your company Performance measurement by a WhaleCurve and Potentializer shows where you stand and what are your chances for improvement Performance Management Suite shows all business model details Low hanging fruits are revealed and can be captured Potentializer identifies best routes for changes Global Search Nonlinear Optimization Technology applied to identified opportunities provides best answers for change Conservatively improve your bottom-line by 3- 6% of revenue
  • 15.
    One-day workshop and focused Customer Profitability Analysis One-day workshop: We can develop from scratch at your site a substantial model of your business in order to demonstrate the capabilities and your potential advantages All data based on management interviews A detailed RapidBusinessModel can be built at an competitive price within weeks Presented to Management with proposed action for change Performance Management Suite enables access to all results Precondition: Access to data and model owner as coordinator
  • 16.
    Resources and DataCommitment and Ownership of Management Management Steering Committee to report to A Model Owner and Coordinator Data Accounting Costs and Income Statement/General Ledger Organizational and Process Charts Personnel File Transactional Business Data for Activity Driver Creation Customer, Products, Volume, Net Revenue, Markets.. For Mfg: Production Details Line, Product1-n, Volume, produced from to Raw materials and product recipe
  • 17.
    References Technische GlaswerkeIlmenau Evonik-Degussa Calpam a Kuwait Petroleum Company A Medical Care Company