Download as PDF, PPTX
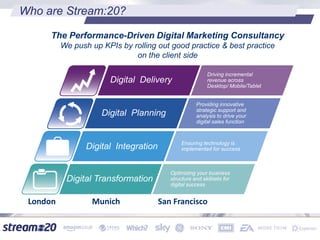
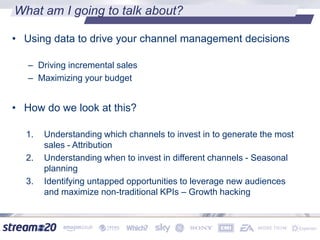
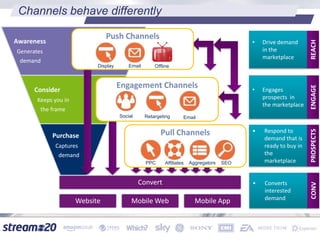
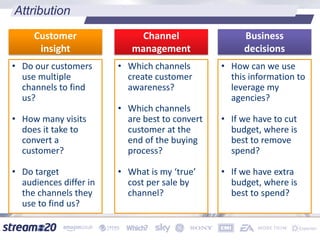


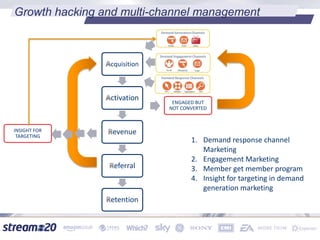


Stream:20 is a digital marketing consultancy that helps clients optimize their business structures, implement technology for success, and drive incremental revenue across devices. They push up key performance indicators for clients by rolling out and best practices for digital marketing. The presentation discusses using data to drive multi-channel management decisions to maximize budget and drive incremental sales. It covers attribution modeling to understand which channels generate awareness and convert customers, and how to leverage insights for seasonal planning and growth hacking new opportunities.


