Download to read offline
![Interpretation of Negativity: Neuroticism Framework?
15
[Jeronimus et. al, 2014, p.759] demonstrated that:
(a) neuroticism showed high temporal stability,
(b) Long-Term Difficulties and Deteriorated Life Quality
predicted lasting increases in neuroticism,
(c) Improved Life Quality predicted lasting decreases in
neuroticism,
(d) life event aggregates had no persistent impact on
neuroticism,
(e) neuroticism predicted experiences more consistently
than experiences predicted change in neuroticism.
Jeronimus, B. F., Riese, H., Sanderman, R., & Ormel, J. (2014).
Mutual reinforcement between neuroticism and life experiences: A
five-wave, 16-year study to test reciprocal causation. Journal of
Personality and Social Psychology, 107(4), 751-764.
http://dx.doi.org/10.1037/a0037009](https://image.slidesharecdn.com/informs2019-machinelearninganddatamininginidentificationofunhappycommunities-191026171316/75/Informs2019-machine-learning-and-data-mining-in-identification-of-unhappy-communities-15-2048.jpg)
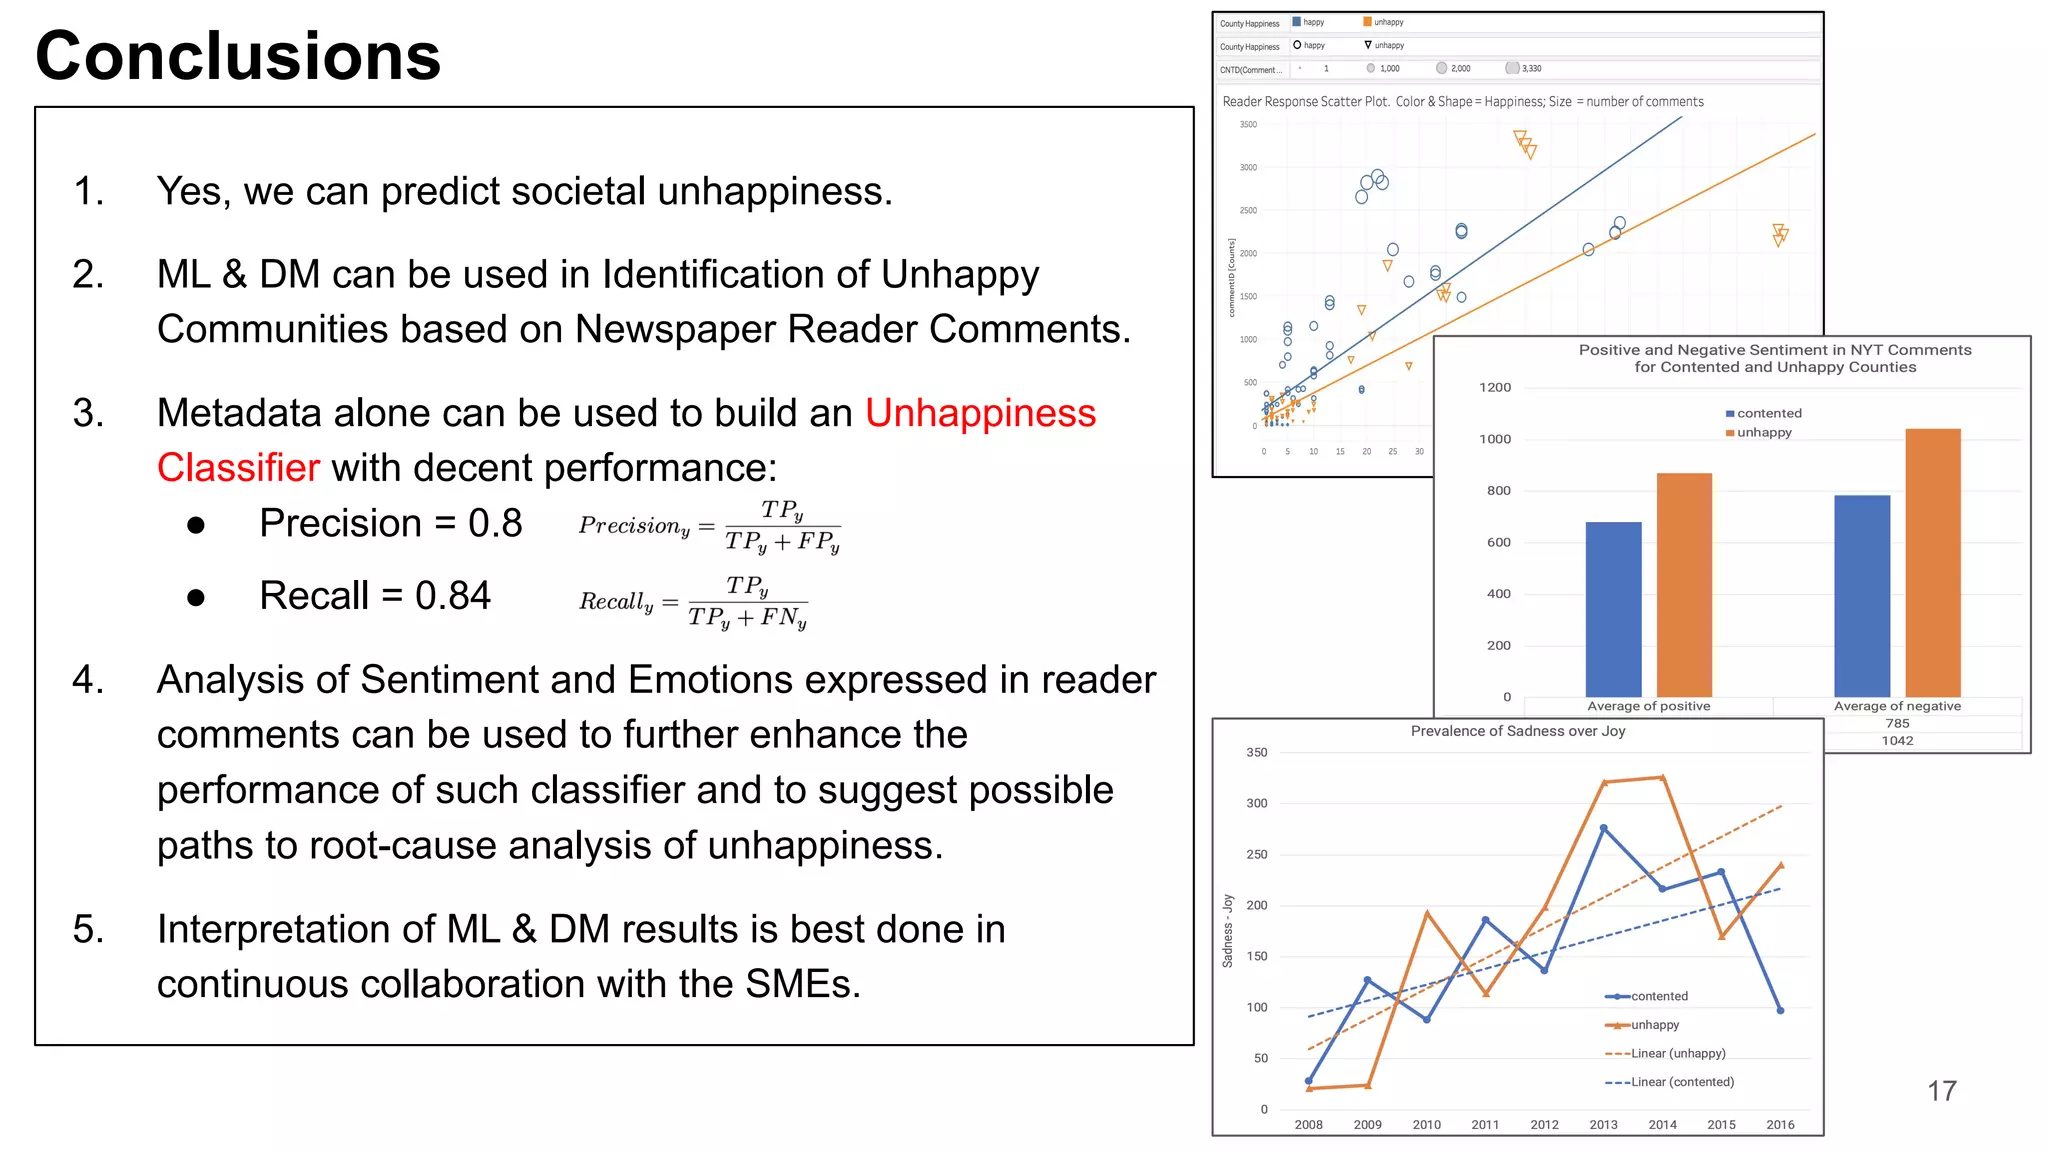


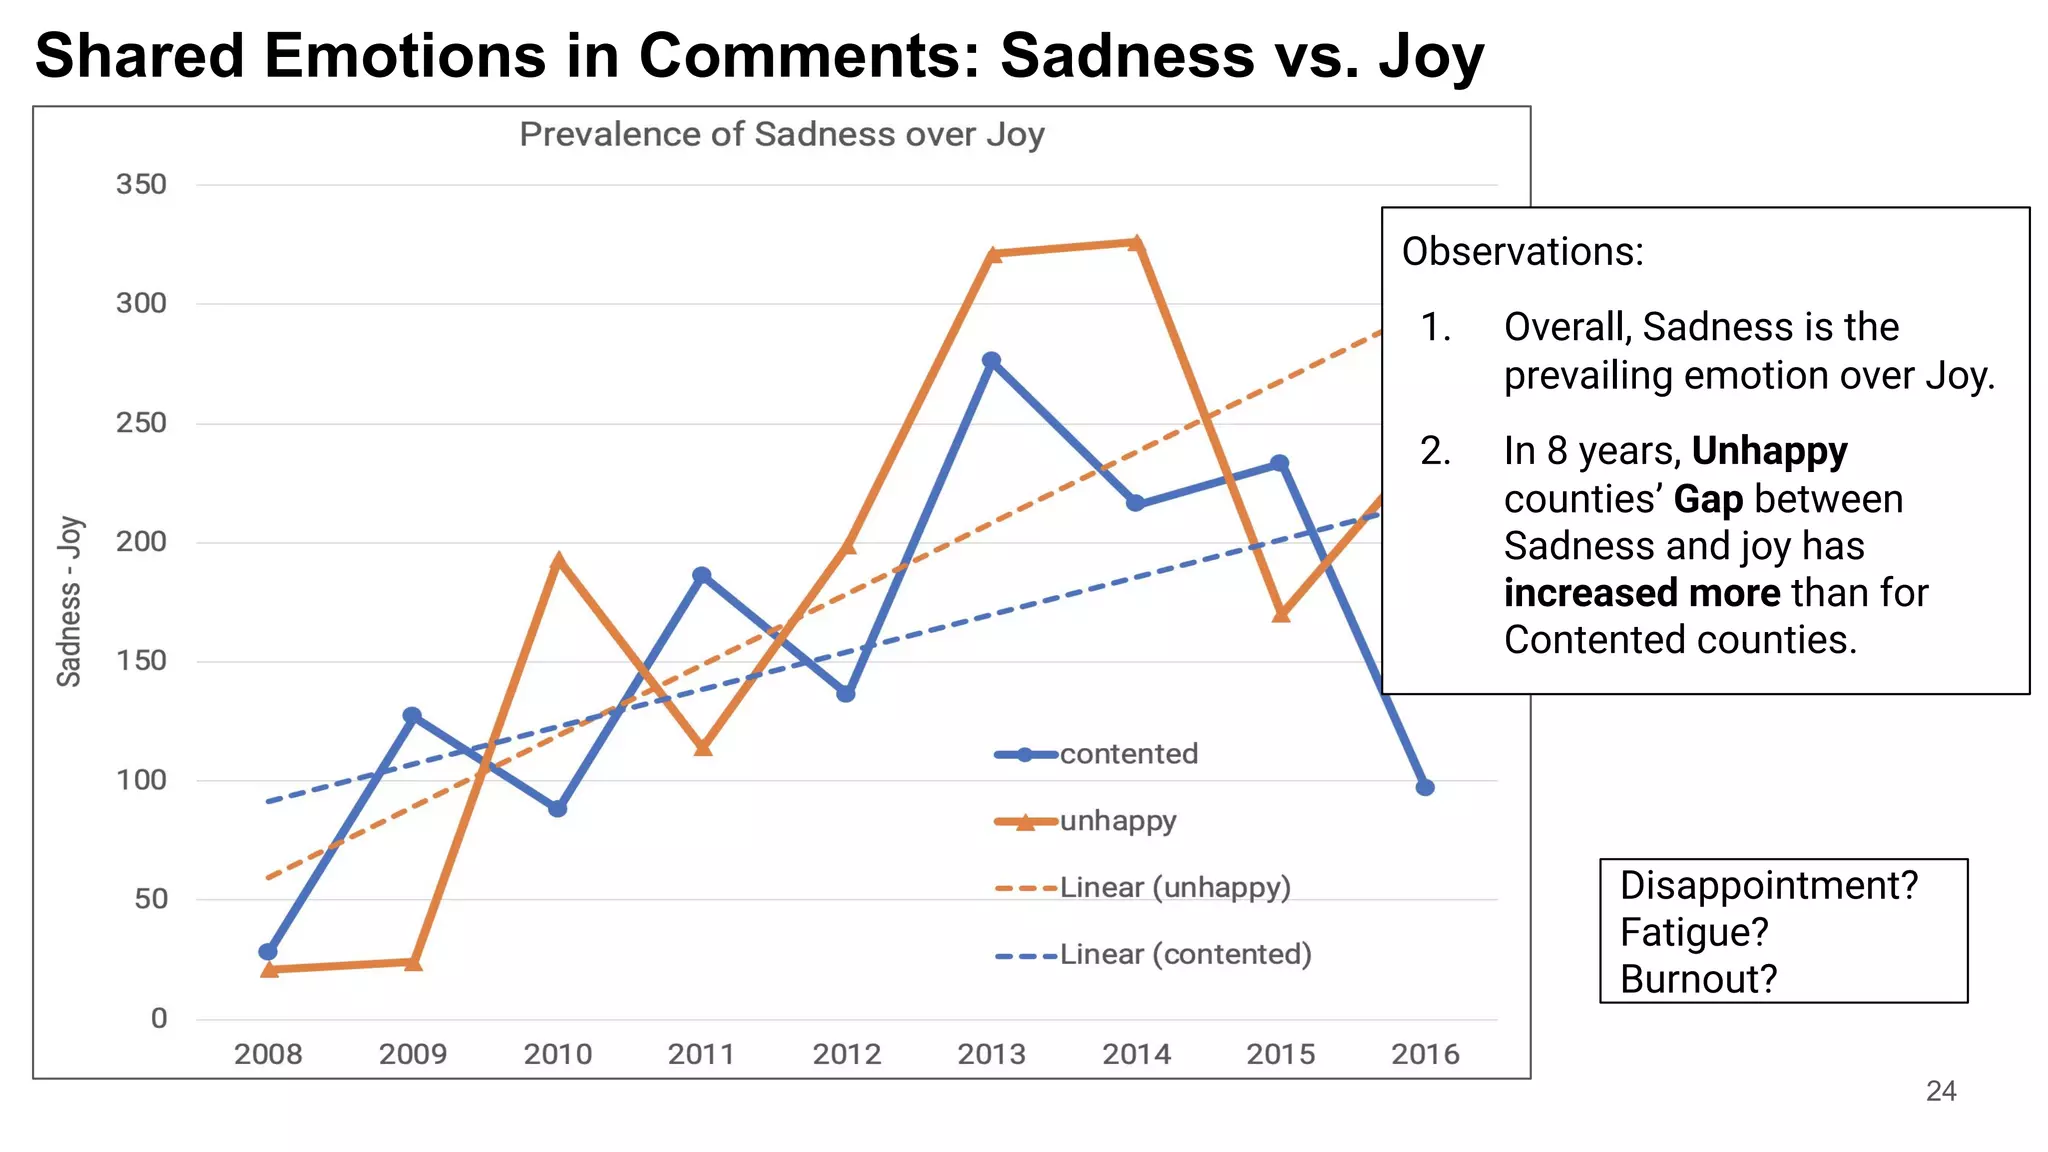
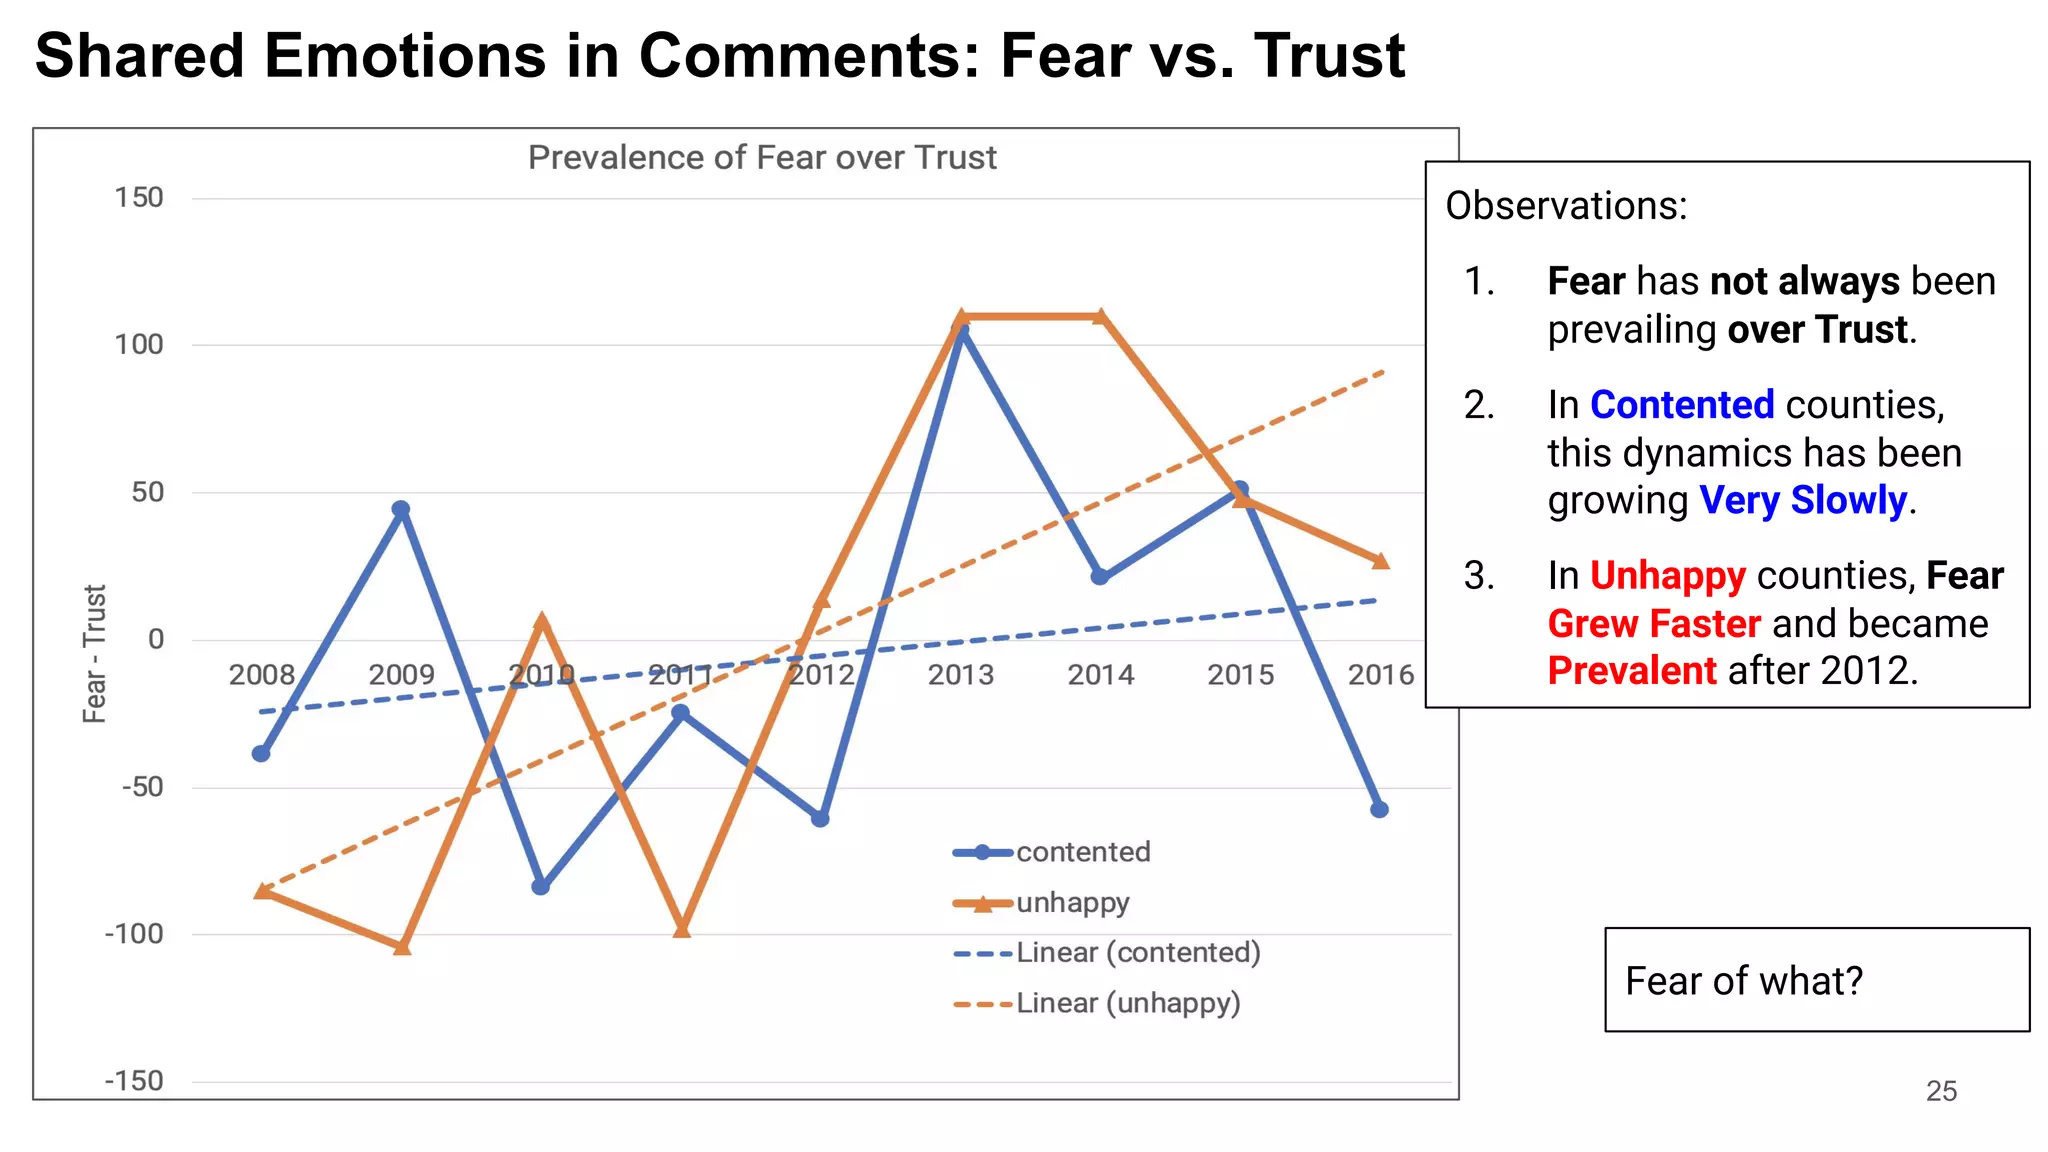
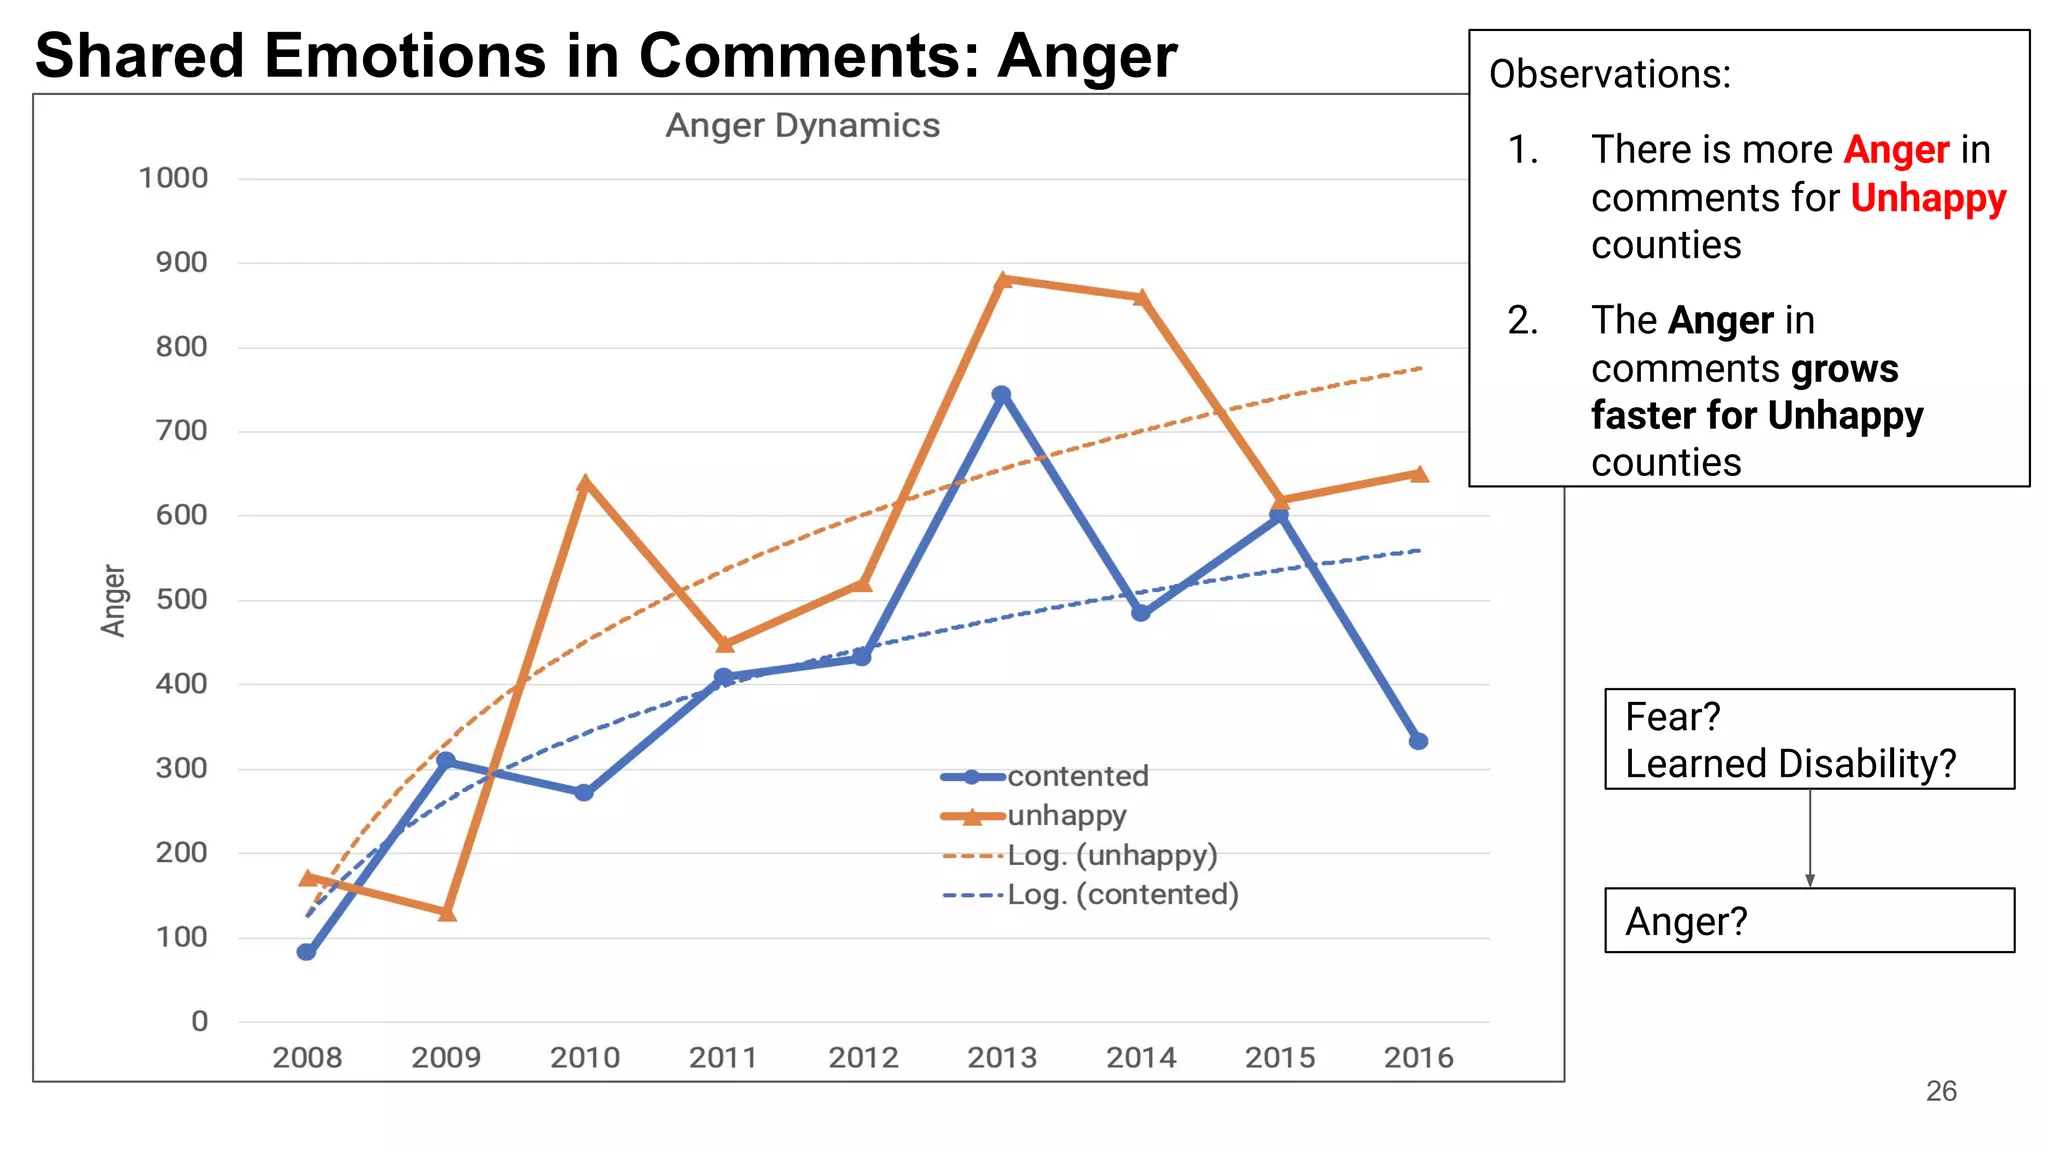
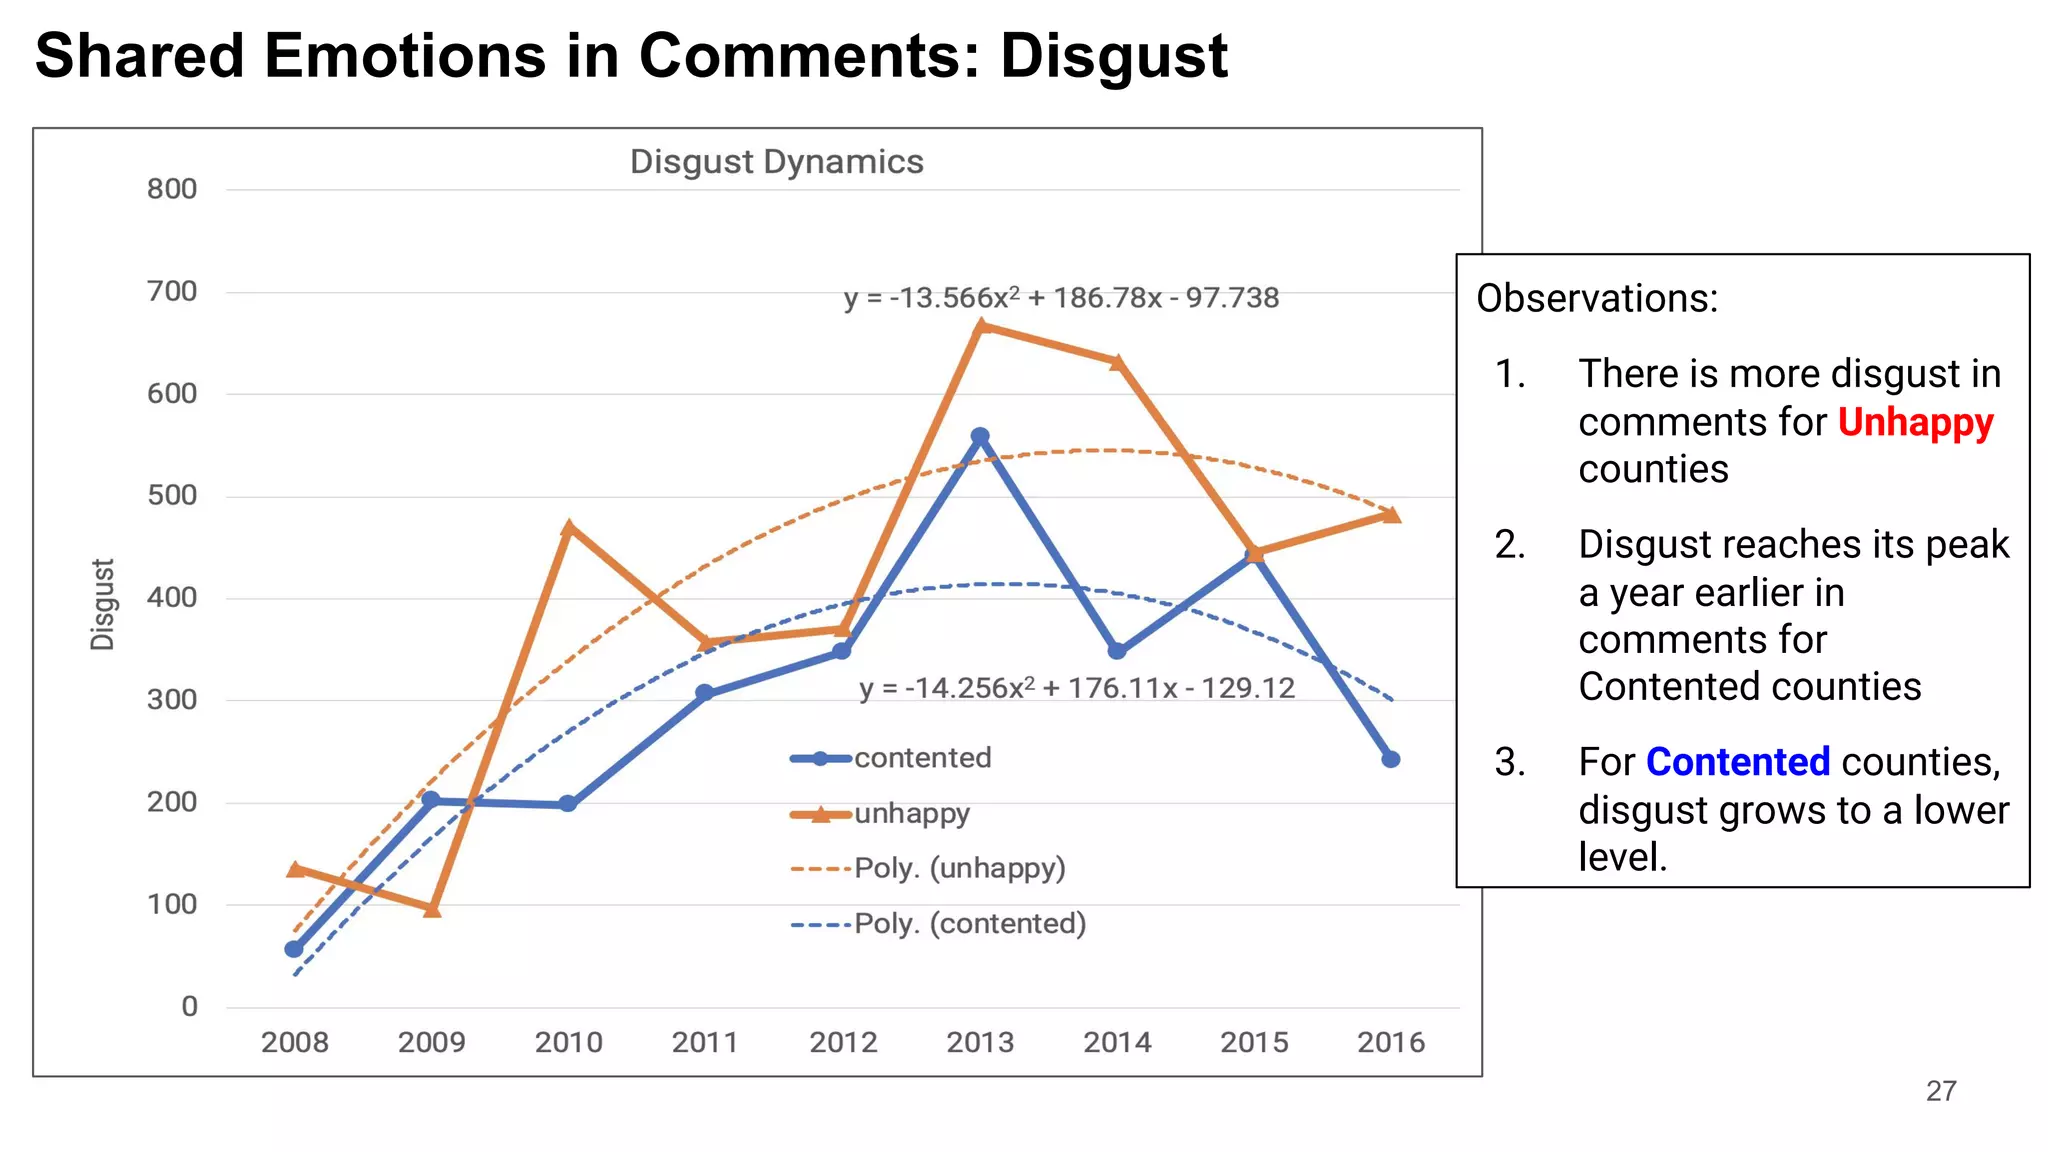


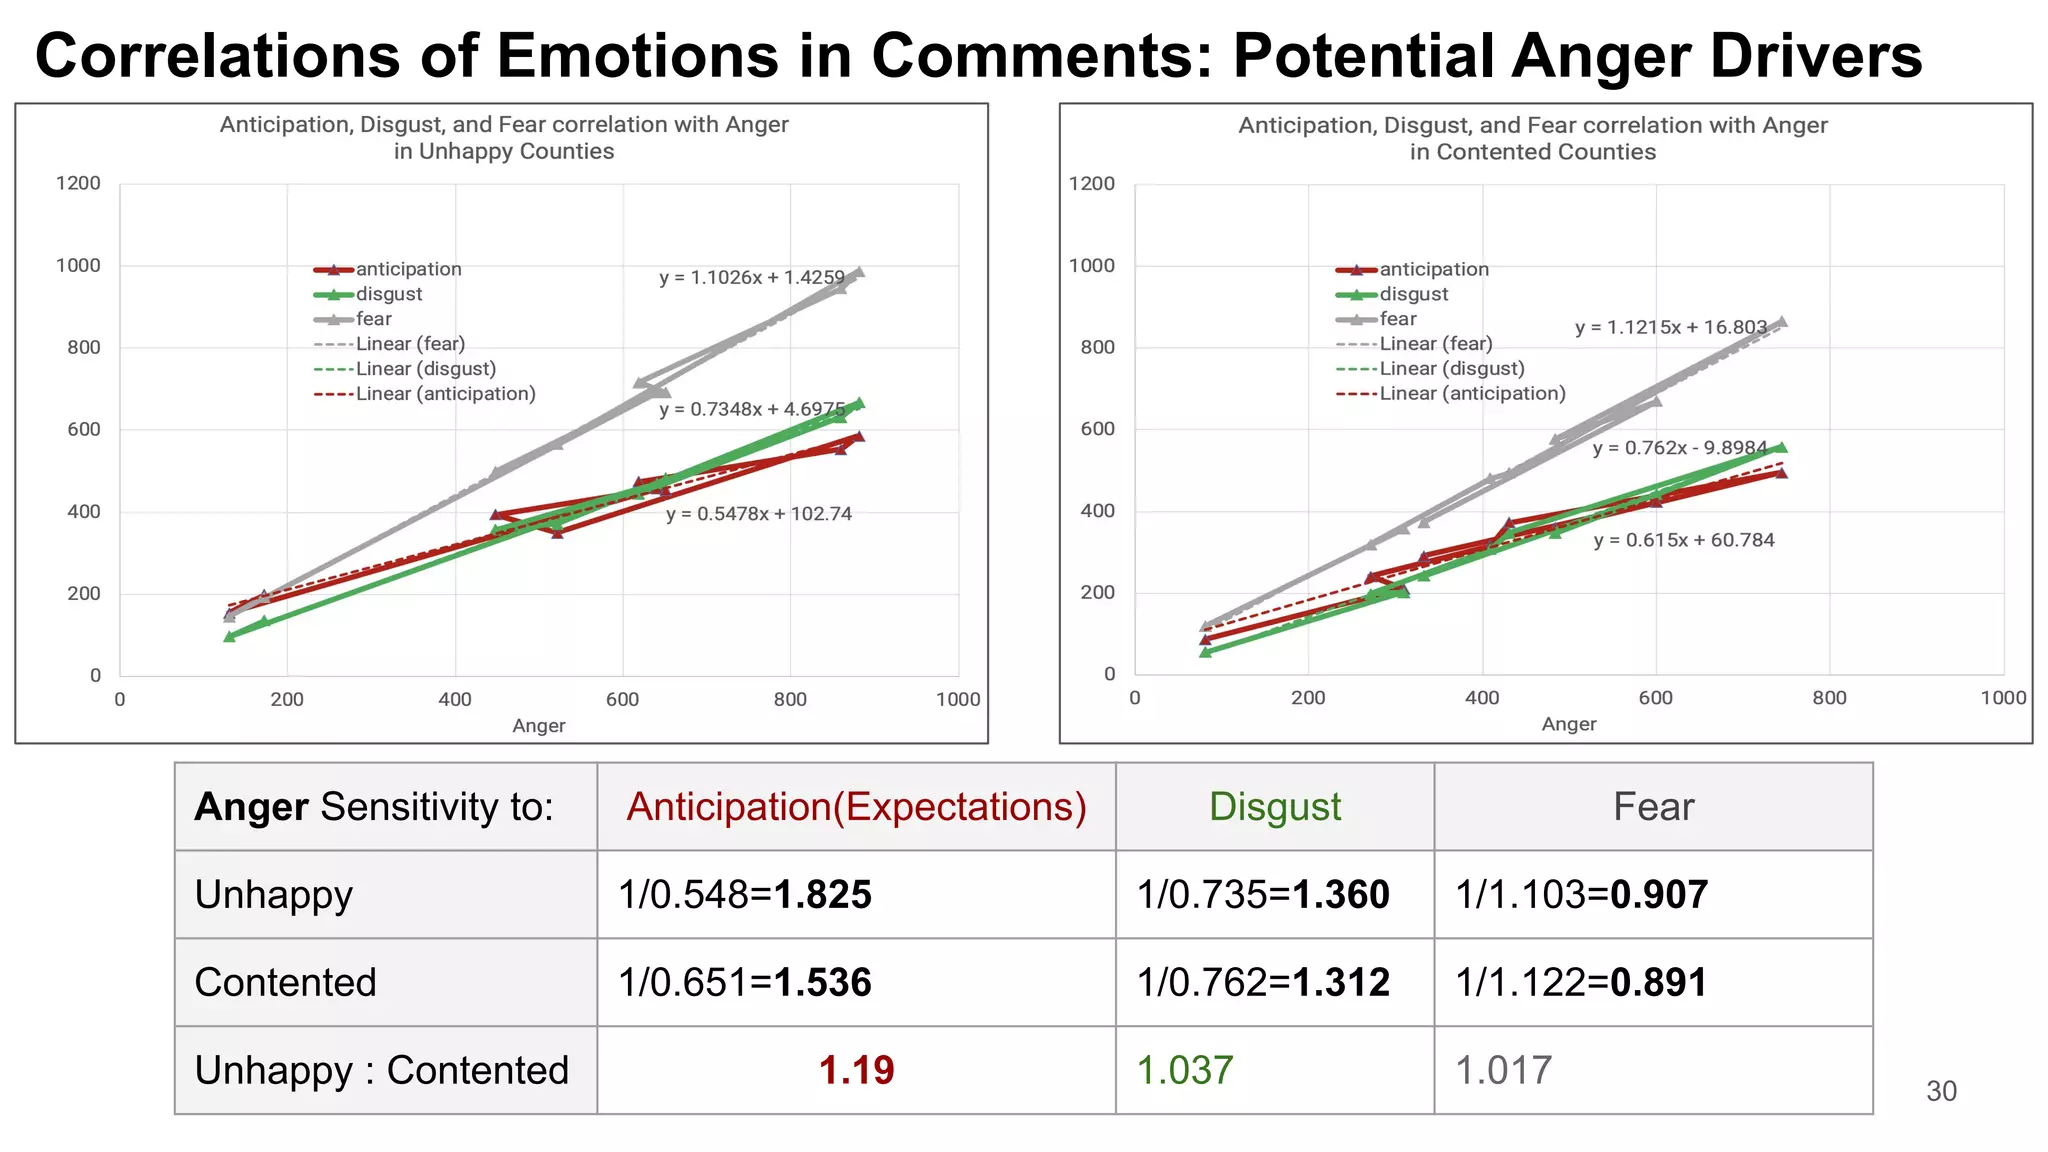

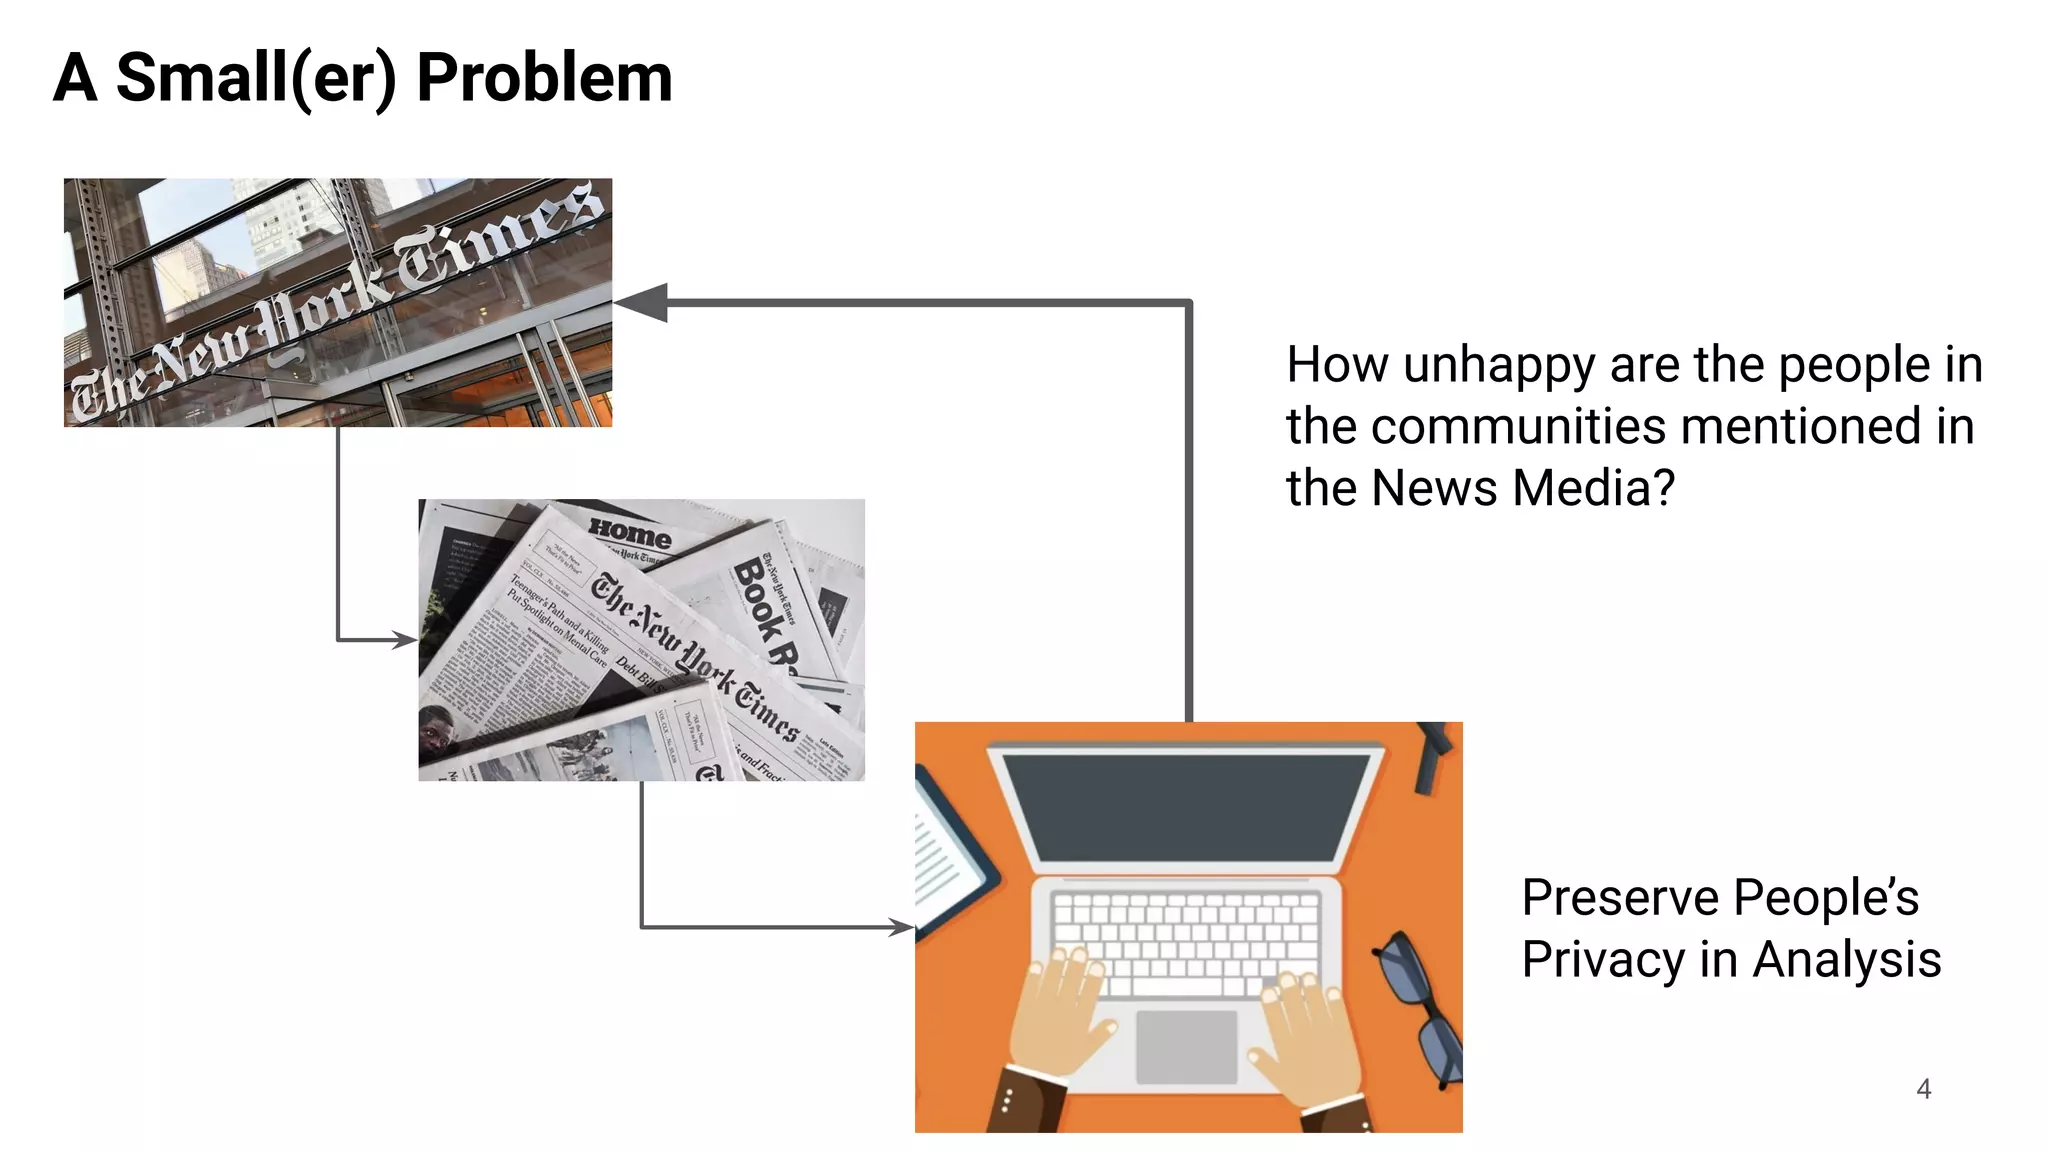
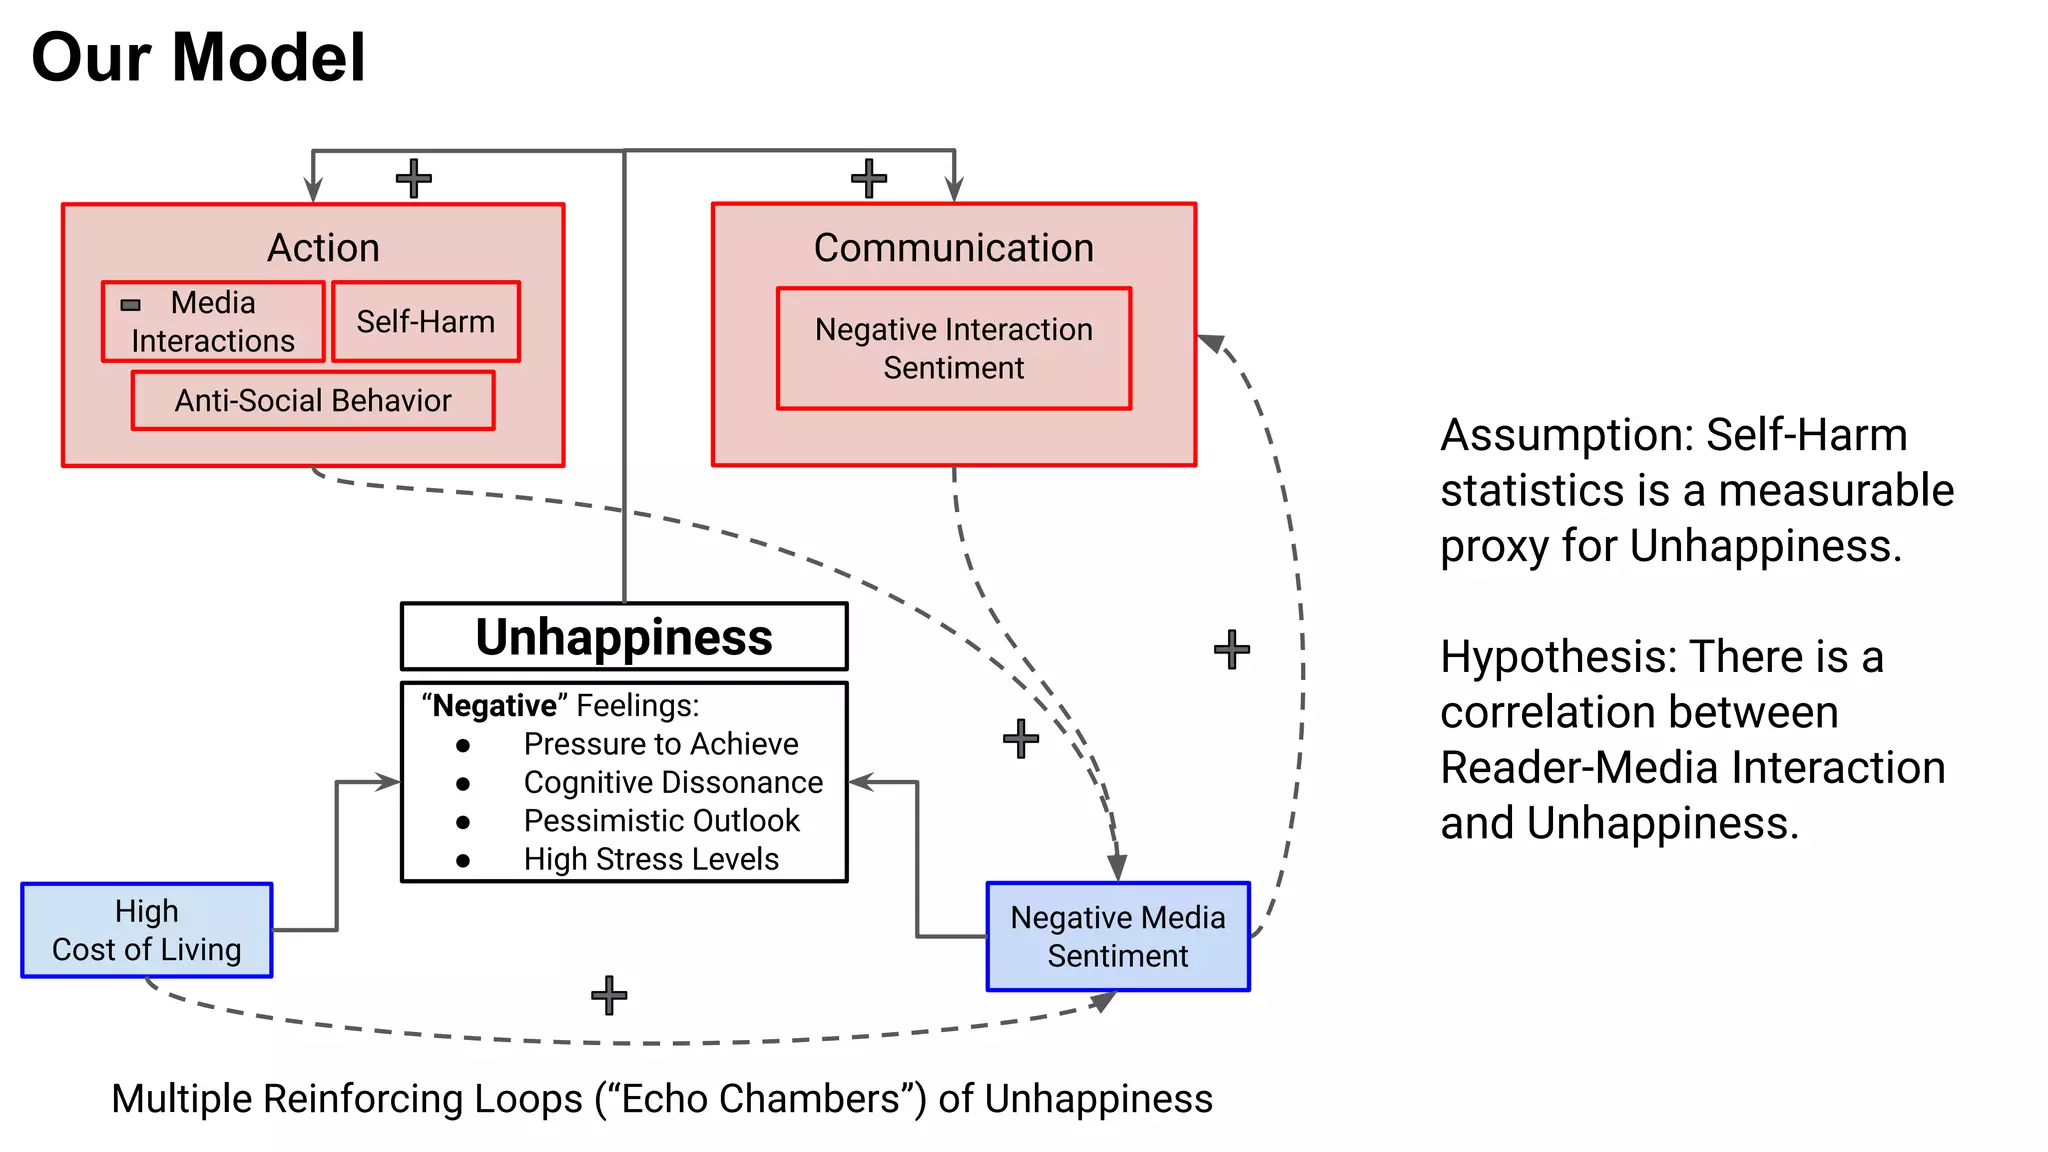
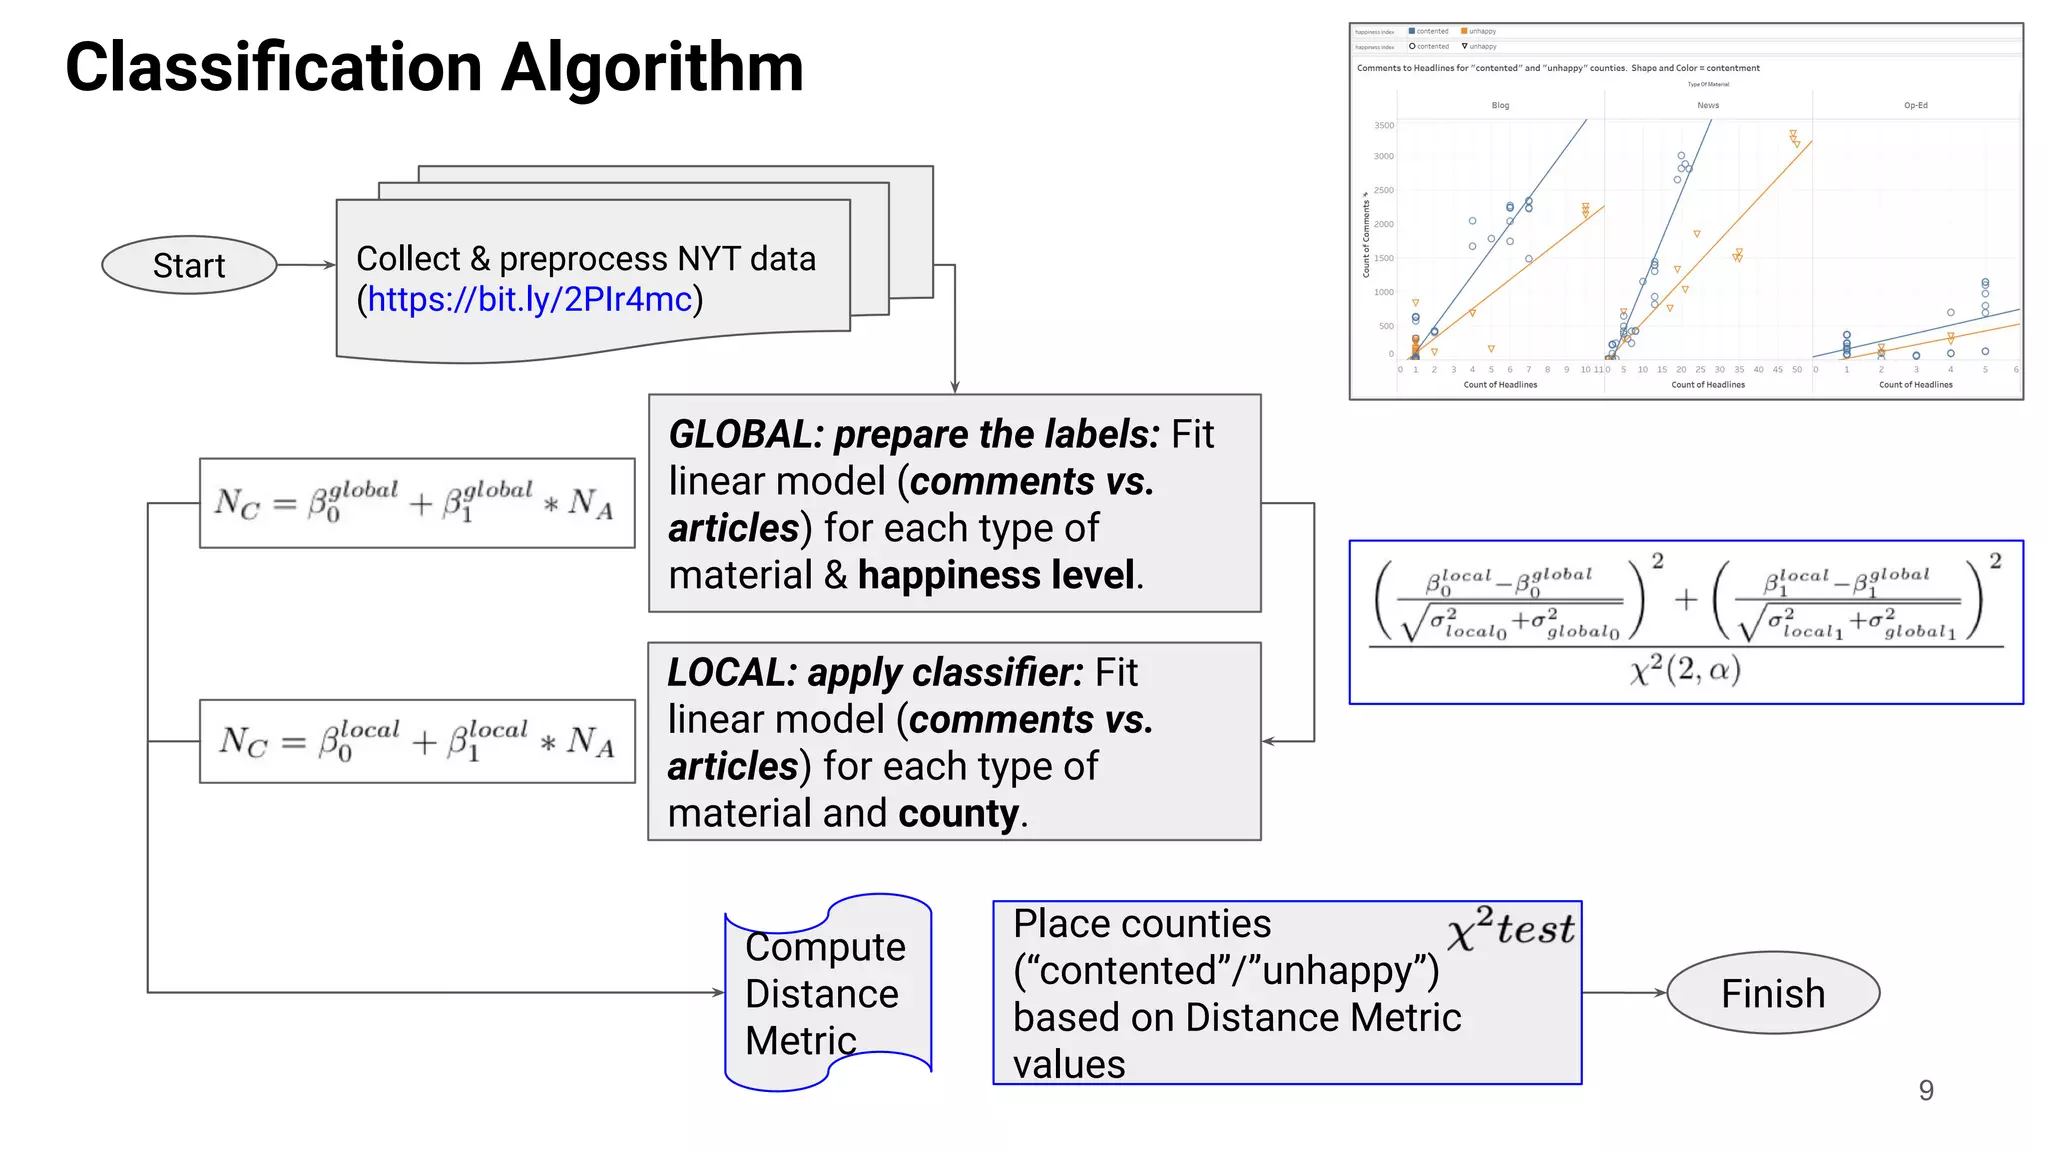
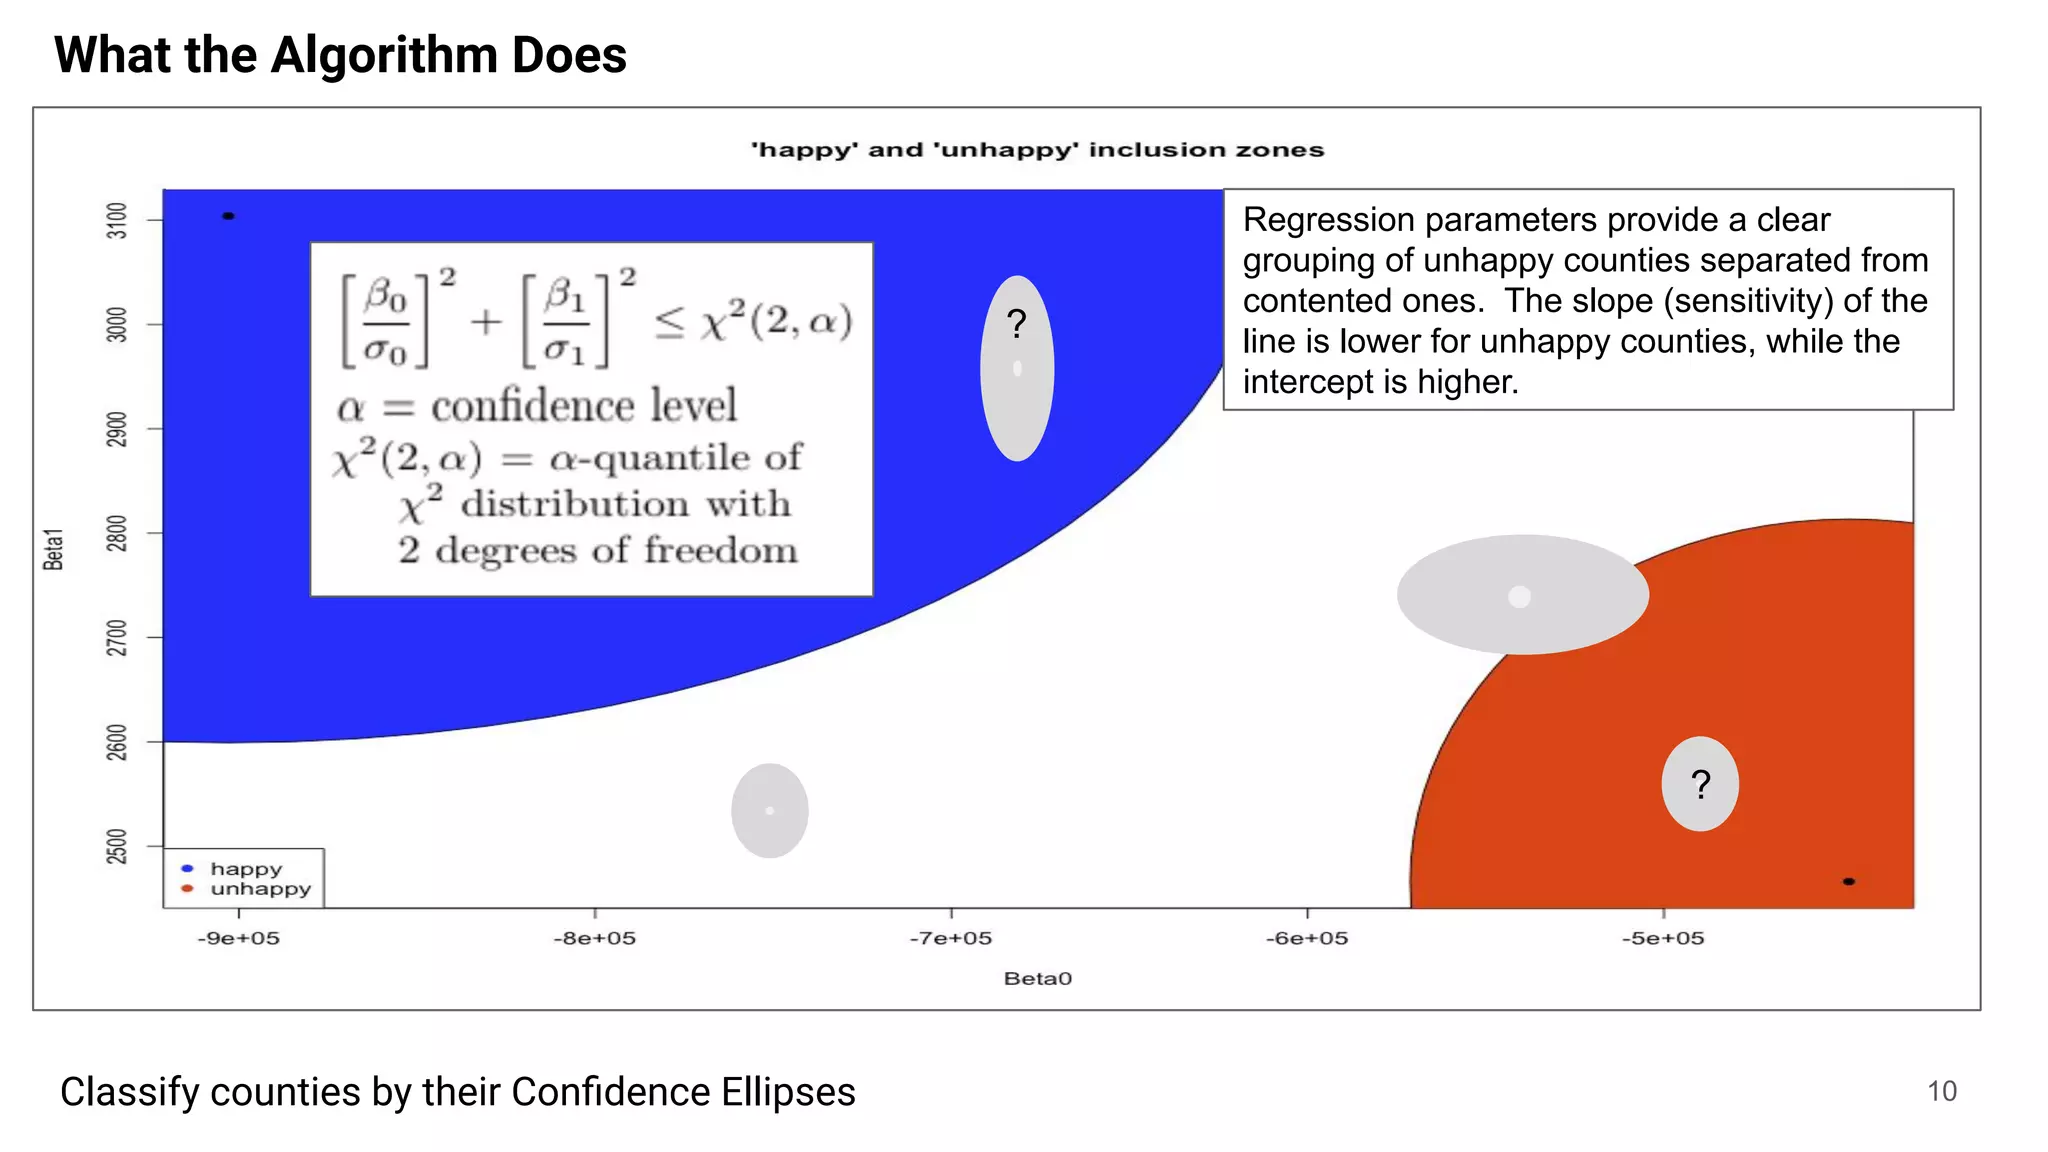
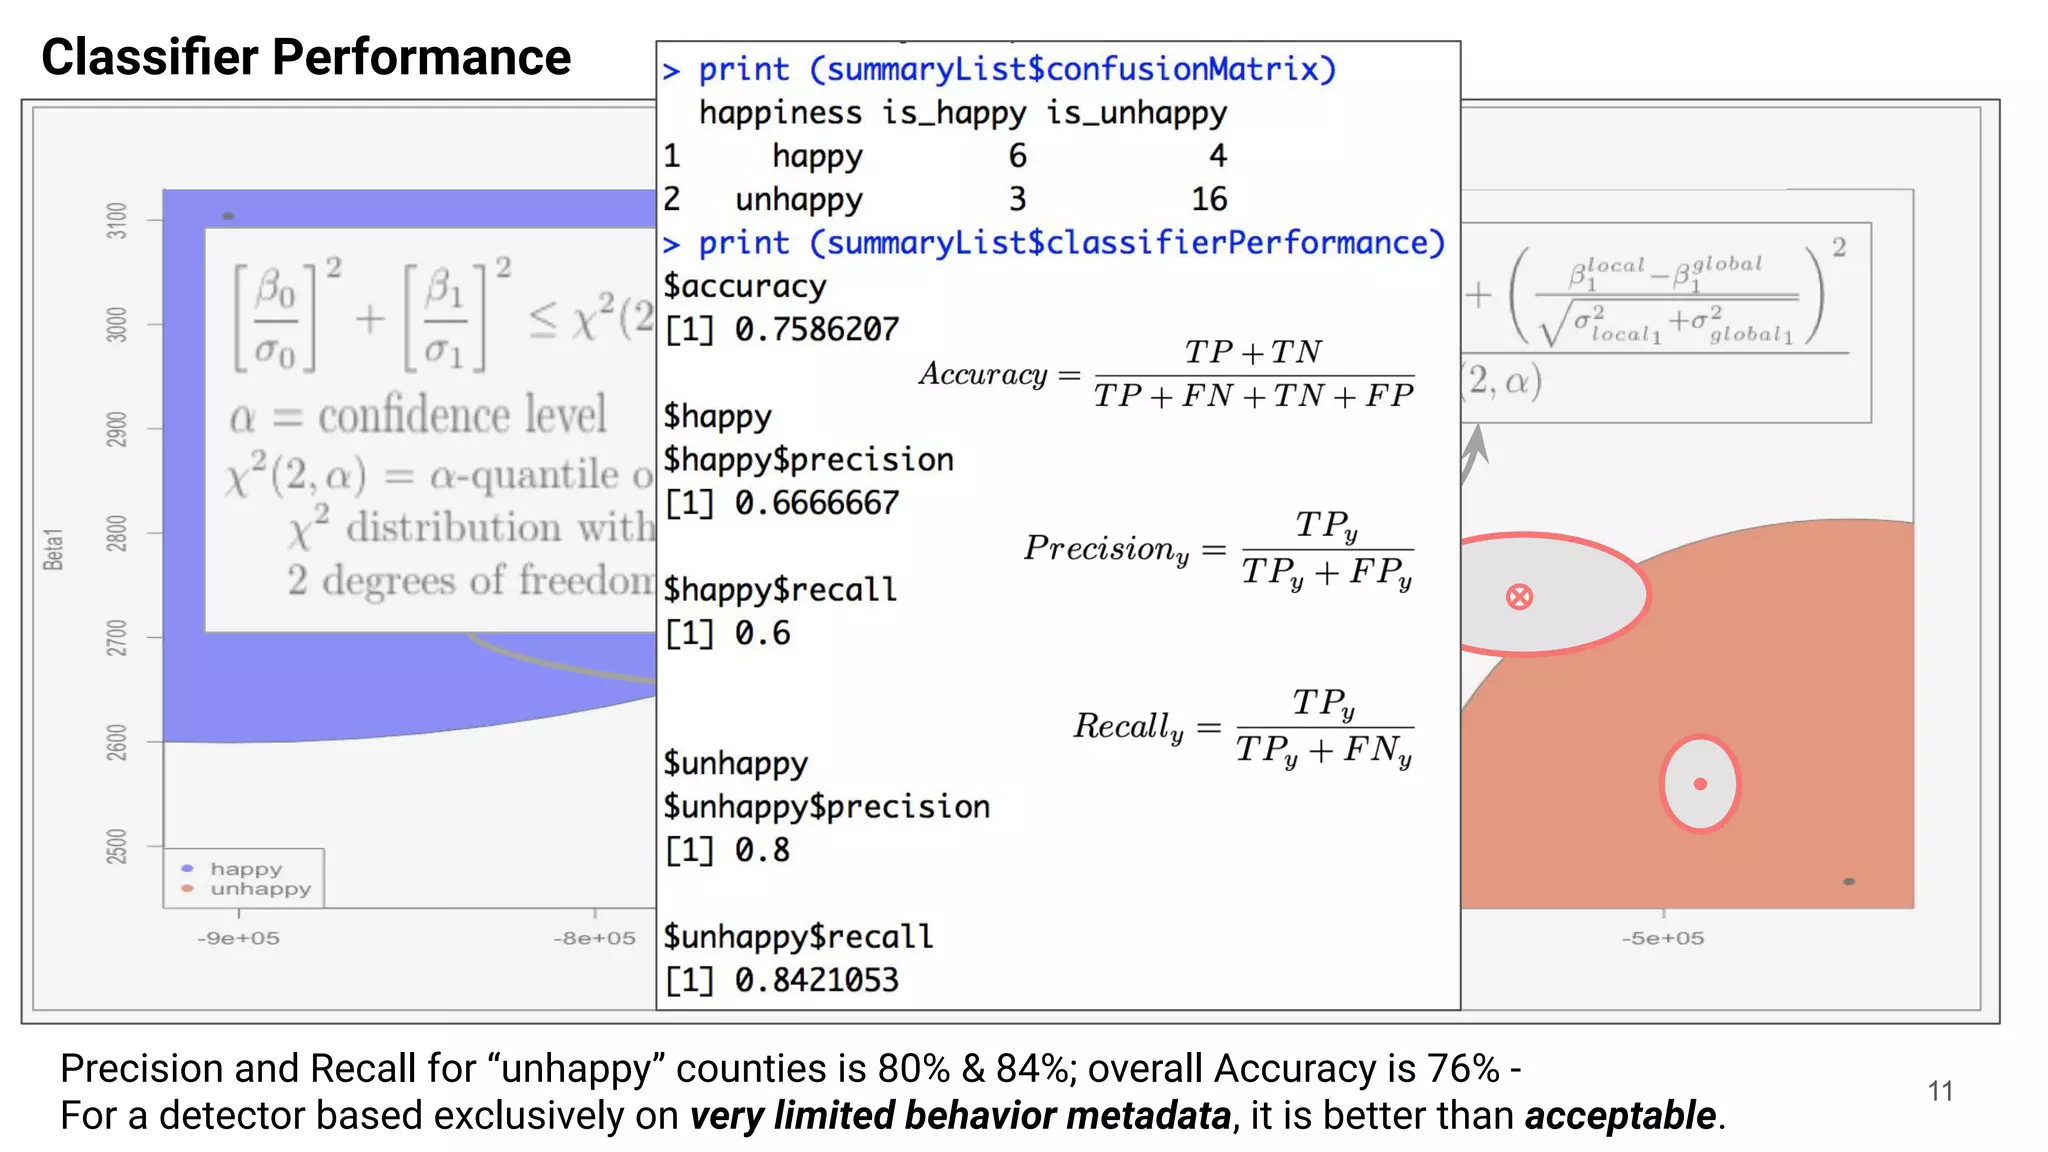
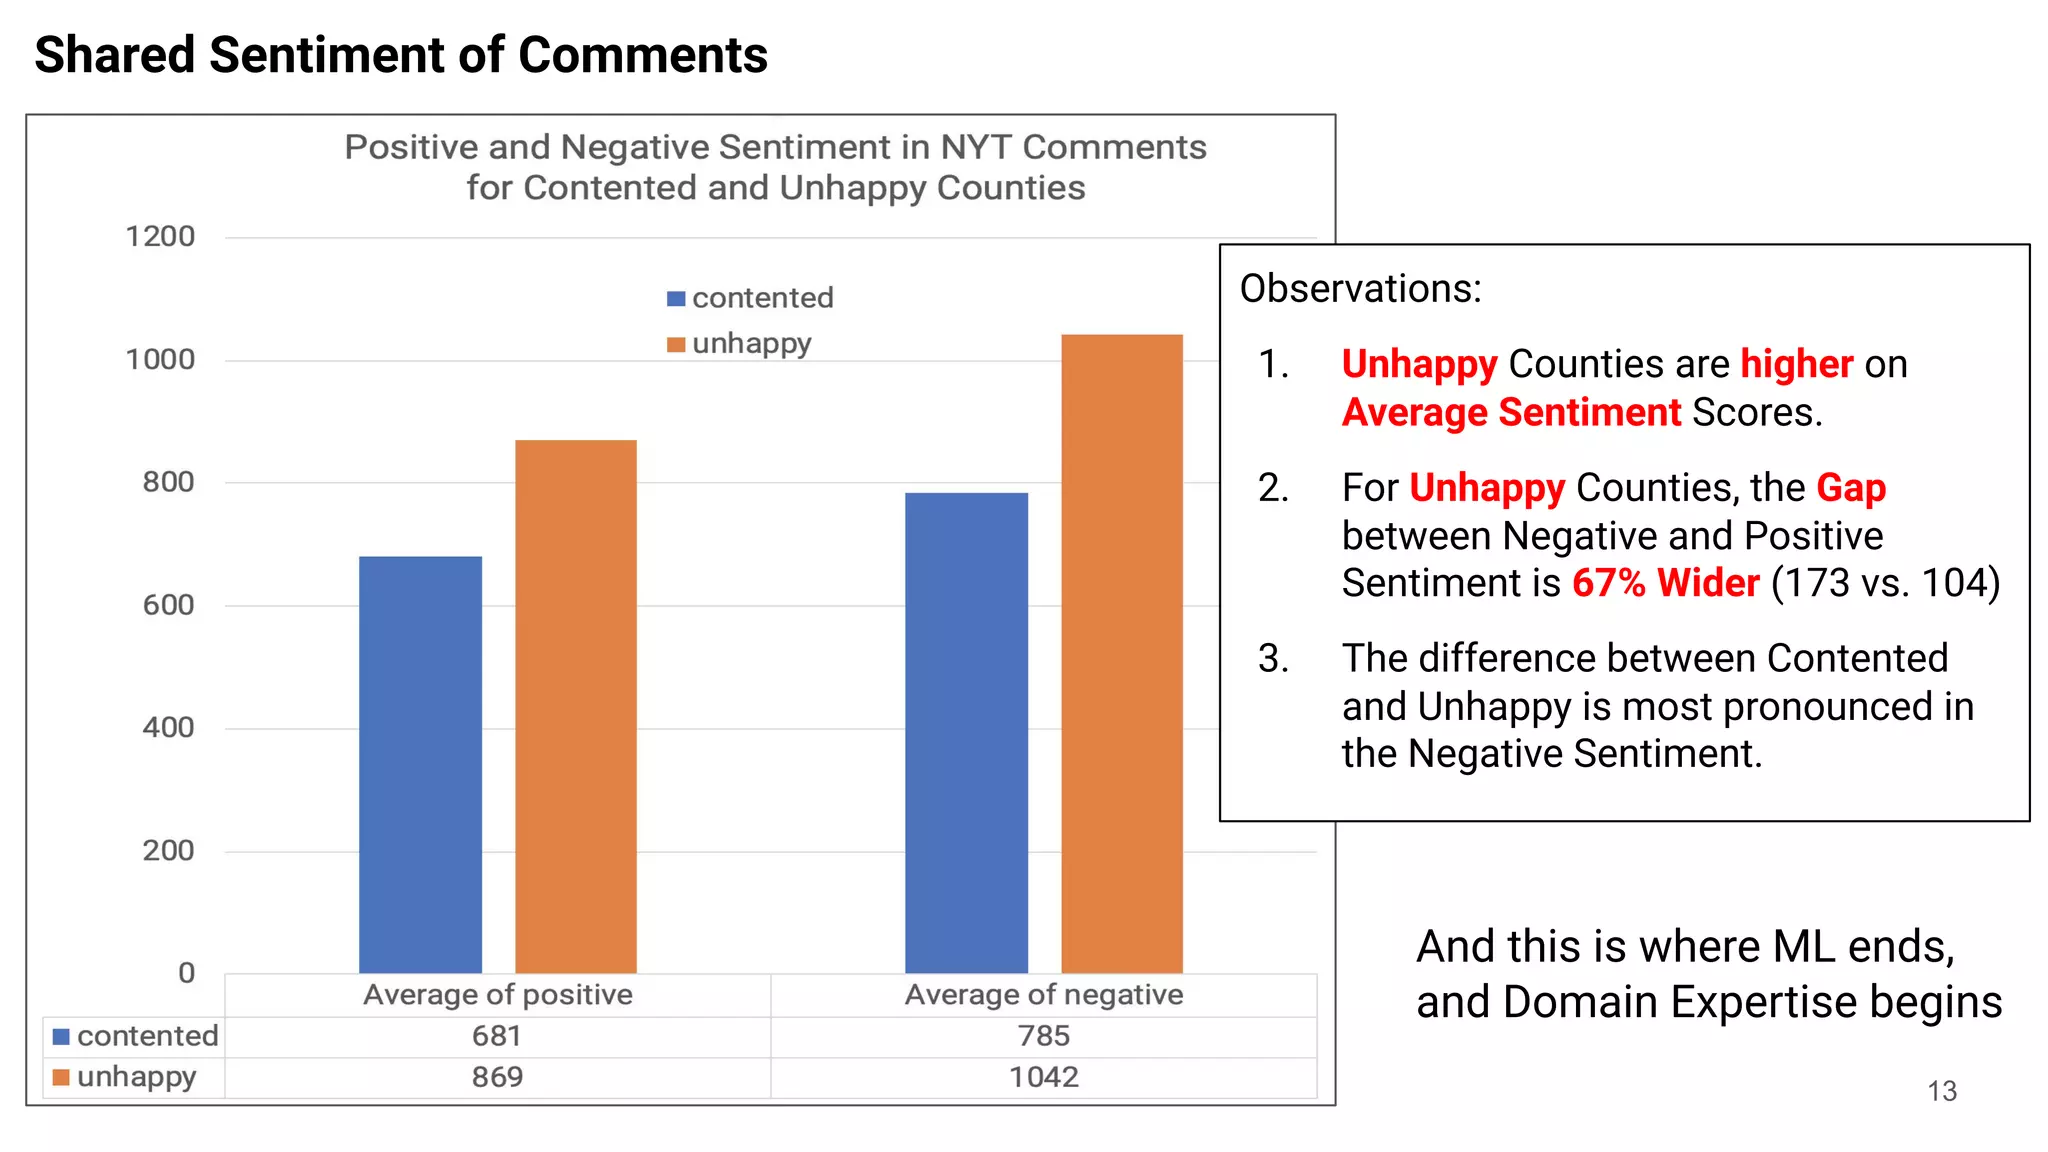
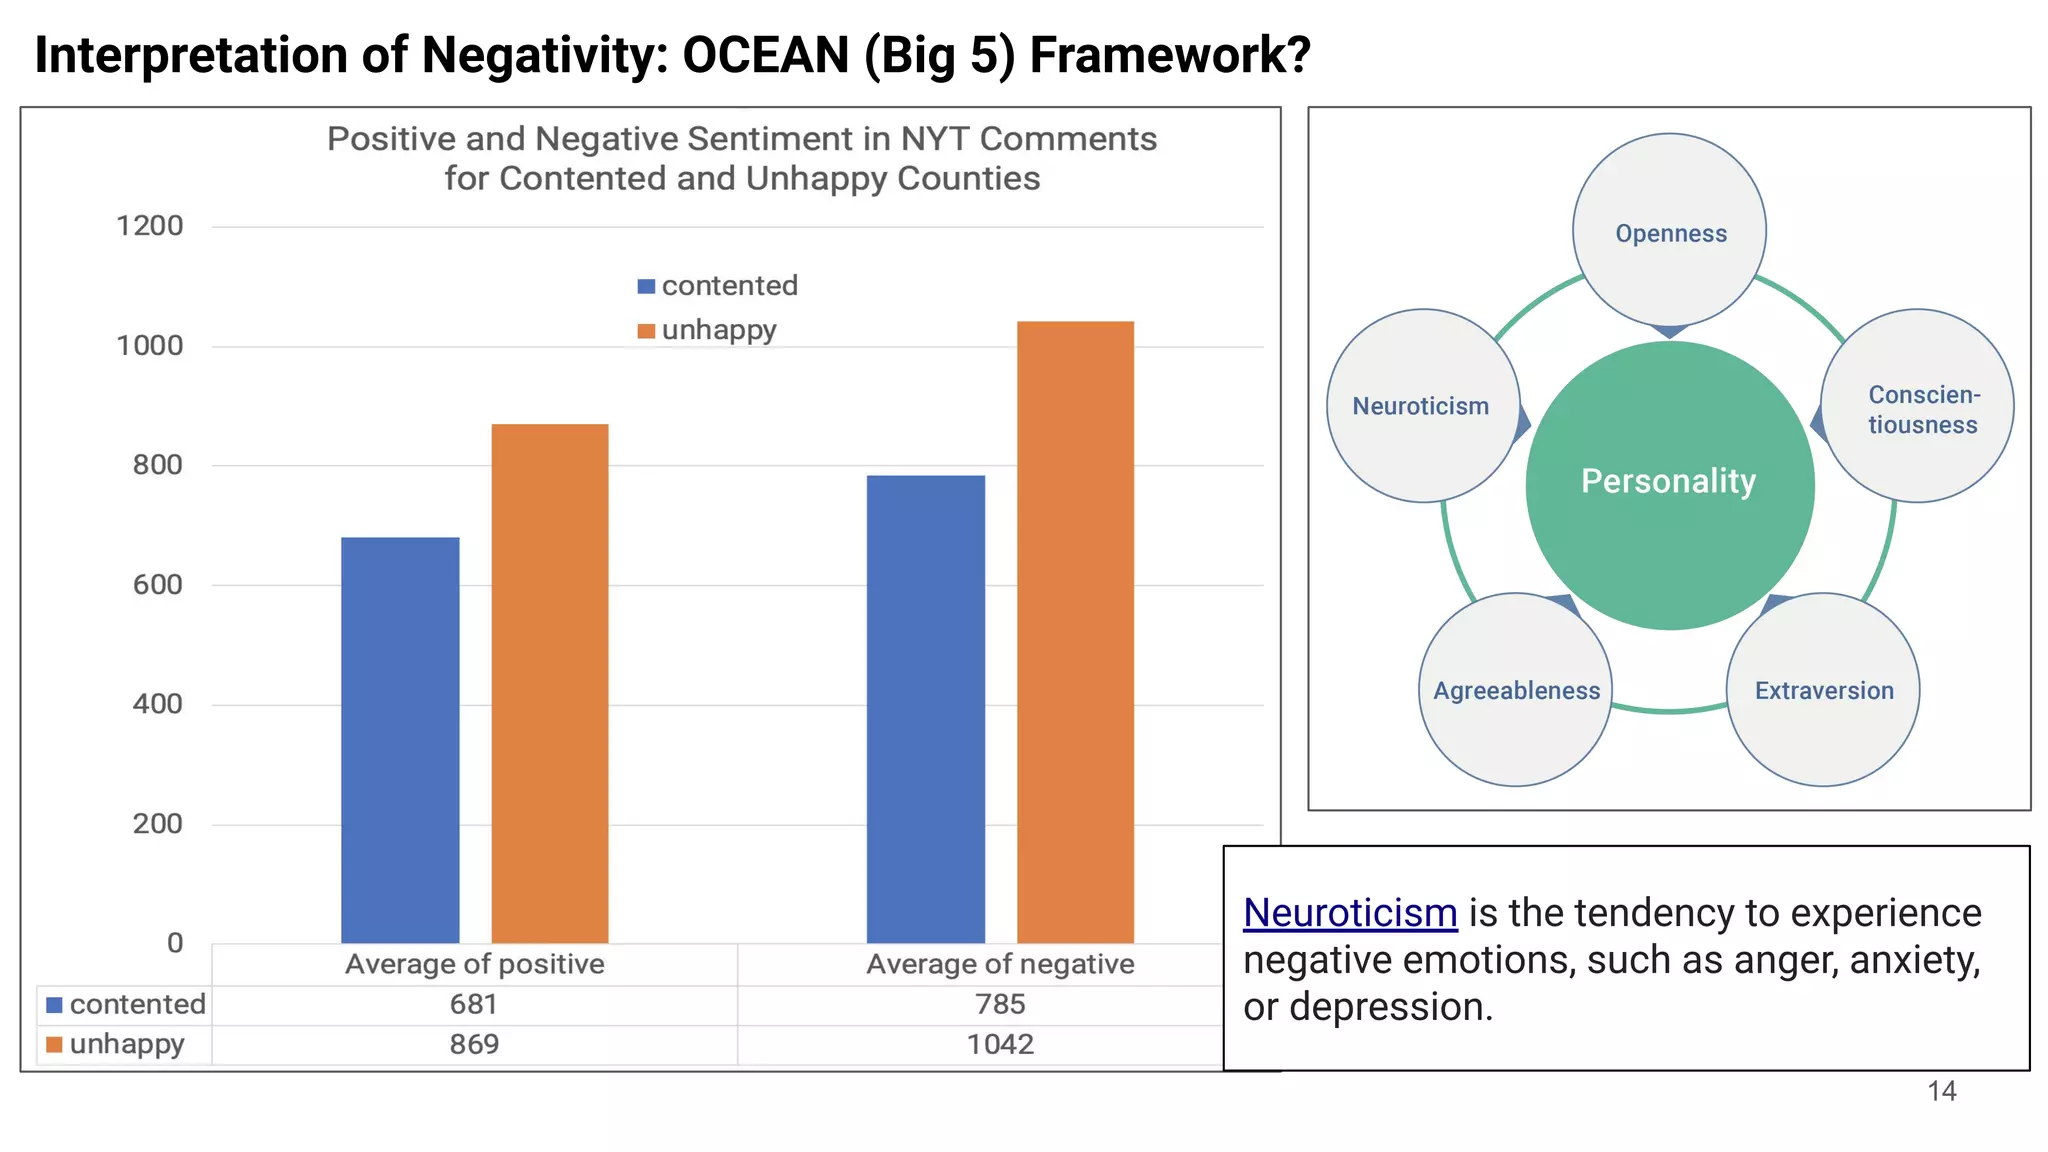
This document discusses using machine learning and data mining techniques to identify unhappy communities based on reader comments to news media articles. The researchers collected and preprocessed New York Times data, then used a classification algorithm to place counties into "contented" or "unhappy" groups based on the sentiment and emotions expressed in the comments over time. Their analysis found that comments from "unhappy" counties expressed more negative sentiments like sadness, fear, anger and disgust compared to "contented" counties. The researchers believe continuing to analyze sentiment and emotions in the comments can help further improve their classifier and provide insights into the root causes of unhappiness.


![[DSC Europe 25] Dusan Nesic - Securing Tomorrow’s Infrastructure: Why Cyber-P...](https://cdn.slidesharecdn.com/ss_thumbnails/qikbszfftyowjm2q6duw-1-251211083848-8f2ead6b-thumbnail.jpg?width=640&height=640&fit=bounds)
![[DSC Europe 25] Dunja Adzic Jovanovic - AI and Cybersecurity: Defending Data ...](https://cdn.slidesharecdn.com/ss_thumbnails/o1zylpbhrtwnixxq2xj8-7-251211083048-185086f6-thumbnail.jpg?width=640&height=640&fit=bounds)


![[DSC Europe 25] Branko Urosevic -Rethinking Financial Talent: Integrating Cod...](https://cdn.slidesharecdn.com/ss_thumbnails/8jjrus8ttko6qj64f58f-3-251212103250-642c6374-thumbnail.jpg?width=640&height=640&fit=bounds)

![[DSC Europe 25] Behzad Hosseini - AI Agents in the Wild: Deploying Models tha...](https://cdn.slidesharecdn.com/ss_thumbnails/3qtejajvsjqrzwfept2c-10-251212103250-7f2b1068-thumbnail.jpg?width=640&height=640&fit=bounds)
![[DSC Europe 25] Miodrag Pesovic & Vladislav Radonjic - Federated Data Archite...](https://cdn.slidesharecdn.com/ss_thumbnails/gsbe3y5it5uhndi4e08e-1-251212103249-f1008e0c-thumbnail.jpg?width=640&height=640&fit=bounds)


![[DSC Europe 25] Bassam Maharmeh - Artificial Intelligence: Opportunities and ...](https://cdn.slidesharecdn.com/ss_thumbnails/thhfmr2fqpawzj7hsjpg-5-251211083048-2c23204f-thumbnail.jpg?width=640&height=640&fit=bounds)


