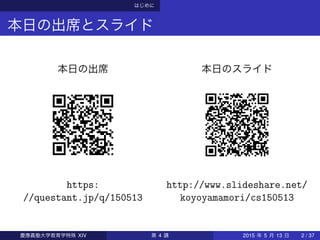
学級規模と学力
中学生[Krassel and Heinesen,2014]
方法
説明変数に GPA(いわゆ
る評定) を投入
目的変数に上級学力テ
スト
学級規模が小さいほど
受験する傾向にある
学校を固定効果として
扱う。
分断回帰デザイン
ment is just above a discontinuity point compared to just below (especially for values of
enrollment below about 100 where the density of enrollment is high), and the corre-
lation between class size and M is high.
The 2SLS estimator of the parameter of interest, bCS, may be interpreted as a
weighted average causal effect of changing class size in a more general model where
class-size effects are heterogeneous and nonlinear, given independence and monotoni-
city assumptions (Angrist and Imbens 1995): After control for other variables, the
instrument should be independent of individuals’ potential outcomes (potential GPA
given class size); and an increase in enrollment may not reduce the number of classes.
The independence assumption is crucial. Since M is a (discontinuous) function of
enrollment and enrollment may be correlated with educational outcomes for other
reasons than class size, it is essential to control for these other channels of correlation
between enrollment and outcomes. We use a rich set of control variables (for parental
background and other student specific characteristics, especially lagged academic
achievement) and we also control for SFE. In addition, we control for a smooth function
Figure 1. Average and predicted class size for each value of enrollment, and density of
enrollment.
Downloadedby[126.249.179.227]at18:1328April2015
慶應義塾大学教育学特殊 XIV 第 4 講 2015 年 5 月 13 日 15 / 37
学級規模と学力
中学生[Krassel and Heinesen,2014]
at the 10% level. For brevity, we do not show first-stage estimates, but the instrument
Table 4. Linear probability models of choosing all six advanced exams in mandatory subjects.
(1) (2) (3) (4) (5)
OLS OLS SFE IV IV, SFE
Class size/10 20.007 20.016 20.024∗
20.019 20.065+
(0.014) (0.012) (0.010) (0.026) (0.034)
GPA ninth grade (exam
marks)
0.201∗∗∗
0.192∗∗∗
0.201∗∗∗
0.192∗∗∗
(0.008) (0.007) (0.008) (0.007)
GPA ninth grade (year marks) 0.152∗∗∗
0.153∗∗∗
0.152∗∗∗
0.153∗∗∗
(0.006) (0.006) (0.006) (0.006)
R2
0.080 0.284 0.353 0.284 0.250
F-test, weak instrument 138.349 58.227
Schools 482 482 482 482 482
Observations 46,267 46,267 46,267 46,267 46,267
Notes: Robust standard errors clustered at schools in parentheses. In (5) R2
is from the regression using the
within-school transformed variables. All regressions include the control variables of Table 3.
+
p , 0.10.
∗
p , 0.05.
∗∗
p , 0.01.
∗∗∗
p , 0.001.
K.F. Krassel and E. Heinesen422
慶應義塾大学教育学特殊 XIV 第 4 講 2015 年 5 月 13 日 17 / 37
18.
学級規模と学力
中学生[Krassel and Heinesen,2014]
induce schools to reduce class size, which will bias the estimated class-size effect
Table 5. Regression models of GPA from advanced exams in mandatory subjects.
(1) (2) (3) (4) (5)
OLS OLS SFE IV IV, SFE
Class size/10 0.008 20.012 20.015 20.035 20.080∗
(0.013) (0.010) (0.012) (0.021) (0.035)
GPA ninth grade (exam marks) 0.660∗∗∗
0.654∗∗∗
0.660∗∗∗
0.653∗∗∗
(0.008) (0.008) (0.008) (0.008)
GPA ninth grade (year marks) 0.232∗∗∗
0.250∗∗∗
0.233∗∗∗
0.251∗∗∗
(0.008) (0.007) (0.008) (0.007)
R2
0.086 0.637 0.657 0.637 0.633
F-test, weak instrument 119.474 56.622
Schools 471 471 471 471 471
Observations 29,184 29,184 29,184 29,184 29,184
Notes: Robust standard errors clustered at schools in parentheses. In (5) R2
is from the regression using the
within-school transformed variables. All regressions include the control variables of Table 3.
+
p , 0.10.
∗
p , 0.05.
∗∗
p , 0.01.
∗∗∗
p , 0.001.
Education Economics 423
慶應義塾大学教育学特殊 XIV 第 4 講 2015 年 5 月 13 日 18 / 37
学級規模と動機づけ等
非認知的能力[Dee and West,2011]
対象
米国 8 年生 815 校 19,396 人。
NELS:88 という大規模なデータセットを利用。
生徒の学校や指導の実施状況,家庭背景などを込みにした縦断
データ。
方法
マルチレベルモデリング
固定効果 (生徒,教師,学校) 制約の置き方で比較。
学級規模と非認知的能力との関連を検討するモデル。
AFraid to ASK questions in subject class を教科別に検討。
非認知的能力と学歴,就業との関連を検討。
慶應義塾大学教育学特殊 XIV 第 4 講 2015 年 5 月 13 日 21 / 37
22.
学級規模と動機づけ等
非認知的能力[Dee and West,2011]
結果
大規模学級の方が AFraid to ASK questions in subject class,
subject NOT USEful for my future, do NOt LooK ForwarD to
subject が高い,すなわち学習態度や学習観が悪い (Table 2)。
大規模学級の方が AFraid to ASK questions in subject class
が高い傾向は教科をまたいでいる (Table 4)。
AFraid to ASK questions in subject class, subject NOT
USEful for my future, do NOt LooK ForwarD が高いと学歴が
低くなる (Table 7) とともにフルタイムの就業や収入が低くな
る (Table 8)。
学級規模はひいては収入に影響。
なぜここまでリターン (とロス) が問題となるのか?
慶應義塾大学教育学特殊 XIV 第 4 講 2015 年 5 月 13 日 22 / 37
学級規模が児童生徒に与える影響を検討する視点
引用文献 I
[Bosworth, 2014]Bosworth, R. (2014).
Class size, class composition, and the distribution of student
achievement.
Education Economics, 22(2):141–165.
[Bosworth and Caliendo, 2007] Bosworth, R. and Caliendo, F.
(2007).
Educational production and teacher preferences.
Economics of Education Review, 26:487–500.
[Dee and West, 2011] Dee, T. S. and West, M. R. (2011).
The non-cognitive returns to class size.
Educational Evaluation and Policy Analysis, 33(1):23–46.
慶應義塾大学教育学特殊 XIV 第 4 講 2015 年 5 月 13 日 34 / 37
35.
学級規模が児童生徒に与える影響を検討する視点
引用文献 II
[Hanushek, 2006]Hanushek, E. A. (2006).
School resources.
In Hanushek, E. A. and Welch, F., editors, Handbook of the
Economics of Education, Volume 2, pages 865–908. Elsevier,
Amsterdam.
[Jakobsson et al., 2013] Jakobsson, N., Persson, M., and
Svensson, M. (2013).
Class-size effects on adolescents’ mental health and
well-being in Swedish schools.
Education Economics, 21(3):248–263.
慶應義塾大学教育学特殊 XIV 第 4 講 2015 年 5 月 13 日 35 / 37
36.
学級規模が児童生徒に与える影響を検討する視点
引用文献 III
[Konstantopoulos andTraynor, 2014] Konstantopoulos, S. and
Traynor, A. (2014).
Class size effects on reading achievement using PIRLS data:
Evidence from Greece.
Teachers College Record, 116(2):1–29.
[Krassel and Heinesen, 2014] Krassel, K. F. and Heinesen, E.
(2014).
Class-size effects in secondary school.
Education Economics, 22(4):412–426.
[Lazear, 2001] Lazear, P. E. (2001).
Educational production.
The Quarterly Journal of Economics, 116:777–803.
慶應義塾大学教育学特殊 XIV 第 4 講 2015 年 5 月 13 日 36 / 37
37.
学級規模が児童生徒に与える影響を検討する視点
引用文献 IV
[Word etal., 1990] Word, E., Johnston, J., Bain, H. P., Fulton,
B. D., Zaharias, J. B., Achilles, C. M., Lintz, M. N., Folger, J.,
and Breda, C. (1990).
Student/Teacher Achievement Ratio (STAR) Tennessee’s K-3
class size study. Final summary report 1985-1990.
Tennessee Department of Education, Nashville, TN.
慶應義塾大学教育学特殊 XIV 第 4 講 2015 年 5 月 13 日 37 / 37

![学級規模と学力
小学校[Bosworth, 2014]
問題
1 先行研究では小規模学級の方が学力が高く学力差が小さい
傾向。
2 小規模学級への割り当てはランダムではない。
3 上記 2 の要因は上記 1 と交絡するのではないか。
目的
小規模学級への割り当てはランダムか。
小規模学級ほど学力が高いか (得点)。
小規模学級ほど学力差が小さいか (標準偏差)。
慶應義塾大学教育学特殊 XIV 第 4 講 2015 年 5 月 13 日 5 / 37](https://image.slidesharecdn.com/cs150513-150512104430-lva1-app6891/85/XIV-4-5-320.jpg)
![学級規模と学力
小学校[Bosworth, 2014]
対象
米国ノースカロライナ州の 4, 5 年生。
NCRDC の大規模データセット。
方法
マルチレベルモデル
教師要因を固定
学校に差がない:変量効果 ある:固定効果
先生に差はない:変量効果 ある:固定効果
変量=ランダム
慶應義塾大学教育学特殊 XIV 第 4 講 2015 年 5 月 13 日 6 / 37](https://image.slidesharecdn.com/cs150513-150512104430-lva1-app6891/85/XIV-4-6-320.jpg)
![学級規模と学力
小学校[Bosworth, 2014]
結果
小規模学級への割り当てはランダムではない (Table 3)。
テスト得点は小規模学級の方が高い傾向 (Table 4)。
テスト得点は一人多いと標準偏差で 0.002 ∼ 0.005 低い
10 人では偏差値 0.2 ∼ 0.5 くらい。
テストの標準偏差は小規模学級の方が小さい傾向 (Table 8)。
一人多いと標準偏差で 0.02 くらい大きい。
10 人減ると 0.2 くらい小さくなる。
考察では指導方法の違いに言及
論点
last year score をモデルに投入する意義
学級規模による指導方法の違いと児童の個人差
慶應義塾大学教育学特殊 XIV 第 4 講 2015 年 5 月 13 日 7 / 37](https://image.slidesharecdn.com/cs150513-150512104430-lva1-app6891/85/XIV-4-7-320.jpg)
![学級規模と学力
小学校[Bosworth, 2014]
慶應義塾大学教育学特殊 XIV 第 4 講 2015 年 5 月 13 日 8 / 37](https://image.slidesharecdn.com/cs150513-150512104430-lva1-app6891/85/XIV-4-8-320.jpg)
![学級規模と学力
小学校[Bosworth, 2014]
慶應義塾大学教育学特殊 XIV 第 4 講 2015 年 5 月 13 日 9 / 37](https://image.slidesharecdn.com/cs150513-150512104430-lva1-app6891/85/XIV-4-9-320.jpg)
![学級規模と学力
小学校[Bosworth, 2014]
慶應義塾大学教育学特殊 XIV 第 4 講 2015 年 5 月 13 日 10 / 37](https://image.slidesharecdn.com/cs150513-150512104430-lva1-app6891/85/XIV-4-10-320.jpg)
![学級規模と学力
読書力[Konstantopoulos and Traynor, 2014]
問題
実験研究 (RCT) ではなく調査研究では学級規模が学力に与え
る影響についての結果がまちまち (クラスサイズパズ
ル)[Bosworth and Caliendo, 2007, Lazear, 2001]
実験的研究 (STAR) のデータは古く現状がよくわからない
[Word et al., 1990]
目的
操作変数法 (instrumental variables (IV) method) で推定。
学級規模が読書力に与える影響を検討。
対象
ギリシャの小 4 の PIRLS データ
慶應義塾大学教育学特殊 XIV 第 4 講 2015 年 5 月 13 日 11 / 37](https://image.slidesharecdn.com/cs150513-150512104430-lva1-app6891/85/XIV-4-11-320.jpg)
![学級規模と学力
読書力[Konstantopoulos and Traynor, 2014]
方法
マルチレベルモデル
操作変数法 (回帰係数に影響を与えると考えられる変数をモデ
ルに投入して当該回帰係数を正しく見積もろうとする)
結果
操作変数を投入したモデルでは学級規模が読書力に影響を与
えるとは示唆されず。
論点
このような結果となったのはどういうことが背景にある
のだろうか?
慶應義塾大学教育学特殊 XIV 第 4 講 2015 年 5 月 13 日 12 / 37](https://image.slidesharecdn.com/cs150513-150512104430-lva1-app6891/85/XIV-4-12-320.jpg)
![学級規模と学力
読書力[Konstantopoulos and Traynor, 2014]
慶應義塾大学教育学特殊 XIV 第 4 講 2015 年 5 月 13 日 13 / 37](https://image.slidesharecdn.com/cs150513-150512104430-lva1-app6891/85/XIV-4-13-320.jpg)
![学級規模と学力
中学生[Krassel and Heinesen, 2014]
問題
調査研究では学級規模が学力に与える影響についての結果が
まちまち (クラスサイズパズ
ル)[Bosworth and Caliendo, 2007, Lazear, 2001]
中学生を対象とした研究は珍しい。
目的
小規模学級ほど学力が高いか (得点)。
適切な推定結果を得るための分析手法の適用。
対象
2002 ∼ 07 年までのデンマークの 10 年生。
慶應義塾大学教育学特殊 XIV 第 4 講 2015 年 5 月 13 日 14 / 37](https://image.slidesharecdn.com/cs150513-150512104430-lva1-app6891/85/XIV-4-14-320.jpg)
![学級規模と学力
中学生[Krassel and Heinesen, 2014]
方法
説明変数に GPA(いわゆ
る評定) を投入
目的変数に上級学力テ
スト
学級規模が小さいほど
受験する傾向にある
学校を固定効果として
扱う。
分断回帰デザイン
ment is just above a discontinuity point compared to just below (especially for values of
enrollment below about 100 where the density of enrollment is high), and the corre-
lation between class size and M is high.
The 2SLS estimator of the parameter of interest, bCS, may be interpreted as a
weighted average causal effect of changing class size in a more general model where
class-size effects are heterogeneous and nonlinear, given independence and monotoni-
city assumptions (Angrist and Imbens 1995): After control for other variables, the
instrument should be independent of individuals’ potential outcomes (potential GPA
given class size); and an increase in enrollment may not reduce the number of classes.
The independence assumption is crucial. Since M is a (discontinuous) function of
enrollment and enrollment may be correlated with educational outcomes for other
reasons than class size, it is essential to control for these other channels of correlation
between enrollment and outcomes. We use a rich set of control variables (for parental
background and other student specific characteristics, especially lagged academic
achievement) and we also control for SFE. In addition, we control for a smooth function
Figure 1. Average and predicted class size for each value of enrollment, and density of
enrollment.
Downloadedby[126.249.179.227]at18:1328April2015
慶應義塾大学教育学特殊 XIV 第 4 講 2015 年 5 月 13 日 15 / 37](https://image.slidesharecdn.com/cs150513-150512104430-lva1-app6891/85/XIV-4-15-320.jpg)
![学級規模と学力
中学生[Krassel and Heinesen, 2014]
結果
小規模学級ほど上級テストの受験率は高い。
大規模学級ほどテスト得点が低い。
過去の学力や学校独自の特性などを考慮したモデルの意義。
論点
なぜ上級テストの結果を使うこととしたのか?
操作変数法と分断回帰デザインの意義は?
分断回帰デザインで見落とされている要因は何か?
慶應義塾大学教育学特殊 XIV 第 4 講 2015 年 5 月 13 日 16 / 37](https://image.slidesharecdn.com/cs150513-150512104430-lva1-app6891/85/XIV-4-16-320.jpg)
![学級規模と学力
中学生[Krassel and Heinesen, 2014]
at the 10% level. For brevity, we do not show first-stage estimates, but the instrument
Table 4. Linear probability models of choosing all six advanced exams in mandatory subjects.
(1) (2) (3) (4) (5)
OLS OLS SFE IV IV, SFE
Class size/10 20.007 20.016 20.024∗
20.019 20.065+
(0.014) (0.012) (0.010) (0.026) (0.034)
GPA ninth grade (exam
marks)
0.201∗∗∗
0.192∗∗∗
0.201∗∗∗
0.192∗∗∗
(0.008) (0.007) (0.008) (0.007)
GPA ninth grade (year marks) 0.152∗∗∗
0.153∗∗∗
0.152∗∗∗
0.153∗∗∗
(0.006) (0.006) (0.006) (0.006)
R2
0.080 0.284 0.353 0.284 0.250
F-test, weak instrument 138.349 58.227
Schools 482 482 482 482 482
Observations 46,267 46,267 46,267 46,267 46,267
Notes: Robust standard errors clustered at schools in parentheses. In (5) R2
is from the regression using the
within-school transformed variables. All regressions include the control variables of Table 3.
+
p , 0.10.
∗
p , 0.05.
∗∗
p , 0.01.
∗∗∗
p , 0.001.
K.F. Krassel and E. Heinesen422
慶應義塾大学教育学特殊 XIV 第 4 講 2015 年 5 月 13 日 17 / 37](https://image.slidesharecdn.com/cs150513-150512104430-lva1-app6891/85/XIV-4-17-320.jpg)
![学級規模と学力
中学生[Krassel and Heinesen, 2014]
induce schools to reduce class size, which will bias the estimated class-size effect
Table 5. Regression models of GPA from advanced exams in mandatory subjects.
(1) (2) (3) (4) (5)
OLS OLS SFE IV IV, SFE
Class size/10 0.008 20.012 20.015 20.035 20.080∗
(0.013) (0.010) (0.012) (0.021) (0.035)
GPA ninth grade (exam marks) 0.660∗∗∗
0.654∗∗∗
0.660∗∗∗
0.653∗∗∗
(0.008) (0.008) (0.008) (0.008)
GPA ninth grade (year marks) 0.232∗∗∗
0.250∗∗∗
0.233∗∗∗
0.251∗∗∗
(0.008) (0.007) (0.008) (0.007)
R2
0.086 0.637 0.657 0.637 0.633
F-test, weak instrument 119.474 56.622
Schools 471 471 471 471 471
Observations 29,184 29,184 29,184 29,184 29,184
Notes: Robust standard errors clustered at schools in parentheses. In (5) R2
is from the regression using the
within-school transformed variables. All regressions include the control variables of Table 3.
+
p , 0.10.
∗
p , 0.05.
∗∗
p , 0.01.
∗∗∗
p , 0.001.
Education Economics 423
慶應義塾大学教育学特殊 XIV 第 4 講 2015 年 5 月 13 日 18 / 37](https://image.slidesharecdn.com/cs150513-150512104430-lva1-app6891/85/XIV-4-18-320.jpg)
![学級規模と動機づけ等
非認知的能力[Dee and West, 2011]
問題
低所得層やマイノリティの児童の学力に正の影響 (Krueger,
2003)
小規模学級はコストに見合うのか [Hanushek, 2006]
学力ではなく「非認知的能力」と呼ばれる要因 (動機づけや学
習態度等) が個人の将来の成否に影響 (Heckman が代表的)。
学力を「認知的」と呼び対照させている。
目的
学級規模の大小による非認知的能力の違い。
非認知的能力とその後の学歴や従事状況との関係。
学級規模の大小の成人後の影響。
慶應義塾大学教育学特殊 XIV 第 4 講 2015 年 5 月 13 日 20 / 37](https://image.slidesharecdn.com/cs150513-150512104430-lva1-app6891/85/XIV-4-20-320.jpg)
![学級規模と動機づけ等
非認知的能力[Dee and West, 2011]
対象
米国 8 年生 815 校 19,396 人。
NELS:88 という大規模なデータセットを利用。
生徒の学校や指導の実施状況,家庭背景などを込みにした縦断
データ。
方法
マルチレベルモデリング
固定効果 (生徒,教師,学校) 制約の置き方で比較。
学級規模と非認知的能力との関連を検討するモデル。
AFraid to ASK questions in subject class を教科別に検討。
非認知的能力と学歴,就業との関連を検討。
慶應義塾大学教育学特殊 XIV 第 4 講 2015 年 5 月 13 日 21 / 37](https://image.slidesharecdn.com/cs150513-150512104430-lva1-app6891/85/XIV-4-21-320.jpg)
![学級規模と動機づけ等
非認知的能力[Dee and West, 2011]
結果
大規模学級の方が AFraid to ASK questions in subject class,
subject NOT USEful for my future, do NOt LooK ForwarD to
subject が高い,すなわち学習態度や学習観が悪い (Table 2)。
大規模学級の方が AFraid to ASK questions in subject class
が高い傾向は教科をまたいでいる (Table 4)。
AFraid to ASK questions in subject class, subject NOT
USEful for my future, do NOt LooK ForwarD が高いと学歴が
低くなる (Table 7) とともにフルタイムの就業や収入が低くな
る (Table 8)。
学級規模はひいては収入に影響。
なぜここまでリターン (とロス) が問題となるのか?
慶應義塾大学教育学特殊 XIV 第 4 講 2015 年 5 月 13 日 22 / 37](https://image.slidesharecdn.com/cs150513-150512104430-lva1-app6891/85/XIV-4-22-320.jpg)
![学級規模と動機づけ等
非認知的能力[Dee and West, 2011]
TABLE 1
SampleMeans,NationalEducationLongitudinalStudyof1988(NELS:88) Base-YearSample
Standard
Variable Description Mean deviation Samplesize
NOTUSE Subjectnotusefulformyfuture 0.0018 0.9953 32,152
NOLKFD Do notlookforwardtosubject 0.0008 0.9945 32,246
AFASK Afraidtoaskquestionsinsubjectclass -0.0061 0.9936 32,197
DISRUPT Studentis frequentlydisruptive 0.1368 0.0019 33,018
INATT Studentis consistentlyinattentive 0.2255 0.0023 32,962
TRYH Frequencyoftryinghardinsubject(1stfollow-up) -0.0071 1.0012 18,612
STEST Testscoreinsubject 0.0219 0.9976 32,646
CLSSIZE Class size 24.5067 5.8675 33,162
OTHRACE Teacherofoppositerace/ethnicity 0.3172 0.0025 33,802
OTHSEX Teacherofoppositegender 0.5028 0.0025 33,802
SCERTIFD Teachercertifiedbystateinsubject 0.8838 0.0017 33,802
PCTLEP % classmateswithlimitedEnglishproficiency 0.0141 0.0718 31,362
SUBJECT1 English 0.2576 0.0024 33,802
SUBJECT2 History/socialstudiesclass 0.2424 0.0023 33,802
SUBJECT3 Mathematicsclass 0.2568 0.0024 33,802
SUBJECT4 Scienceclass 0.2432 0.0023 33,802
individualstudentsarebasedon binaryindica- identifiedas non-cognitiveskills(e.g.,terWeel,慶應義塾大学教育学特殊 XIV 第 4 講 2015 年 5 月 13 日 23 / 37](https://image.slidesharecdn.com/cs150513-150512104430-lva1-app6891/85/XIV-4-23-320.jpg)
![学級規模と動機づけ等
非認知的能力[Dee and West, 2011]
32
3
5
i
!•g
!
I
i
I
о
а
«M
S
1
?
t
I
I
■èа
sSì
1
§
1
sì
ЧО00ЧОCNCN^
^VOM^СП»Лцц
^ГП(N(NfOГ)+_,
ööоöömg
ФФencÑФ^ж
/-^сососо«-»-iй^2
*поооооI«wОООООс¿'о
оdооо$
^г?2ооS
§!§?§I
'S
ооотглmvo73Г4-СПСОО*-OSG
^Tj-f^oocomON-^
^СОCNCNСОСОCNi2
ООООООЧО^
ООо
^^^^^^^_^^_^^_^»Г)tí
^
^tCOCNCN'ít^HTr4
^^^^^^_^^_^^_^
^i
^-Nmmmгнririгн-~з^-N
Třooooooi
woooooo»oc¿
§3dddddd^g
.S|tbt^^Sí:222I§.S(N^ingSo§
SОООЯЯРäP.
gddd?OO
P.
ÖT3
gvotJ-cocN^-hoo¿
SЧОЮCM-1OO(Ntí
Uh^ГО^ûh-(N^tO'g
îu^COCNCNCOCOCNgH
4?dddddd^H^
£cÑT^^^co^o4^ьо/-nCOCOCO'-it-iCN'Г1ö
COOOOOOOl'С^^ppppooooü
dododoÇ:2
sls§§§I
ЧОCMTfmOnГ-Й
ЧОTfCNOCNсо^
Appoppo*S
dddddd^H'g
a§§§§g§¿e
ssggs!^°°°•°ss
¿¿¿?¿?i
Ö
00OnCNСОOSW4.2
00Tti-(CNCNVOa
'Loovo'ûгнгнo'25Oí
oo
qooHH(s
гнгн
g
dddddd«
vo*ot***^ot-os7is
^000000e?■
wpppppp^)-00
§g!§gsr.
Sv
1lïi««SI!I
siiaggruliîilftil
慶應義塾大学教育学特殊 XIV 第 4 講 2015 年 5 月 13 日 24 / 37](https://image.slidesharecdn.com/cs150513-150512104430-lva1-app6891/85/XIV-4-24-320.jpg)
![学級規模と動機づけ等
非認知的能力[Dee and West, 2011]
TABLE 4
NationalEducationLongitudinalStudyof1988(NELS:88): EstimatedEffectsofClass SizeonAFASKby
AcademicSubject
Changeindependentvariable
MathAFASK ReadingAFASK HistoryAFASK
Independent Baseline replacedby ScienceAFASK replacedby replacedby
variable measures science replacedbymath history reading
Classsize 0.0153*(0.0051) 0.0024(0.0044) 0.0145*(0.0051) 0.0145*(0.0051) 0.0109f(0.0051)
inmath
Classsize 0.0083*(0.0048) 0.0082*(0.0048) 0.0064(0.0053) 0.0045(0.0051) 0.0104*(0.0053)
inscience
Classsize 0.0201*(0.0053) 0.0171*(0.0050) 0.0170*(0.0054) 0.0104*(0.0055) 0.0103*(0.0053)
inEnglish
Classsize 0.0115f(0.0052) 0.0124f(0.0051) 0.0069(0.0060) 0.0111Ť(0.0052) 0.0040(0.0051)
inhistory
p value 0.3669 0.0920 0.3968 0.5666 0.1998
№ Pa/=
ßs= ߣ= Ря)
Note.Standarderrors,adjustedforschool-levelclustering,arereportedinparentheses.All modelsincludegender-specificsubjectfixedeffects
andstudentandteacherfixedeffects.
*
Statisticallysignificantatthe10% level.Statisticallysignificantatthe5% level.^Statisticallysignificantatthe1% level.
eighth-gradeclass size on engagementpersistHowever,theseestimatedeffectsareallrelatively慶應義塾大学教育学特殊 XIV 第 4 講 2015 年 5 月 13 日 25 / 37](https://image.slidesharecdn.com/cs150513-150512104430-lva1-app6891/85/XIV-4-25-320.jpg)
![学級規模と動機づけ等
非認知的能力[Dee and West, 2011]
j
I
t
I
1
î
|1
i
1§
I
S
I
s;
•S
1
Is:
о
1
îi
I
I
s?
w1S►JS
9I
^О'WO'trt
^©ddood
ms~/¿Г¿Г¿Г¿Г+Г+Zxxxs~/haО*«о«лm
СОЧОTfTfЧОЧО
WЮWЮ^Ф
q-hq-q-h
оооооо
SírT0sř^o4G1řT
4)ОООООО
О
W
t^^^HVÌОООО
13TfО^ООтГ(
йCNГ-ГОЧО*-нЧО
*5q^но»-ион
¿gсрооооо
Г-~ЧО«О
888ÖÖÖ
-ГIГIГIхх
Os»ПWì
СПV)-*t
qqq
iii
^S'^Ss^^
Г~-ЧОt-ЧОI-I-•
гп4^^^^^^XXX^-s^ноГ-CNOsCO
Tt»лTt^fNm
mo^toNо
qN|qnqn
ÖÖÖÖÖÖ
g^dòòòdòHjg^CN^^^^^^«OXX,~
5)
w
TtOOOONONÒŽ
LОГ-TlTfOЧО
ООfNО(SОfS'S
Uoöoöodя
t^оG4§t^г**чо55оооS
qqqБЬ
ооо'S
^ГIГIГIххè
Г-300О
TJ-Г^«О-о
qqq.2
999«iS
-2
IIISи
гТ^оо'оо'4^^4^*^
ÖÖÖÖÖÖöun
m^^^^^^XXX'~«
^^oooior-nst^^5
ЭOСЭCïgCD,-g
oöoöoöSg
^§s
*O^^^^*^^^^^^íC3^
i?öööööör-1*2ořTГГГГГГ°Яxx-II
jsssili|lадоооооо*отз
w^^^-gia
Г-TfЧОичо
«оu-rffeè:
8.88^s000aя
SSTII»I^^Даg8
»
gfâ
SS
g
|gI
???SI
gsI11li-
IIáegísgeliInull11
38
慶應義塾大学教育学特殊 XIV 第 4 講 2015 年 5 月 13 日 26 / 37](https://image.slidesharecdn.com/cs150513-150512104430-lva1-app6891/85/XIV-4-26-320.jpg)
![学級規模と動機づけ等
非認知的能力[Dee and West, 2011]
I
I
£
1I
f
I
I
Ì
I*-»Q
.О
I
j
Î
§
1
IÌ
I
¿
100*3
«Ì
3i
*-•On^tOn00u-
«ПCOCOCO*/-)Tt
S©оо©©
SSpsssod°ооо
гГÇ4«лГ^оо4оо4
лмmesюм
©©о©q©
^^©^¿©^©^©^©^
II§I§2Š
g^©°©©©с^
OS/-N^-v^-v^-^^-n/-^ч^
On^OnOnOnC^On1~h
OnfOOn©On(NOn
w2^isr^^ч
оо°©©©
/~'/-N/^V
mooi-i^4
en©ťNo
p©©iž
©©©s©
£ř1^ig1
*иï
s¡°i1
?
°
?1о
írTř^1í^400s00sí^4ît3
On00On000OOOft
^5^5^5^5^5^5,2
ОООООО«J
©^¿©^©^©^©^^
g^VÍT^ÍTrххххgГЛ^г*оос^со'с
Я«о©*о©»г.2
pSgS§S^S
odO©°©gH3
f^fřSřli
s:§§8888S.*
S!^sšššššš-s»
!ttltlUil1i-hOOOOOncOOn©OÛ-ÏÏ*
Д00ЧОt***14DГ4^^Од*v3
i,-vŠŠŠŠŠŠI'S
яt^^oS^©1^«'S
£ssss§sI«
^f^co4м^
00Г-Г-»-.^
gg§£2
©©©'Sа
^ШГ4iiIхх'S*3
^r^I©Iоо'Д'S
-нvoЧО*Ö^
©©©«я«§
iii¡i
tlI^HbliilUìtlIIÍ
39
慶應義塾大学教育学特殊 XIV 第 4 講 2015 年 5 月 13 日 27 / 37](https://image.slidesharecdn.com/cs150513-150512104430-lva1-app6891/85/XIV-4-27-320.jpg)
![学級規模と動機づけ等
精神衛生[Jakobsson et al., 2013]
目的
学級規模の大小と中学生 (相当:9 年生) のメンタルヘルスと
の関係。
対象
瑞典ヴェルムランド群の 40 校 (公立 38,私立 2)。
9 年生 2,755 人。
方法
プロビットモデル
説明変数が 2 値の場合の予測モデル
分断回帰デザイン。
慶應義塾大学教育学特殊 XIV 第 4 講 2015 年 5 月 13 日 28 / 37](https://image.slidesharecdn.com/cs150513-150512104430-lva1-app6891/85/XIV-4-28-320.jpg)
![学級規模と動機づけ等
精神衛生[Jakobsson et al., 2013]
結果
集中力,不安,悲嘆,目眩,頭痛,胃痛と学級規模は関係なし
(Table5, 6)。
論点
分断回帰デザインは何のための方法だったか?
Table 5 と 6 で符号の逆転が起こっているのをどう解釈す
るか?
教師の目が生徒に行き届きやすいことの難点は?
慶應義塾大学教育学特殊 XIV 第 4 講 2015 年 5 月 13 日 29 / 37](https://image.slidesharecdn.com/cs150513-150512104430-lva1-app6891/85/XIV-4-29-320.jpg)
![学級規模と動機づけ等
精神衛生[Jakobsson et al., 2013]
Table 5. Class size and mental health/well-being: instrumental variable regressions.
Concentration
problems Headaches Stomachaches Worrying/anxiety Sadness Dizziness
Class size 20.006 (0.016) 0.028∗
(0.016) 0.006 (0.012) 0.022 (0.015) 20.003 (0.014) 0.027∗∗
(0.012)
Enrollment 0.000 (0.000) 20.000 (0.000) 20.000 (0.000) 0.000 (0.000) 20.000 (0.000) 20.000 (0.000)
Girl 0.074∗∗∗
(0.017) 0.171∗∗∗
(0.016) 0.143∗∗∗
(0.013) 0.150∗∗∗
(0.015) 0.240∗∗∗
(0.015) 0.067∗∗∗
(0.013)
Single parent 0.081∗∗∗
(0.019) 0.077∗∗∗
(0.018) 0.048∗∗∗
(0.014) 0.013 (0.017) 0.081∗∗∗
(0.016) 0.035∗∗
(0.015)
First-generation
immigrants
20.068 (0.043) 20.073∗
(0.039) 20.062∗
(0.034) 20.074∗
(0.039) 20.0002 (0.042) 20.046 (0.034)
Second-generation
immigrants
0.028 (0.029) 0.005 (0.028) 0.029 (0.024) 0.043 (0.027) 0.062∗∗
(0.027) 0.044∗
(0.025)
Nonworking mother 0.041∗
(0.025) 0.044∗
(0.024) 0.042∗∗
(0.021) 0.059∗∗
(0.023) 0.016 (0.022) 0.016 (0.020)
Nonworking father 0.061∗
(0.034) 0.041 (0.033) 0.045 (0.027) 0.039 (0.031) 0.032 (0.030) 0.014 (0.027)
Constant 0.327 (0.363) 20.539 (0.360) 20.093 (0.279) 20.432 (0.360) 0.133 (0.331) 20.554∗
(0.284)
N 2755 2755 2755 2755 2755 2755
Notes: Robust standard errors in parentheses. All estimations use the predicted class size as an instrument for actual class size. The AIC suggests that not including higher order
polynomials of enrollment is preferred; the findings, however, do not change if higher order polynomials are included. Note that models are based on treating outcome
variables as continuous, but as noted in Note 10, results are qualitatively similar if treating outcome variables as binary.
∗
p , .1.
∗∗
p , .05.
∗∗∗
p , .01.
EducationEconomics259
慶應義塾大学教育学特殊 XIV 第 4 講 2015 年 5 月 13 日 30 / 37](https://image.slidesharecdn.com/cs150513-150512104430-lva1-app6891/85/XIV-4-30-320.jpg)
![学級規模と動機づけ等
精神衛生[Jakobsson et al., 2013]
Table 6. Class size and mental health/well-being: instrumental variable regressions, discontinuity sample (+3).
Concentration
problems Headaches Stomachaches Worrying/anxiety Sadness Dizziness
Class size 20.025 (0.028) 20.030 (0.030) 20.017 (0.020) 20.010 (0.024) 0.013 (0.024) 20.047∗∗
(0.023)
Enrollment 0.000 (0.001) 0.001∗∗
(0.001) 0.000 (0.000) 0.000 (0.000) 20.000 (0.000) 0.000 (0.000)
Girl 0.128∗∗∗
(0.035) 0.209∗∗∗
(0.034) 0.149∗∗∗
(0.028) 0.145∗∗∗
(0.030) 0.249∗∗∗
(0.031) 0.098∗∗∗
(0.030)
Single parent 0.118∗∗∗
(0.039) 0.064∗
(0.039) 0.079∗∗∗
(0.030) 0.011 (0.032) 0.101∗∗∗
(0.034) 0.063∗
(0.033)
First-generation
immigrants
20.081 (0.069) 20.104 (0.068) 20.044 (0.056) 20.013 (0.072) 20.011 (0.066) 0.043 (0.066)
Second-generation
immigrants
20.055 (0.056) 20.017 (0.054) 20.003 (0.042) 0.059 (0.052) 0.028 (0.047) 20.003 (0.050)
Nonworking mother 0.084 (0.053) 0.154∗∗∗
(0.056) 0.030 (0.041) 0.069 (0.050) 0.058 (0.048) 0.018 (0.048)
Nonworking father 20.008 (0.064) 0.067 (0.071) 20.049 (0.046) 20.003 (0.060) 20.010 (0.059) 0.016 (0.060)
Constant 0.754 (0.642) 0.702 (0.678) 0.451 (0.450) 0.288 (0.548) 20.260 (0.532) 1.167∗∗
(0.514)
N 622 622 622 622 622 622
Notes: Robust standard errors in parentheses. All estimations use the predicted class size as an instrument for actual class size. The AIC suggests that not including higher order
polynomials of enrollment is preferred; the findings, however, do not change if higher order polynomials are included. Note that models are based on treating outcome
variables as continuous, but as noted in Note 10, results are qualitatively similar if treating outcome variables as binary.
∗
p , .1.
∗∗
p , .05.
∗∗∗
p , .01.
N.Jakobssonetal.260
慶應義塾大学教育学特殊 XIV 第 4 講 2015 年 5 月 13 日 31 / 37](https://image.slidesharecdn.com/cs150513-150512104430-lva1-app6891/85/XIV-4-31-320.jpg)
![学級規模が児童生徒に与える影響を検討する視点
引用文献 I
[Bosworth, 2014] Bosworth, R. (2014).
Class size, class composition, and the distribution of student
achievement.
Education Economics, 22(2):141–165.
[Bosworth and Caliendo, 2007] Bosworth, R. and Caliendo, F.
(2007).
Educational production and teacher preferences.
Economics of Education Review, 26:487–500.
[Dee and West, 2011] Dee, T. S. and West, M. R. (2011).
The non-cognitive returns to class size.
Educational Evaluation and Policy Analysis, 33(1):23–46.
慶應義塾大学教育学特殊 XIV 第 4 講 2015 年 5 月 13 日 34 / 37](https://image.slidesharecdn.com/cs150513-150512104430-lva1-app6891/85/XIV-4-34-320.jpg)
![学級規模が児童生徒に与える影響を検討する視点
引用文献 II
[Hanushek, 2006] Hanushek, E. A. (2006).
School resources.
In Hanushek, E. A. and Welch, F., editors, Handbook of the
Economics of Education, Volume 2, pages 865–908. Elsevier,
Amsterdam.
[Jakobsson et al., 2013] Jakobsson, N., Persson, M., and
Svensson, M. (2013).
Class-size effects on adolescents’ mental health and
well-being in Swedish schools.
Education Economics, 21(3):248–263.
慶應義塾大学教育学特殊 XIV 第 4 講 2015 年 5 月 13 日 35 / 37](https://image.slidesharecdn.com/cs150513-150512104430-lva1-app6891/85/XIV-4-35-320.jpg)
![学級規模が児童生徒に与える影響を検討する視点
引用文献 III
[Konstantopoulos and Traynor, 2014] Konstantopoulos, S. and
Traynor, A. (2014).
Class size effects on reading achievement using PIRLS data:
Evidence from Greece.
Teachers College Record, 116(2):1–29.
[Krassel and Heinesen, 2014] Krassel, K. F. and Heinesen, E.
(2014).
Class-size effects in secondary school.
Education Economics, 22(4):412–426.
[Lazear, 2001] Lazear, P. E. (2001).
Educational production.
The Quarterly Journal of Economics, 116:777–803.
慶應義塾大学教育学特殊 XIV 第 4 講 2015 年 5 月 13 日 36 / 37](https://image.slidesharecdn.com/cs150513-150512104430-lva1-app6891/85/XIV-4-36-320.jpg)
![学級規模が児童生徒に与える影響を検討する視点
引用文献 IV
[Word et al., 1990] Word, E., Johnston, J., Bain, H. P., Fulton,
B. D., Zaharias, J. B., Achilles, C. M., Lintz, M. N., Folger, J.,
and Breda, C. (1990).
Student/Teacher Achievement Ratio (STAR) Tennessee’s K-3
class size study. Final summary report 1985-1990.
Tennessee Department of Education, Nashville, TN.
慶應義塾大学教育学特殊 XIV 第 4 講 2015 年 5 月 13 日 37 / 37](https://image.slidesharecdn.com/cs150513-150512104430-lva1-app6891/85/XIV-4-37-320.jpg)


![150715 教育学特殊XIV(学級規模)第13講 [完]](https://cdn.slidesharecdn.com/ss_thumbnails/cs150715-150715000207-lva1-app6891-thumbnail.jpg?width=640&height=640&fit=bounds)


