This document outlines a project focused on applying various data mining methods to three fintech-related datasets to derive insights and predict financial risks such as credit card fraud and defaults. The study employs techniques like logistic regression, k-nearest neighbors, random forest, and support vector machines, following established methodologies like KDD and CRISP-DM to assess and compare algorithm performance. The paper emphasizes the importance of data mining in enhancing financial risk management and improving service delivery in the fintech sector.
![XXX-X-XXXX-XXXX-X/XX/$XX.00 ©20XX IEEE
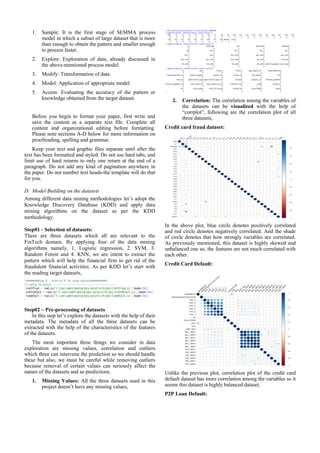
Data Mining on FinTech related datasets
Amarnath Venkataramanan
MSc FinTech
National College of Ireland
Dublin, Ireland
x18105149@student.ncirl.ie
Abstract—In this project, the various data mining methods
will be applied to three of fintech related datasets in order to
discover the insights from the datasets. The methods will be
applied to the datasets in R studio and corresponding outputs
will be shown in this paper. Then the applied methods will be
compared with each other to identify how well the method is
performing on each of the datasets and then finally the better
method will be chosen for each of the datasets. The methods
were explained in detail along with their advantages with the
help of the information from the relevant papers. Every
method which has been applied to the datasets has been
confirmed whether it follows the data mining methodologies.
Data mining methodologies like CRISP-DM, KDD and
SEMMA will also be explained in detail via this paper. The
process flow of the data mining methodologies will be
explained and also will be made sure that whether the process
flow has been followed while applying each method on the
datasets. The Data mining in now considered as a major factor
of the risk management process of the financial institutions.
Even though various data mining tools are existing in the
market, this paper allows readers to understand how the
algorithm works on the dataset and how to justify that whether
algorithm’s prediction.
Keywords—Data mining, FinTech, CRISP-DM, KDD
I. INTRODUCTION
[1] states that FinTech is responsible for the all kind of
data-oriented activities on financial services. Whereas
FinTech adopts data relevant activities such as data analytics,
data mining and data de-duplication in order to obtain a
knowledge from the data that leads to enhancing financial
services or introducing the entirely new services in financial
sector. In general, data mining is the process of determining
any valuable insights or patterns from the huge pool of
datasets [2]. There are two variants of data mining
techniques and they are, 1. Descriptive technique and 2.
Predictive technique. Descriptive technique helps the analyst
to fetch the characteristics of the data given as input.
Predictive technique allows the analyst to predict the hidden
information from the data given as input [3]. In FinTech,
data mining plays a major role to improve the various
existing services of the financial firms by discovering the
insights from the financial data [4]. There are three process
models exist for data mining and they are namely, 1.
Knowledge Discover Databases (KDD), 2. Cross-Industry
Standard Process for Data Mining (CRISP-DM) and 3.
Sample, Explore, Modify, Model, Assess. The detailed
description of these process model will be found below in
this paper [5].
A. Objective and motivation of this project
In recent times one of the major problems faced by banking
institution are follows,
a. Credit card fraud
b. Credit card default
c. Loan default
The ultimate aim of this project is to predict all of the
above-mentioned fraudulent activities from the
correspondingly related real time datasets by performing
data mining process with the help of the certain algorithms
under KDD data mining methodology to each of the dataset.
And also, we will compare those algorithms applied to each
of the dataset and we will be identifying the better
algorithms with the highest accuracy of prediction for each
of the dataset. All these data mining application are comes
under the risk management process of the financial
institutions.
Credit card fraudulent transactions. In order to detect those
fraudulent transactions of credit card currently various
predictive algorithms are currently used to perform the data
mining to predict which of the transactions are legitimate
and fraudulent. In this project we will be discussing by
applying various data mining algorithms on the real time
credit card data as per the KDD data mining methodology
[12].
After the financial crisis in 2008, bank and other financial
institutions are investing a huge amount in the risk
management. Data analytics / mining shares a major portion
of the potential risk management and investment on it. Even
though with high level prediction algorithm and data mining
tools available bank default is being frequent [13]. But,
don’t forget that “Something is better than nothing” even
with high level data mining algorithm 100% detection of
bank loan default is not possible atleast for some extent it
would reduce bank loan default. Let us apply some of the
high-level data mining algorithms to the real time bank loan
default data and justify their predictions.
Another problem faced by bank is credit card default which
is the situation where the user of the credit card failed to pay
the debt amount within the due date. Once it happens the
issuer (Bank) of the credit card will apply the penalty in
addition to the due amount. There are two categories of the
credit card default, they are follows,
a. Willingly credit card default
b. Unwillingly credit card default
Willingly credit card default is the situation where the users
of the credit card intentionally will not pay the debt caused
by credit card
Unwillingly credit card default is the situation where the
users not able to pay their debts caused by credit card due to
their financial or personal problems.](https://image.slidesharecdn.com/datamining-191010124713/85/Data-mining-on-Financial-Data-1-320.jpg)
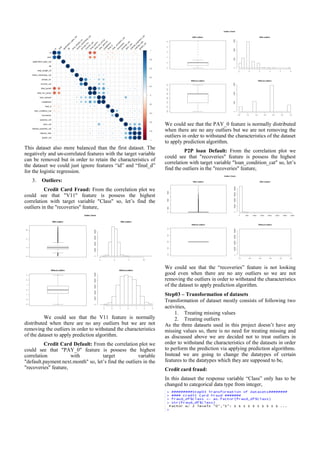
![II. RELEVANT WORK
A. Datasets
Datasets used in this data mining process are follows,
1. Credit card fraud: Obtaining the dataset which
consists of customer’s transaction details are not
easy due to the security policies and their
organization’s regulations. Presently, analysts are
using the data from the data generators in order to
test their newly created data mining tools [14]. The
contributor of [15] have released the dataset for the
public availability so that many analysts can use this
data set for their analysis research purposes. This
dataset consists of 31 variables. The feature “Time”
refers to the seconds took for each transaction after
first transaction in the dataset. The “Amount” term
refers to the transaction amount. The “Class”
feature is the response variable which is categorical
with the values 0’s and 1’s whereas 0’s represents
normal transaction and 1’s represents fraudulent
transactions. The structure of the dataset denotes
that this dataset is highly imbalanced whereas only
492 fraudulent transactions among 284807
transactions which makes the dataset highly skewed
as well. Due to the data confidentiality reason some
of the variables are not in detail and features have
been transformed to principal components (V1,
V2…, V28) via Principal Component Analysis. The
identification of cardholders also made unavailable
that makes each transaction are anonymous [15].
2. Credit card default prediction (Taiwanese
Dataset): "Credit card default prediction as a
classification problem" (Soui et al., 2018) is the
data from Taiwan. With the help of predictive
algorithm “Novel sorted smoothing” method, the
probability of response variable "default payment
next month" has been predicted. The response
variable of this dataset is a binary categorical data
which states customer credible or non-credible
clients. As per [27] the prediction of the credit card
default end up in the binary result as either good or
bad. The prediction will help to reduce such
delinquency of credit card default.
3. P2P lending bank loan default: (Đurović, 2017)
states that the prediction of the bank loan default
status is the highly dependent on the characteristics
of the loan whereas the loan with short repayment
duration is lesser risky than the loan with long
repayment duration. [28] believes that the
prediction of loan default in P2P lending usually
takes duration of loan and type of loan as major
prediction-affecting factors. The operational risk is
considered as the crucial risk in the peer to peer
lending system because of the failure to perform
risk assessment on the right time. Such operational
risks can be reduced to significant low level via
certain standardized approaches. [30] believes that
bidding credit is attached to lender credit in terms
of P2P lending in China. Risk management is
considering as a key factor in P2P lending system
in order to avoid certain unfortunate circumstances
like loan default. [23]
B. Methods
This section provides the brief details of various methods
used in this data mining process and also discusses it
advantages and disadvantages.
1. Logistic regression: As most of our datasets
contain target variable as categorical so it is best to
apply logistic regression rather than linear
regression. [24] states that linear regression will not
always return the prediction of the target variable
between 0 and1, it might end up in beyond the
range. It also expresses how the response variable
depends on the predictive variables. The application
of logistic regression is vast among various
industries which can be used for the prediction of
the certain activities they need based on the past
data. [12] used logistic regression to predict the
occurrences of the fraudulent credit card
transactions and [16] used this model for the
prediction of the credit card default. There are many
more researchers and analysts have been logistic
regression for the predicting purpose.
2. K-Nearest Neighbors algorithm model: Based on
the process of clustering and similarity KNN
predicts the behavior of the customer. [25] states
that KNN model follows an assumption model by
assuming if one entity belongs to a certain category
then the entire entities of the same sample also falls
under the same category. KNN model performs
well with minimal error when the target dataset
used is too large. The dependency of the model on
the near neighbors varies with different problems.
As it is mostly used in the big data the resources
required by it will be way more. [25] The higher
accuracy can be achieved with higher K value than
1NN. In recent times KNN being used by analyst
for the various purposes of the data mining like [17]
used KNN model to the automate the recording of
the web usage details, [25] used KNN model in
combination with Simulated Annealing model in
order to predict the credit ratings and [18] used
KNN model in an efficient way in order to predict
the consumer credit risk.
3. Random Forest model: Random forest
model can be used in the identification of useful
features which will be ranked by the model based
on the importance. It can be used for the
classification and regression by generating the
multitude of the decision trees. Significance of the
variables are taken as deciding factor to identify the
important variables. [29]. Layer construction and
identify split variables among nodes are considered
as the main challenges while using this model.
Boosting and bagging methods are used to improve
the performance of the random forest model. [31].
The P2P lending can be evaluated with the help of
Random forest model and with the help of gentic
algorithm optimal solution is obtained which have
been detailly explained in [19].
4. Support Vector Machine: Support Vector
Machine model is one of the supervised machine](https://image.slidesharecdn.com/datamining-191010124713/85/Data-mining-on-Financial-Data-2-320.jpg)
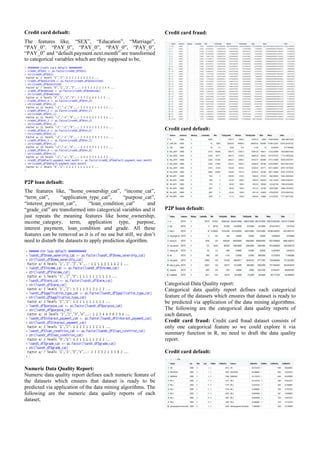
![learning algorith mostly used to perform the
regrssion and classification. SVM model is the
effective model if in case the target dataset is highly
skewed due to the unbalanced nature. SVM is
highly used by most of the financial institutions in
order to differentiate the fraudulent financial
activities among normal financial activities [20]. In
the risk managent stages of the financial institution
SVM model plays a major role in emprirical risk
mitigation. (ping feng pai, 2011). [20] also discusses
about how SVM model can be embedded into
communal and spike detection as Hybrid SVM
(HSCVM) in order to predict the fraudulent
activities using credit card. SVM can also be
efficiently used in [21] to evaluate credit report via
data mining approach.
III. DATA MINING
Data mining is the process that includes both the machine
learning and statistics in order to extract a pattern from the
target dataset. The extracted pattern can be later used for the
decision making in the financial institutions. The primary
techniques of data mining can be categorized into two
categories and they are,
1. Descriptive: It is a technique that exposes the
quality of day by analyzing its properties.
2. Predictive: It is a technique that speculates the
target data to predict the hidden pattern in the data.
There are three process models for the data mining and they
are follows,
The Knowledge Discovery Database (KDD) is the step by
step collaborative model [5], which consists of six steps to
discover the knowledge from the input dataset [6]. [7]
defines data mining as one of the steps in the KDD process.
Cross-Industry Standard Process for Data Mining
(CRISP-DM) is an iterative model with total of six steps
and was first introduced in 1996 [8].
Sample, Explore, Modify, Model, Assess (SEMMA) is the
five steps process model for data mining developed by SAS
institute [9].
A. Knowledge Discovery Database
KDD is the process of fetching the pattern or knowledge
which is hidden in the input dataset. The relevant application
of domain knowledge must be required by KDD. KDD is the
step by step process with six stages that follows,
1. Select an appropriate dataset or a combination of
certain sources of data.
2. Preprocessing involves the exploration of dataset to
make it fit for further mining process.
3. Transformation of dataset will be carried out in order
to convert the dataset into an appropriate format.
4. Build model (Data mining) includes the various
statistical learning and machine learning algorithm in
order to extract a hidden patter or knowledge from
the target dataset.
5. Evaluation of model describes how good the model
fits the dataset.
6. Extract the knowledge from the applied model.
The extraction of insights from the dataset via data mining
enables decision making process [10].
Figure 01: Various process stages of KDD.
B. CRoss-Industry Standard Process for Data Mining
Cross-Industry Standard Process for Data Mining [11] is
the six-phase processing model for data mining that provides
a regular framework and guidelines for data miners. The six
stage of CRISP-DM have been explained below,
1. Business Understanding: Identifying the motivation
and objectives of data mining.
2. Data Understanding: Collecting the data, exploring
the data and identifying the quality of data.
3. Data Preparation: Transforming and cleaning the
data.
4. Modelling: Application of the appropriate model for
the target dataset.
5. Evaluation: Identifying the accuracy of the pattern or
knowledge obtained by applying a suitable model to
the target dataset.
6. Deployment: Deployment, update and improvement
of models.
CRISP-DM and KDD are almost same in the functionality.
Figure 02: Process stages of CRISP-DM
C. SEMMA Process model
The SEMMA is the five-stage process model of data
mining developed by SAS institute in order to provide better
understanding, maintenance, development and organization
for the data mining projects. SEMMA is in built with the
SAS enterprise miner tool. The five stages of SEMMA
process model follows,](https://image.slidesharecdn.com/datamining-191010124713/85/Data-mining-on-Financial-Data-3-320.jpg)
![V. CONCLUSION
To conclude, though there are multiple and high-risk
challenges of fraud and delinquencies in today’s era
compared to the earlier era for banking and financial
institutions, timely decisions to prevent the customer likely
to default augments profitability and loyal customers for the
ban, which will ultimately increase the share-holders value.
In this report, it has been proposed to identify and work on
three datasets from reliable repositories and have applied
four machine language algorithms using R function along
with understanding of the datasets, pre-processing of
datasets, infer the correlation and conducting the data
quality report for numeric and categorical variable and
assigning the binary operators to target variables for
prediction purposes on all three3 datasets.
Further, this report also discussed about the comparison of
the empirical result reflects in confusion matrix using the
notions of performance namely the accuracy, sensitivity and
specificity of four methods and 3 data sets. It has been
identified that the “Random Forest” algorithm predicts
better accuracy in all 3 methods. Also noted that in dataset 1
& 2 the Logistic regression is failed due to less accuracy
predication and for dataset 3 the oversampling method is
failed.
The purpose of this report is to provide the sense of
behavioral scoring of delinquent borrowers to the banks and
FI and they can use as reference for real world applications.
However, there are limitations to this study where, this
report included the raw data but not considered if customer
have multiple debts, if any debt etc.
Additionally, as an extension to this study, it has also been
thought that during the course of this study, the experiences
learnt can be explored and applied to replicate the same in
other industries like Healthcare, Stock markets, Insurances
and other financial and non-financial domains.
VI. REFERENCES
[1] aK. Gai, M. Qiu, and X. Sun, “A survey on FinTech,” Journal of
Network and Computer Applications, vol. 103, pp. 262–273, Feb.
2018.
[2] D. J. Hand, “Principles of Data Mining:,” Drug Safety, vol. 30, no. 7,
pp. 621–622, 2007.
[3] S. Agarwal, “Data Mining: Data Mining Concepts and Techniques,” in
2013 International Conference on Machine Intelligence and Research
Advancement, 2013, pp. 203–207
[4] M. Kantardzic, Data Mining: Concepts, Models, Methods, and
Algorithms. John Wiley & Sons, 2011.
[5] Brachman, R. J. & Anand, T., “The process of knowledge discovery in
databases.”, AAAI Press / The MIT Press. 1996.
[6] U. Shafique and H. Qaiser, “A comparative study of data mining
process models (KDD, CRISP-DM and SEMMA),” International
Journal of Innovation and Scientific Research, vol. 12, no. 1, pp. 217–
222, 2014.
[7] U. Fayyad, G. Piatetsky-Shapiro, and P. Smyth, “From Data Mining to
Knowledge Discovery in Databases,” 1, vol. 17, no. 3, pp. 37–37,
Mar. 1996.
[8] Brachman, R. J. & Anand, T., “The process of knowledge discovery in
databases.”, AAAI Press / The MIT Press. 1996.
[9] SAS Enterprise Miner – SEMMA. SAS Institute, 2014 [online]
available:
http://www.sas.com/technologies/analytics/datamining/miner/semma.html
(September 2014.)
[10] J. D. Kelleher, B. M. Namee, and A. D’Arcy, “FUNDAMENTALS
OF MACHINE LEARNING FOR PREDICTIVE DATA
ANALYTICS,” p. 31.
[11] P. Chapman, “CRISP-DM 1.0: Step-by-Step Data Mining Guide,”
2000.
[12] S. Bhattacharyya, S. Jha, K. Tharakunnel, and J. C. Westland, “Data
mining for credit card fraud: A comparative study,” Decision Support
Systems, vol. 50, no. 3, pp. 602–613, Feb. 2011.
[13] L. Ying, “Research on bank credit default prediction based on data
mining algorithm,” 1, vol. 5, no. 6, pp. 4820–4823, Jun. 2018.
[14] Yufeng Kou, Chang-Tien Lu, Sirirat Sirwongwattana, Survey of Fraud
Detection Techniques, Proc. IEEE : International Conference on
Networking , Sensing & Control, pp. 749-754, 2004.
[15] A. D. Pozzolo, “Adaptive Machine Learning for Credit Card Fraud
Detection,” p. 199.
[16] I.-C. Yeh and C. Lien, “The comparisons of data mining techniques
for the predictive accuracy of probability of default of credit card
clients,” Expert Systems with Applications, vol. 36, no. 2, pp. 2473–
2480, Mar. 2009.
[17] D. A. Adeniyi, Z. Wei, and Y. Yongquan, “Automated web usage data
mining and recommendation system using K-Nearest Neighbor (KNN)
classification method,” Applied Computing and Informatics, vol. 12, no. 1,
pp. 90–108, Jan. 2016.
[18] J. Kruppa, A. Schwarz, G. Arminger, and A. Ziegler, “Consumer
credit risk: Individual probability estimates using machine learning,”
Expert Systems with Applications, vol. 40, no. 13, pp. 5125–5131, 2013.
[19] X. Ye, L. Dong, and D. Ma, “Loan evaluation in P2P lending based on
Random Forest optimized by genetic algorithm with profit score,”
Electronic Commerce Research and Applications, vol. 32, pp. 23–36, Nov.
2018.
[20] V. Mareeswari and G. Gunasekaran, “Prevention of credit card fraud
detection based on HSVM,” in 2016 International Conference on
Information Communication and Embedded Systems (ICICES), 2016, pp.
1–4.
[21 ]C.-L. Huang, M.-C. Chen, and C.-J. Wang, “Credit scoring with a data
mining approach based on support vector machines,” Expert Systems with
Applications, vol. 33, no. 4, pp. 847–856, Nov. 2007.
[22] Tao Guo and Gui-Yang Li, “Neural data mining for credit card fraud
detection,” in 2008 International Conference on Machine Learning and
Cybernetics, Kunming, China, 2008, pp. 3630–3634.
[23] Pingfan Song, , Yunzhi Chen, , Zhixiang Zhou, & Huaqing Wu.
(2018). Performance Analysis of Peer-to-Peer Online Lending Platforms in
China. Sustainability -MDPI.
[24] S. K. S. P K Viswanathan, "Journal of Emerging Market Finance,"
Modelling Credit Default in Microfinance -An Indian case study , p. 3,
2017.
[25]Van Shi,Xin Fan and Wenjie Li, & lianfeng Liu and Hongbo Ma.
(2016). Study on Key Technology of Power Users Credit Rating Evaluation
Based on Big Data. IEEE.
[26]S. H. U. ,. S. P. H. D H Pandya, "Expert Systems with Applications,"
Fault Diagnosis of rolling element bearing with intrinsic mode function of
acoustic emission data using APF - KNN, 2013.
[27]Yun-Huan Lee a , & Ya-Li Huang b. (2011). The expansion of the
credit card market in Taiwan. Applied Economics Letters, 3.
[28]Yun-Huan Lee a , & Ya-Li Huang b. (2011). The expansion of the
credit card market in Taiwan. Applied Economics Letters, 3.
[29]Yu Jina, & Yudan Zhua. (2015). A data-driven approach to predict
default risk of loan for online Peer-to-Peer(P2P) lending. IEEE, 3.
[30]Zhang, Y. (2017). Influencing Factors of Online P2P Lending Sucess
Rate in China. ScienceDirect -Procedia Computer Science 122 (2017) 896–
901
[31]Milad Malekipirbazari, & Vural Aksakalli. (2015). Risk assessment in
social lending via random forests. Expert Systems with Applications.](https://image.slidesharecdn.com/datamining-191010124713/85/Data-mining-on-Financial-Data-10-320.jpg)


![[DSC Europe 25] Predrag Maletic - Scaling AI in Banking – Our Strategic Journ...](https://cdn.slidesharecdn.com/ss_thumbnails/qu2onv0aruwlvqtygmxx-predrag-maletic-scaling-ai-in-banking-260123083019-6cf1da1d-thumbnail.jpg?width=640&height=640&fit=bounds)


