Downloaded 12 times


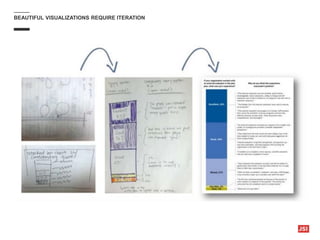
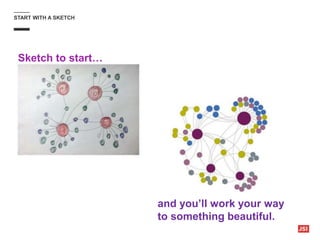
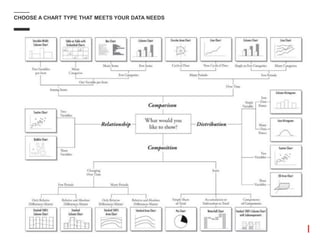


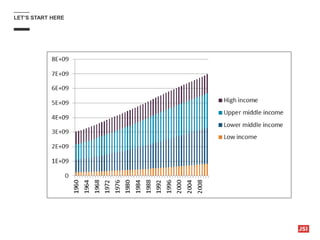
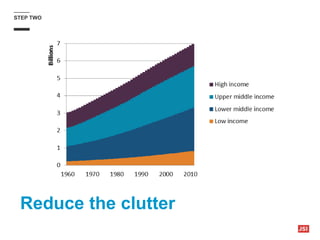
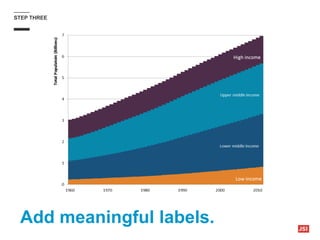
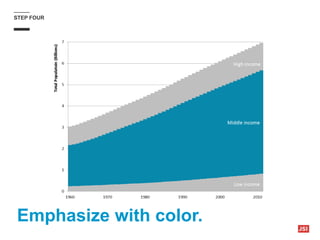


The document discusses creating effective data visualizations in Excel, emphasizing the importance of understanding stakeholders' needs and using iterative design. It outlines a structured approach to visual creation, including sketching, reducing clutter, and crafting meaningful titles that convey messages clearly. Additionally, it provides resources and tools for design and color selection to enhance visual impact.