Create your own dashboard with CloudIndustries.eu
•
1 like•145 views

CloudIndustries.eu - Cloud based platform for process monitoring.

Recommended
More Related Content
Viewers also liked
Viewers also liked (11)
Similar to Create your own dashboard with CloudIndustries.eu
Similar to Create your own dashboard with CloudIndustries.eu (20)
Recently uploaded
Recently uploaded (20)
Create your own dashboard with CloudIndustries.eu
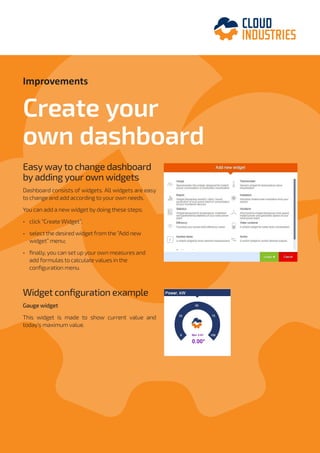
- 1. Improvements Create your own dashboard Easy way to change dashboard by adding your own widgets Dashboard consists of widgets. All widgets are easy to change and add according to your own needs. You can add a new widget by doing these steps: • click “Create Widget”; • select the desired widget from the “Add new widget” menu; • finally, you can set up your own measures and add formulas to calculate values in the configuration menu. Widget configuration example Gauge widget This widget is made to show current value and today’s maximum value.
- 2. General tab: Label – the name of the widget. Scale Min – the lowest scale value, the value from which the gauge begins animation, the bar will not go lower. Scale Max – the value when the gauge’s animation reaches maximum, the bar will not go higher. Gauge type – 3 possible types: a) Full gauge b) Half gauge c) Quarter gauge Measurements tab: In the measurement tab, you can add more measure- ments – select tags from other data loggers, change text or numbers format, etc. Appearance tab: In the appearance tab, you can adjust animation time, animation steps (choppy or smooth), also, you can choose background, foreground, small bar and scale colors.
- 3. Graphical visualisation of technical process CloudIndustries.eu features tool allows to draw or upload graphical visualisation with active real time data. The powerful feature enables users to easily create a graphical layout of their remote installation. Visualisation structure Shapes tab Atthemoment,visualisationhas5differentelements: line, rectangle, circle, text field and image element. Each element can have measurements attached. Editor tab Editor tab consists of these tabs: • Text • Presentation • Geometry • Data • Measurement: allows user to add a measurement tag or tag list. If user sets the Visibility tag and Vis- ibility value, when the measurement value is not equal to the set one, the element is not visible in the active window. This enables dynamic element states.
- 4. Application window Users can draw or upload graphical visualisation with active real time data and easily create a graph- ical layout of their remote installation. Users can add images, such as analog and digital graphical components (gauges, meters, indicators, etc.) to display a visual layout that is easy to understand. Branding opportunity Customization of WEB interface services allows to adapt cloudindustries.eu platform (including the login page and the dashboard) to user wishes and their own branding. One of the examples is how cloudindustries.eu adapted a platform for the heat pump solution “Cityvex” for apartment buildings.
- 5. We are ready to accept any challenges in order to fulfill your monitoring needs. L.Zamenhofo st. 5, LT-06332 Vilnius, Lithuania (European Union) Tel. +370 5 2742707, +370 5 2032304 Fax. +270 5 2058584 info@elseta.com www.elseta.com www.cloudindustries.eu We would be more than happy to meet you.