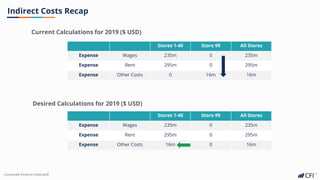
This document provides an overview of creating and using a date dimension in Power BI. It outlines steps to generate a table of dates from start and end dates, add descriptive date attributes like year, quarter, month, and week number. It describes creating relationships between fact and date tables to enable date slicing. It also covers building a date hierarchy, using the hierarchy in visuals, and adding a date slicer for interactive filtering. The goal is to build a reusable date dimension that allows slicing data visualizations by time period for analysis.


![Corporate Finance Institute®
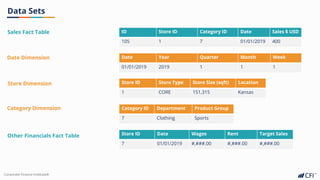
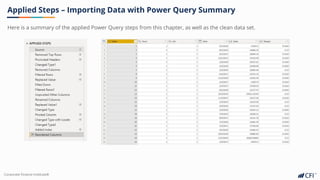
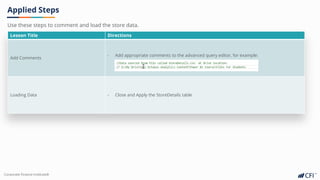
Applied Steps
Use these steps as a guide to follow along with the videos.
Lesson Title Directions
A Simple Line Area Chart - Create a simple line chart showing sales by date
Explicit Measures
- Create an explicit measure SumSales = sum(Sales[Sales])
- Change the table name to SalesFactTable
- The formula will now read SumSales = sum(SalesFactTable[Sales])
- In the line chart, swap the sales column for the SumSales metric
Chart Formatting
Explore the formatting pane to modfify the line chart
- Title text, Title Font Size, Font Color, Background Color
- Delete title placeholder and resize Chart
- Y-Axis Title to Sales $ USD, Grid lines darker grey
- Data Colors to CFI Orange (FA621C)](https://image.slidesharecdn.com/coursepresentation-221108181247-283e71f6/85/Course-Presentation-pdf-17-320.jpg)
![Corporate Finance Institute®
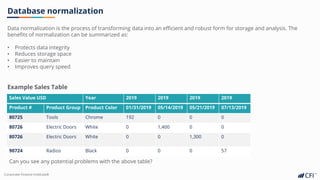
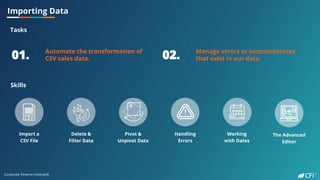
Applied Steps
Lesson Title Directions
A Simple Matrix
- Delete the title bar for P&L Breakdown by Period
- Add a matrix visual
- Add SumSales to the Values area
- Place Date in the columns
- Change the grid color
- Change the matrix title, color and size
Iterative Formulas like SUMX
- Create a new measure
GM$ = sumx(SalesFactTable,[Sales]*[Margin])
Working with Multiple Measures in a Matrix
- Add GM$ into the matrix
- Show values on rows : Formatting > Values > Show On Rows
- Change the formatting of SumSales to have no decimal places
- Change the formatting of GM$ to have no decimal places
- Rename how the measures appear in the visual to Sales & GM
Create COS and GM% Measures
- Create two new measures:
COS = [SumSales] – [GM$] format with 0 decimal places
GM% = [GM$] / [SumSales] format as % with 2 decimal place
Add both measures to the matrix
KPI Cards
- Add a KPI card to the top left quadrant
- Add SumSales to the card
- Format in millions, and adjust the data value size
- Copy the card and display GM%
- Copy the card a second time
Use these steps as a guide to follow along with the videos.](https://image.slidesharecdn.com/coursepresentation-221108181247-283e71f6/85/Course-Presentation-pdf-19-320.jpg)
![Corporate Finance Institute®
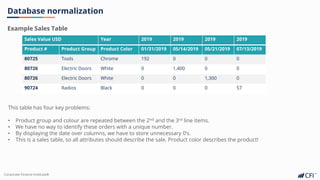
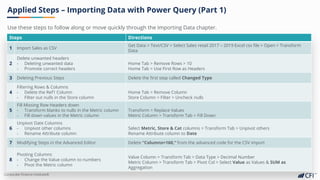
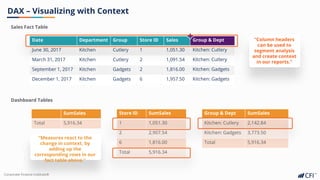
DAX – Data Analysis eXpressions
A simple DAX measure (metric): SumSales = sum(SalesFactTable[Sales])
Date Department Group Sales
June 30, 2017 Kitchen Cutlery 1,051.30
March 31, 2017 Kitchen Cutlery 1,091.54
September 1, 2017 Kitchen Gadgets 1,816.00
December 1, 2017 Kitchen Gadgets 1,957.50
What is DAX?
DAX is used to write formulas in Power BI, but also in Power Pivot for Excel. These formulas can help us create, aggregate or summarize
data in our reports. DAX formulas can be categorized into one of two groups: Calculated Columns and Measures.
Sales Fact Table
A simple DAX calculated column: Group & Dept = [Group] & ": "& [Department]
= 5,916.34
No summarization
Group & Dept
Kitchen: Cutlery
Kitchen: Cutlery
Kitchen: Gadgets
Kitchen: Gadgets
DAX Formula Hints](https://image.slidesharecdn.com/coursepresentation-221108181247-283e71f6/85/Course-Presentation-pdf-20-320.jpg)


![Corporate Finance Institute®
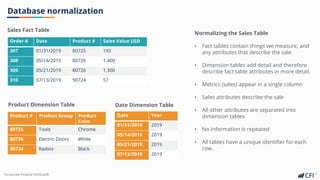
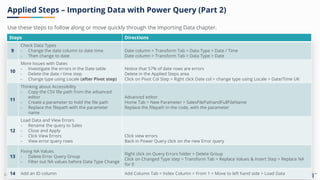
Applied Steps
Lesson Title Directions
Defining Start and End Dates for our Date
Table
Define New Source in the Power Query Editor > Blank Query > Advanced Editor
let
StartDate = Date.From(“01/01/2017”),
EndDate = Date.From(“12/31/2019”)
In
Source
Creating a table of consecutive dates
let
StartDate = Date.From(“01/01/2017”),
EndDate = Date.From(“12/31/2019”)
FullDates = List.Dates(StartDate, Number.From(EndDate) –
Number.From(StartDate)+1,#duration(1,0,0,0))
In
FullDates
- Convert the resulting list to a table. Leave the options as default.
- Rename the column to date.
- Change the column type to date
- Rename the table to DateDim
Adding Descriptive Date Columns Part 1 Add a column for Year, Quarter, Month and Week number
Adding Descriptive Date Columns Part 2
Add a custom column for QuarterID with formula =Text.From([Year])&”Q”&Text.From([Quarter])
Add a custom column for MonthID with formula =Text.From([Year])&”M”&Text.From([Month])
Add a custom column for WeekID with formula =Text.From([Year])&”W”&Text.From([Week])
Close and Apply the query
Use these steps to define the date table in Power Query.](https://image.slidesharecdn.com/coursepresentation-221108181247-283e71f6/85/Course-Presentation-pdf-25-320.jpg)
![Corporate Finance Institute®
Applied Steps
Lesson Title Directions
Creating Relationships to Enable the Date
Dimension
- Remove SalesFactTable[Date] from the Line Chart
- In the relationship view, creating a relationship between the Date column of each table.
- Add DateDim[Year] to the line chart
Creating a date hierarchy
- Right click on DateDim[Year] in the fields area
- Create hierarchy
- Drag QuarterID and WeekID into the hierarchy
- Replace DateDim[Year] with the new date hierarchy
- Sort the timeline by QuarterID ascending
Working with Two Charts - Replace the dates in the matrix with the date hierarchy (in columns)
Adding a Slicer
- Add a date slicer from the visualization pane
- Add the date hierarchy (year) to the slicer
- Change the options using the drop down, and select Drop down
- In formatting pane, change the selection controls to single select
- Disable the slicer header and place the slicer in the top right of the page
- Turn the slicer background off
- Change the items background to BLUE and the font color to WHITE
Modifying chart interactions - Edit the slicer interactions so that it doesn’t affect the timeline
Copying slicers across pages
- Copy the slicer onto both other pages
- Click SYNC
Use these steps to bring the date table functionality into your dashboard.](https://image.slidesharecdn.com/coursepresentation-221108181247-283e71f6/85/Course-Presentation-pdf-26-320.jpg)


![Corporate Finance Institute®
Applied Steps
Lesson Title Directions
View Sales by Store
- Add a new table visual and include [Store] and [SumSales]
- Change the default summarization of [Store] to Don’t Summarize
- Remove and re-add [Store] to the table.
Manually Import Store Data
- On the Home tab click Enter Data
- Copy the store details table from the store details xls file
- Paste the data into the Enter Data area
- Ensure that the headers were promoted correctly
- Rename the table to StoreDetails
- Click Edit
Replace Blanks and Fill StoreType Down
- Replace blanks with null in the StoreType Column
- Fill the StoreType column down
Extracting StoreType Using Delimiter - StoreType column > Transform Tab > Extract > Text After Delimiter > Use a colon “:”
Extracting StoreSize Numbers from Text
- StoreSize column > Transform Tab > Split Column > By Digit to Non-Digit
- Rename the Column to StoreSizeSqft
- Change the data type to decimal number
Creating a conditional column to deal with
uncertainty
- StoreLocation column > Transform Tab > Split Column > By Custom Delimiter > “; “
- Add column (conditional)
If [StoreLocation.1] equals USA Division Then [StoreLocation.2] Else [StoreLocation.1]
- Rename the column to State, and delete [StoreLocation.1] and [StoreLocation.2]
Use these steps to define the Store table in Power Query.](https://image.slidesharecdn.com/coursepresentation-221108181247-283e71f6/85/Course-Presentation-pdf-29-320.jpg)


![Corporate Finance Institute®
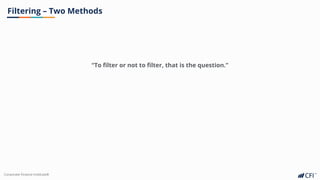
Filtering – Two Methods
Calculate( sum[Rent], filter(StoreDetails,StoreDetails[StoreID]=99) )
StoreID
1
2
3
99
StoreID Rent
1 10
2 15
3 12
99 5
Original context = StoreID = ALL
FILTER respects original filter context, and applies an additional rule.
Calculate( sum[Rent], filter(StoreDetails,StoreDetails[StoreID]=99) )
Original context = StoreID = 1
Filter respects original filter context, and applies an additional rule.
StoreID
1
2
3
99
StoreID Rent
1 10
2 15
3 12
99 5
StoreID Store 99 Rent
ALL 5
Report Visualization
Data Model
StoreID Store 99 Rent
1 0
Stores included in sum
99
Stores included in sum
None](https://image.slidesharecdn.com/coursepresentation-221108181247-283e71f6/85/Course-Presentation-pdf-37-320.jpg)
![Corporate Finance Institute®
Filtering – Two Methods
Calculate( sum[Rent], filter(StoreDetails,StoreDetails[StoreID]=99) )
StoreID
1
2
3
99
StoreID Rent
1 10
2 15
3 12
99 5
Original context = StoreID = 1
FILTER respects original filter context, and applies an additional rule.
Calculate( sum[Rent], StoreDetails[StoreID]=99)
Original context = StoreID = 1
Without FILTER: ignores current filter context, and applies a different
rule.
StoreID
1
2
3
99
StoreID Rent
1 10
2 15
3 12
99 5
StoreID Store 99 Rent
1 0
Report Visualization
Data Model
StoreID Store 99 Rent
1 5
Stores included in sum
None
Stores included in sum
99](https://image.slidesharecdn.com/coursepresentation-221108181247-283e71f6/85/Course-Presentation-pdf-38-320.jpg)