Downloaded 1,725 times

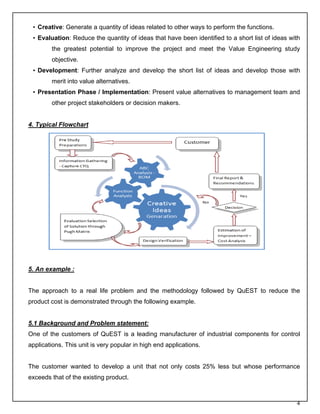
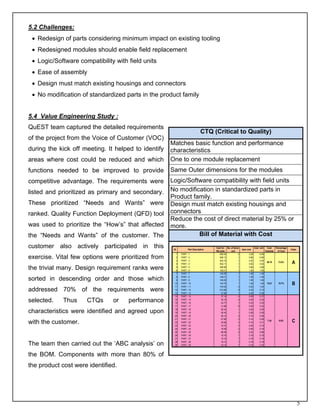

This document summarizes a value analysis and value engineering approach used by QuEST to reduce product costs for customers. It describes how VAVE systematically analyzes product functions to identify potential cost savings opportunities without compromising quality or performance. The approach involves understanding requirements, analyzing functions, generating alternative ideas, evaluating options, and developing value alternatives. An example project demonstrates how QuEST applied this process to reduce material costs for an industrial control product by over 25% while improving performance.


![[Harvard CS264] 10b - cl.oquence: High-Level Language Abstractions for Low-Le...](https://cdn.slidesharecdn.com/ss_thumbnails/cl-oquence-cs264-110403182645-phpapp01-thumbnail.jpg?width=640&height=640&fit=bounds)


