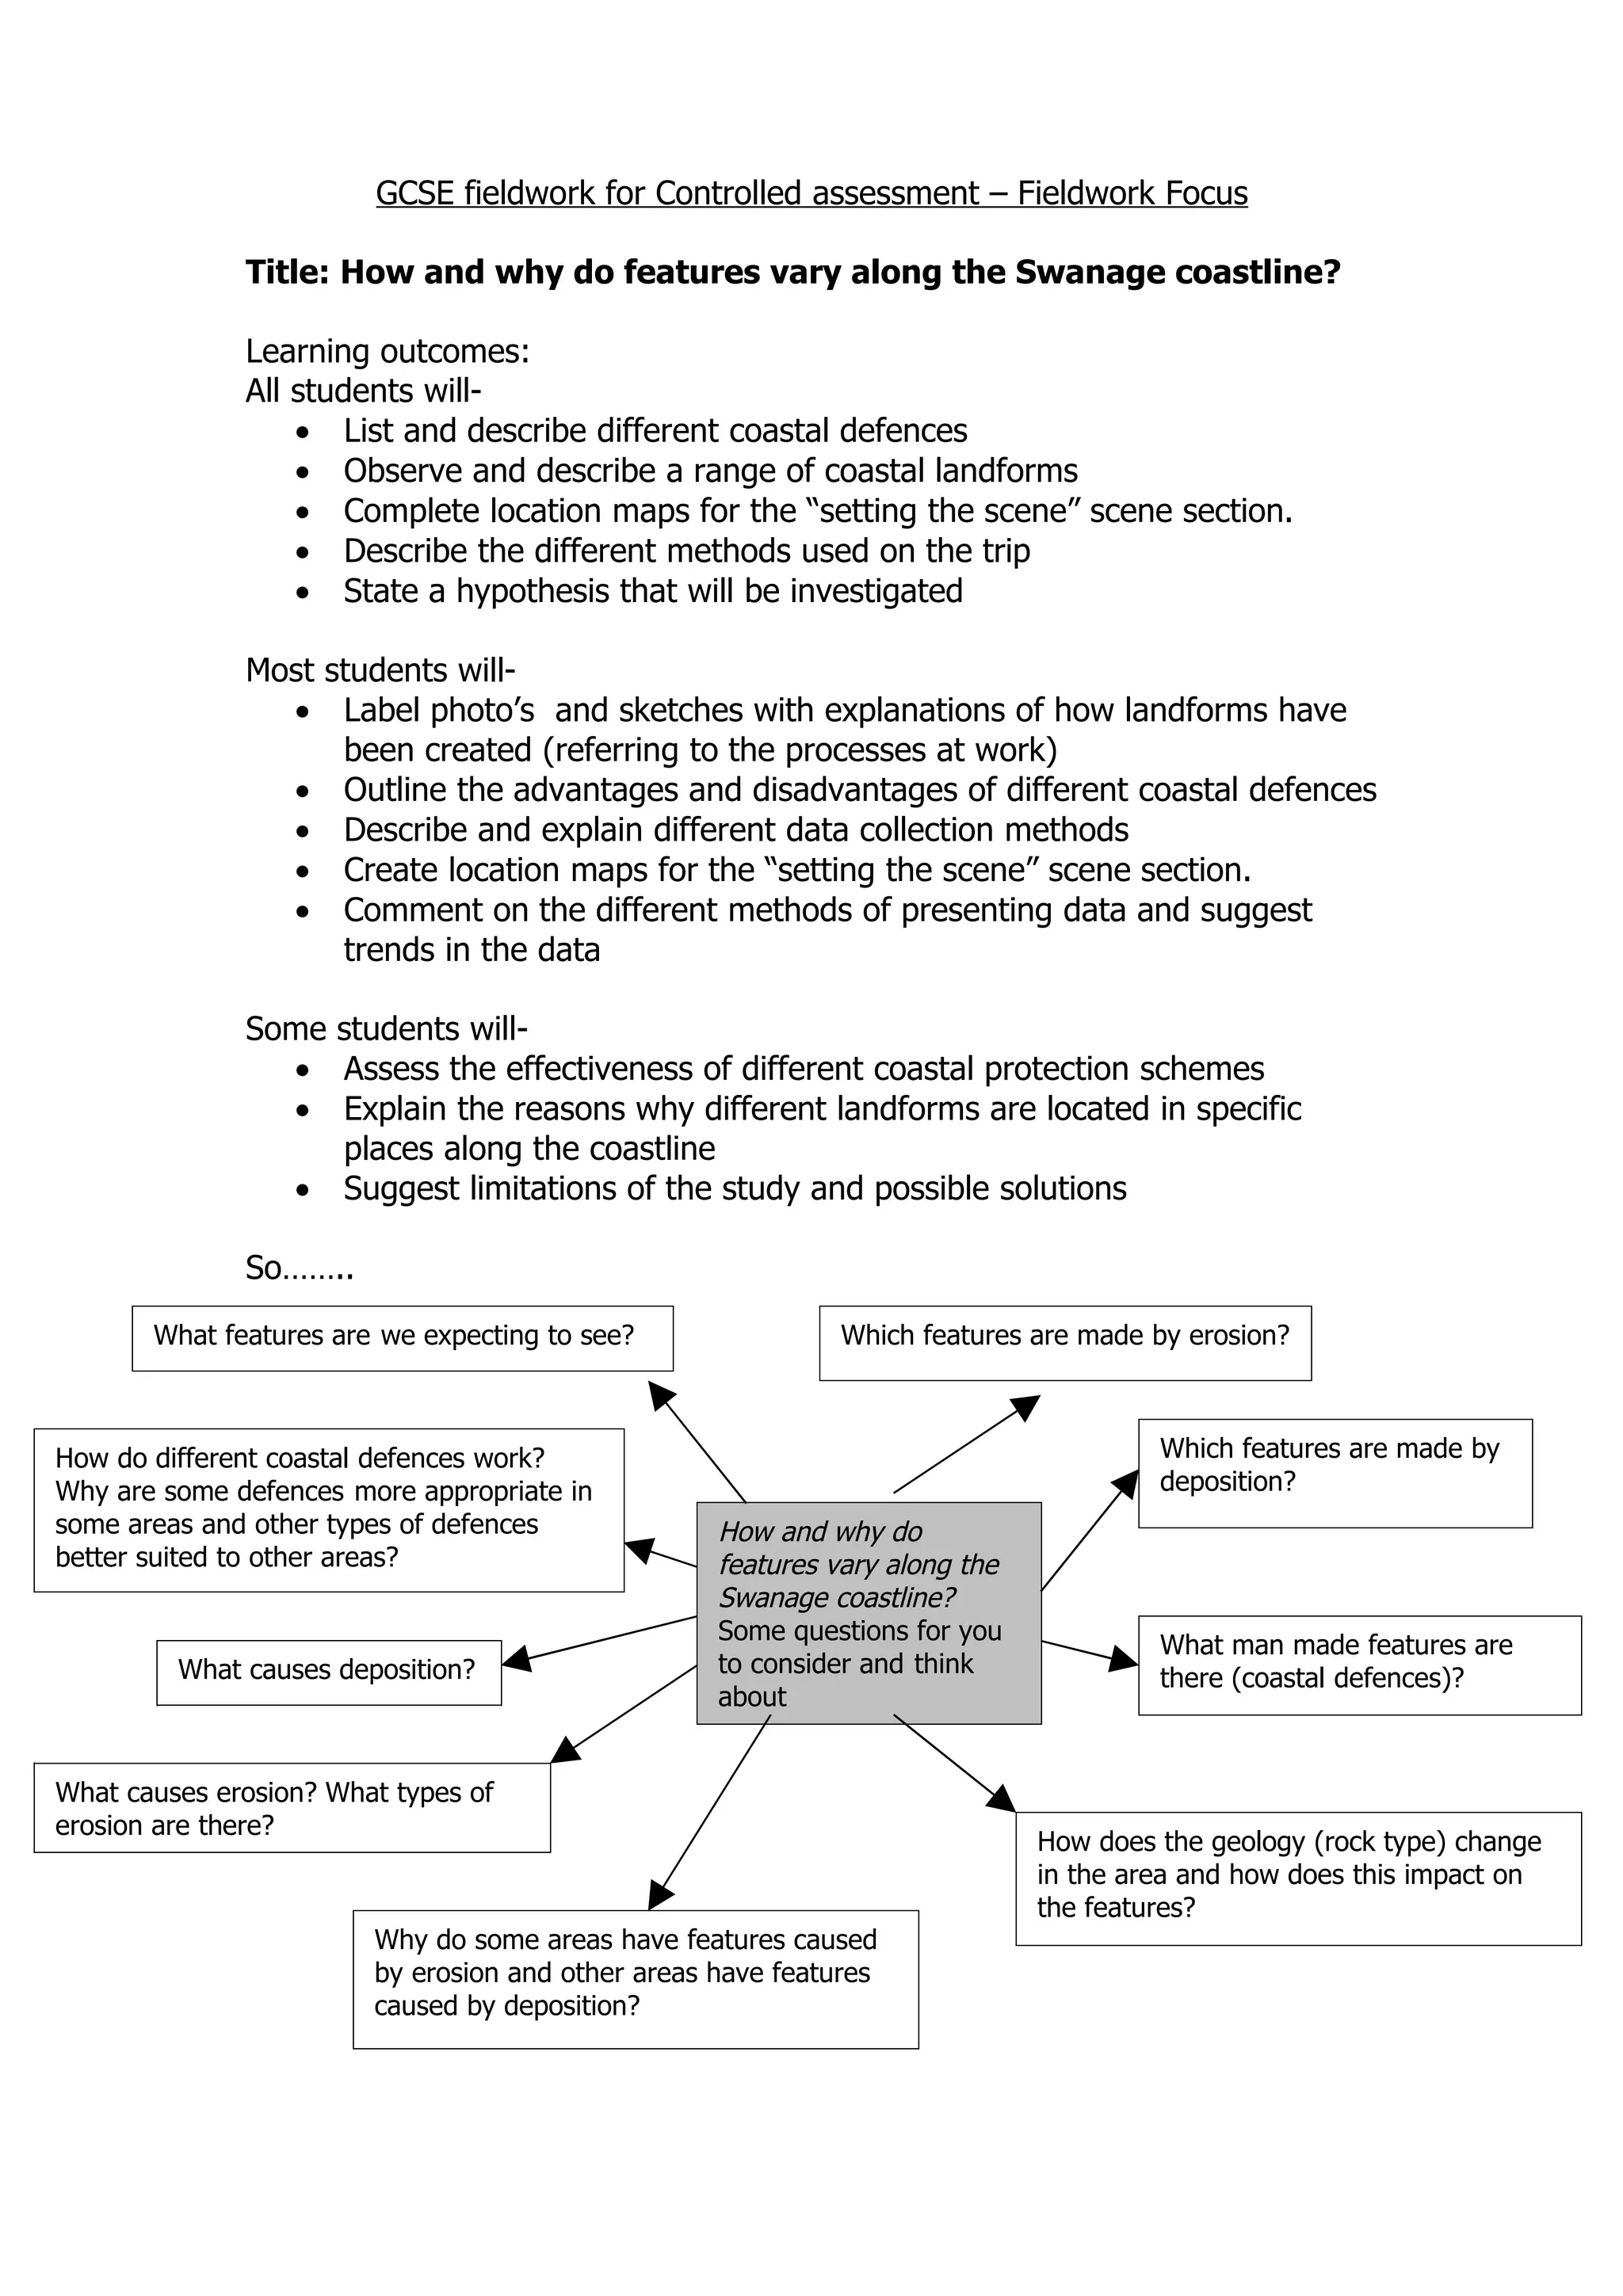
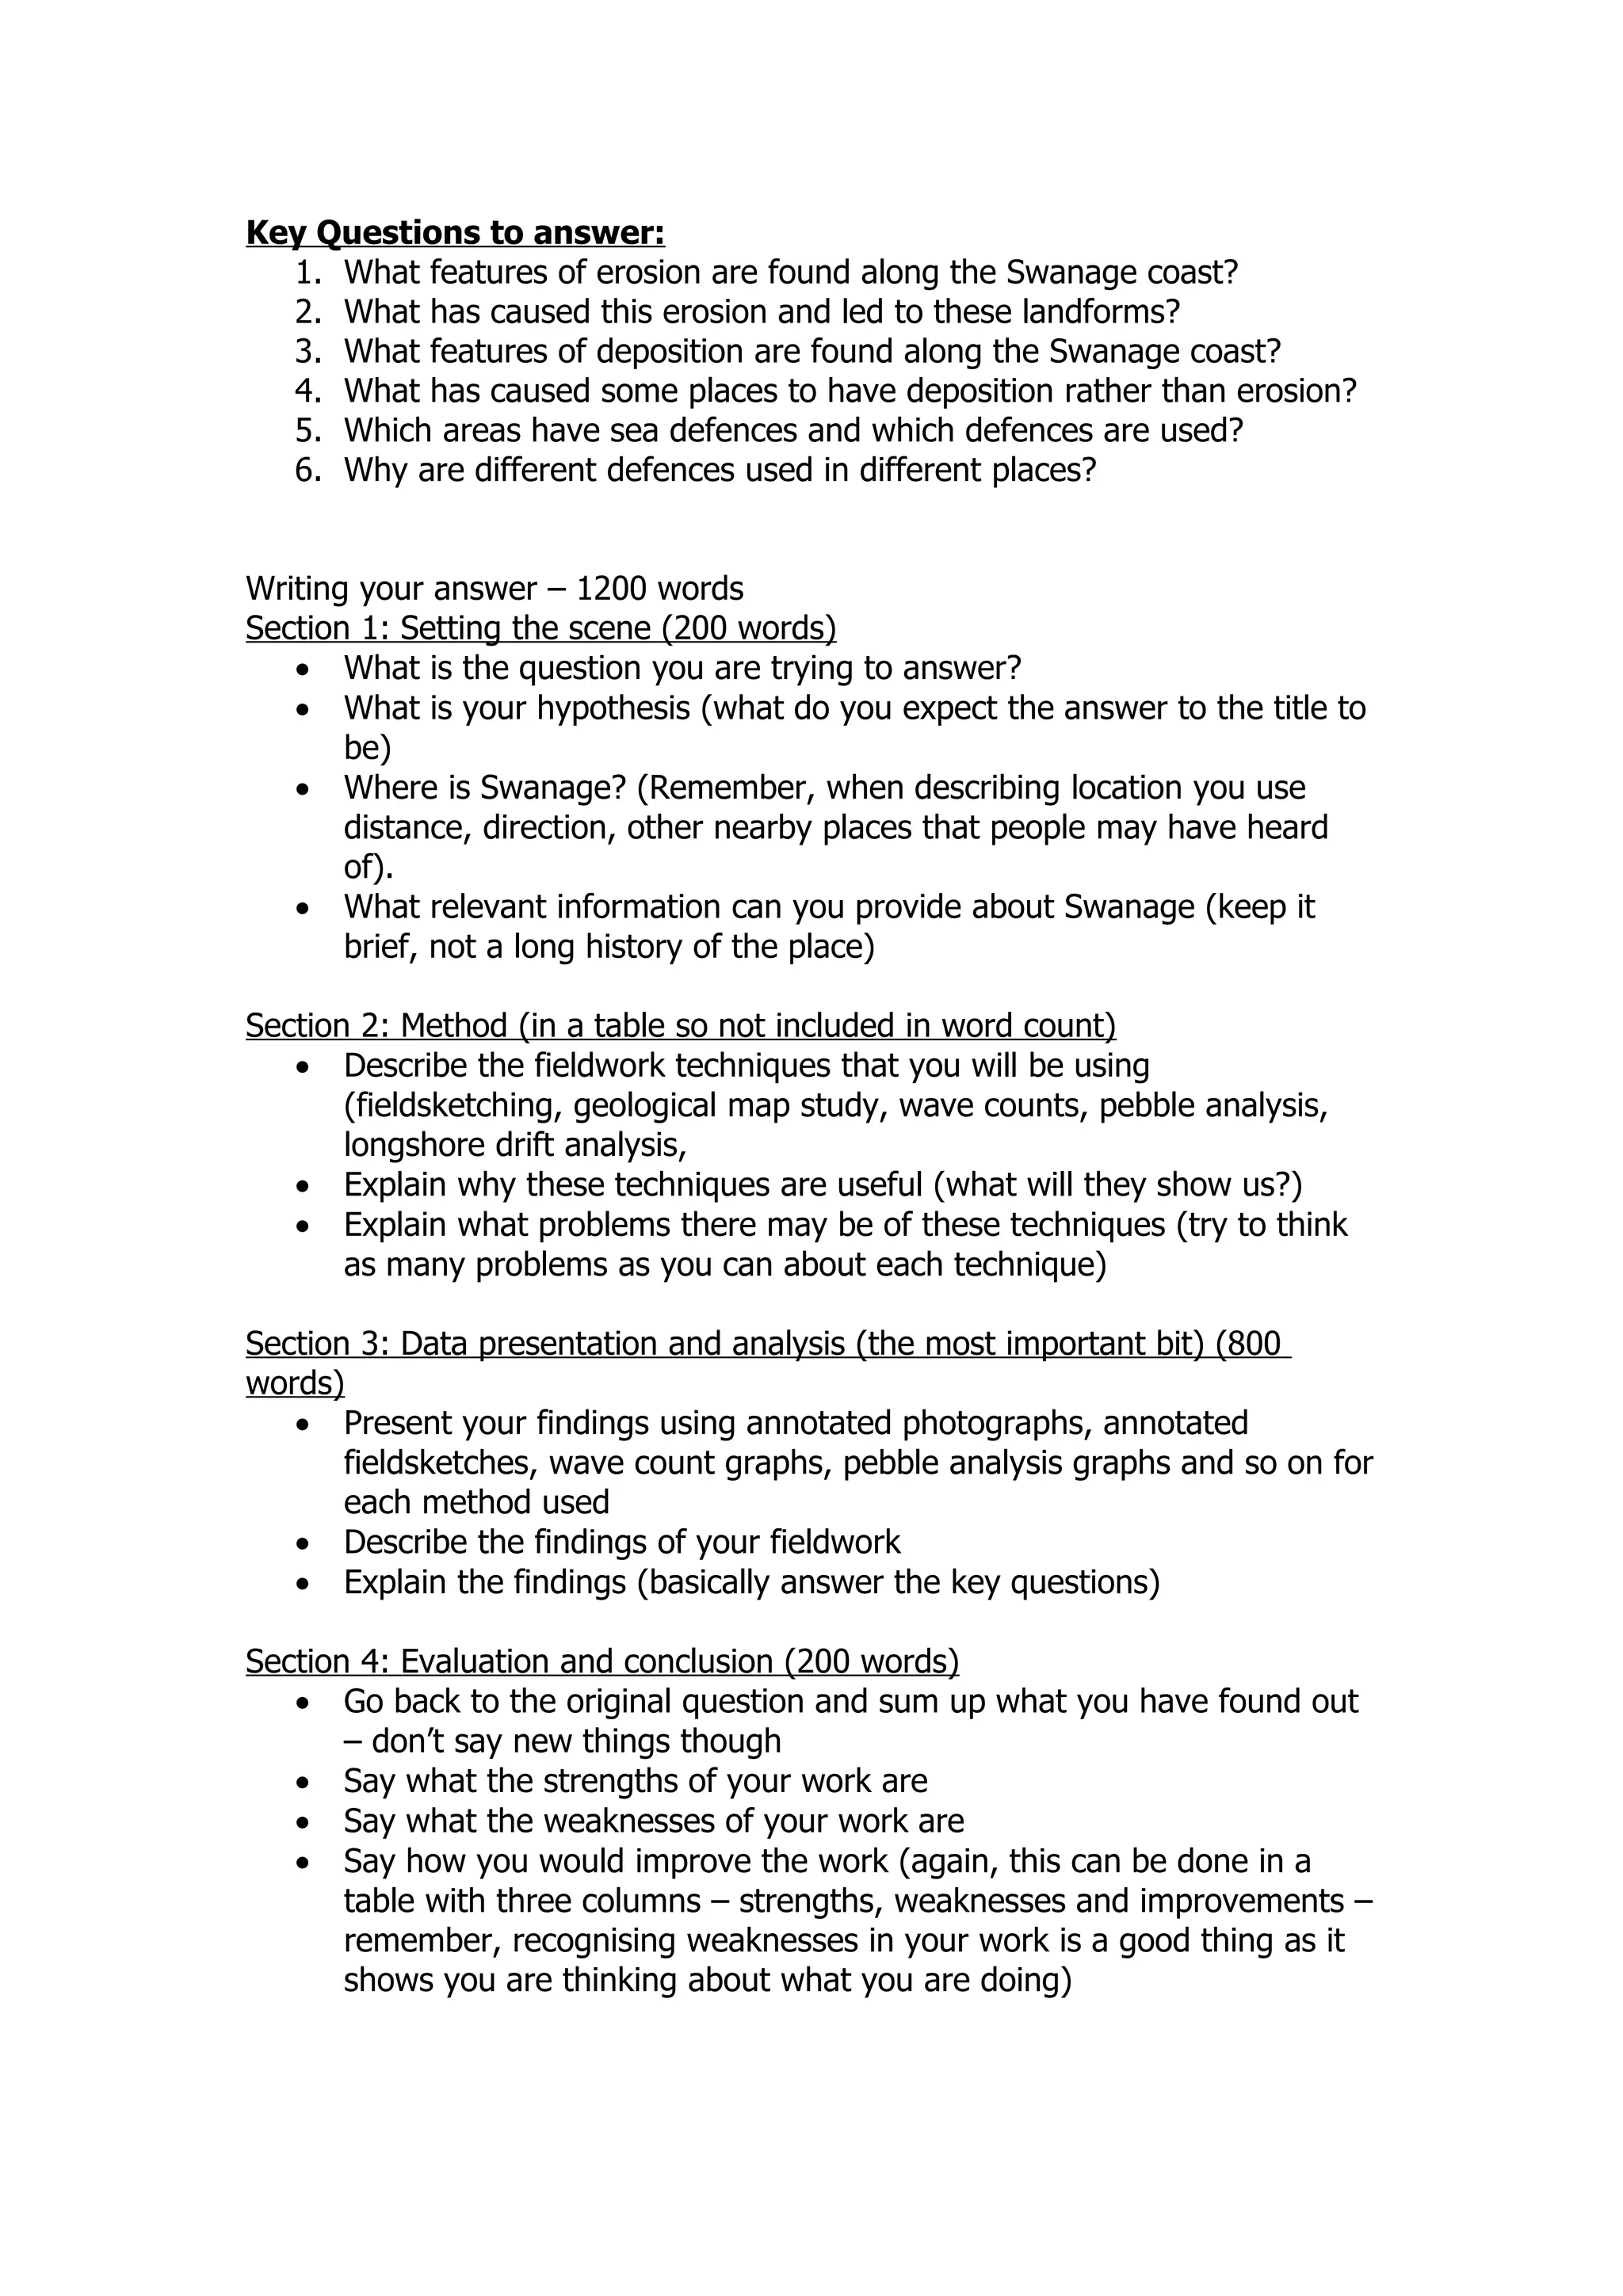
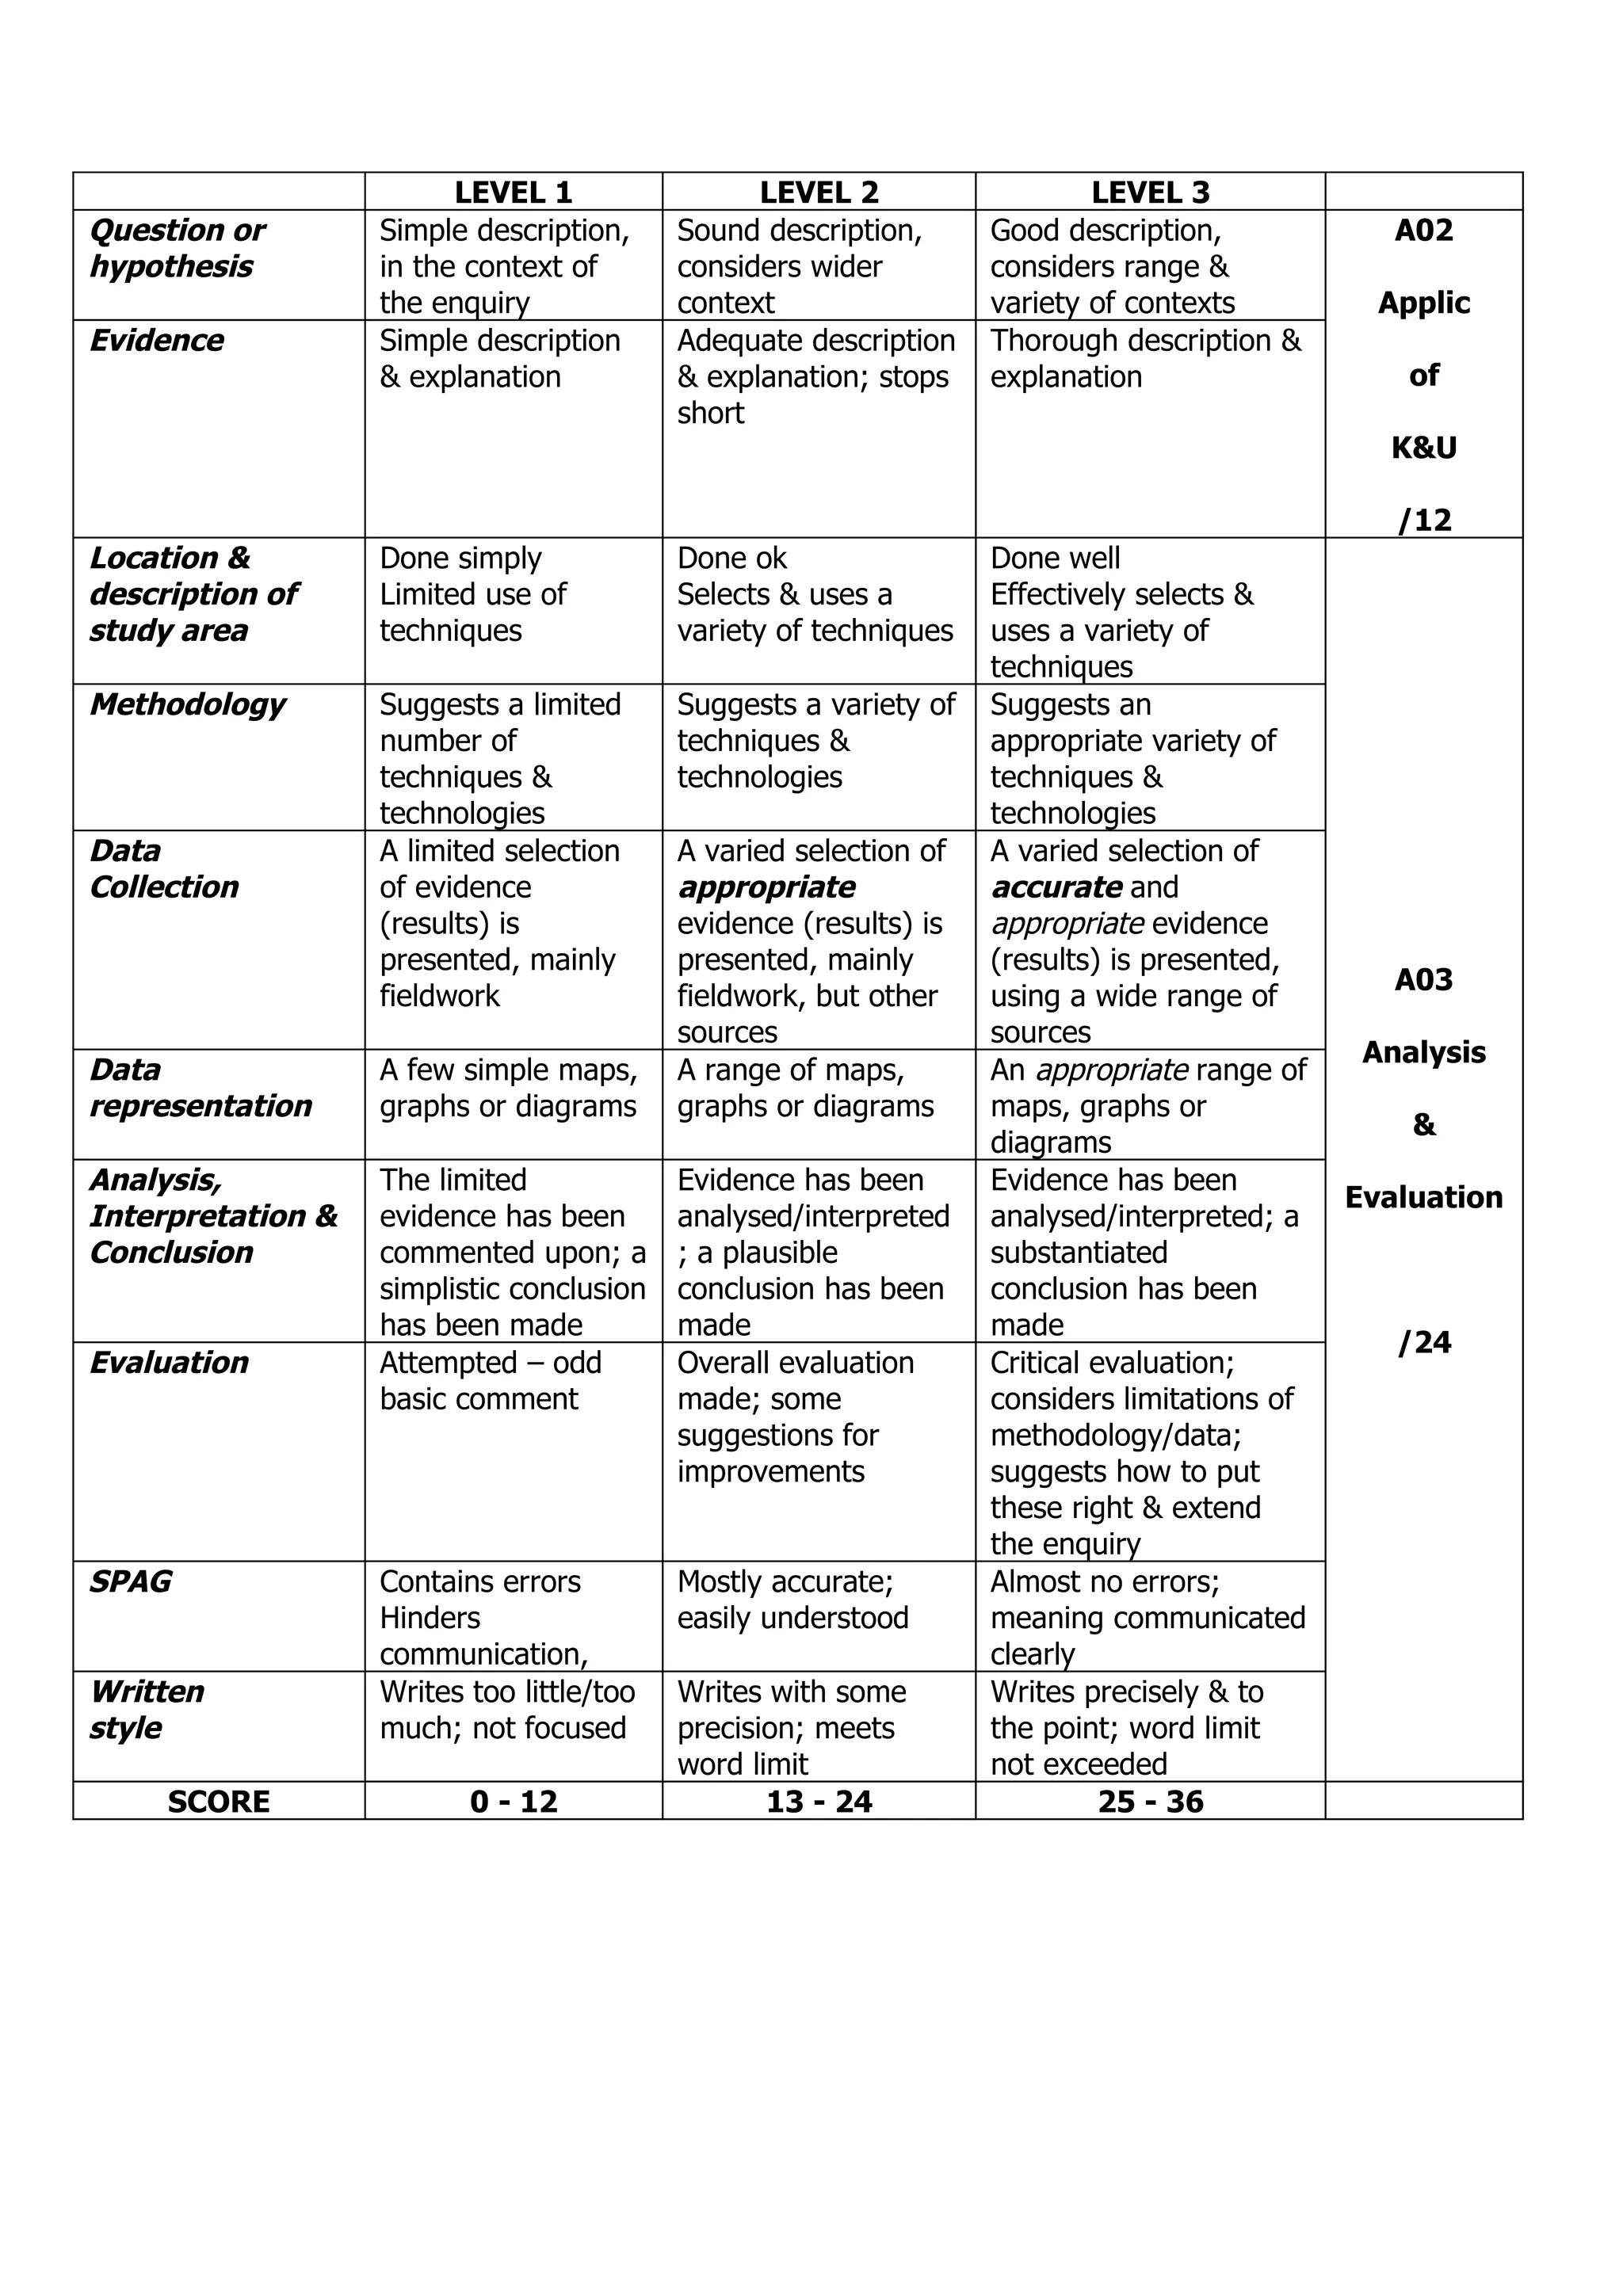
GCSE fieldwork for Controlled assessment – Fieldwork Focus

              Title: How and why do features vary along the Swanage coastline?

              Learning outcomes:
              All students will-
                  • List and describe different coastal defences
                  • Observe and describe a range of coastal landforms
                  • Complete location maps for the “setting the scene” scene section.
                  • Describe the different methods used on the trip
                  • State a hypothesis that will be investigated

              Most students will-
                • Label photo’s and sketches with explanations of how landforms have
                    been created (referring to the processes at work)
                • Outline the advantages and disadvantages of different coastal defences
                • Describe and explain different data collection methods
                • Create location maps for the “setting the scene” scene section.
                • Comment on the different methods of presenting data and suggest
                    trends in the data

              Some students will-
                • Assess the effectiveness of different coastal protection schemes
                • Explain the reasons why different landforms are located in specific
                   places along the coastline
                • Suggest limitations of the study and possible solutions

              So……..

       What features are we expecting to see?                Which features are made by erosion?


How do different coastal defences work?                                               Which features are made by
Why are some defences more appropriate in                                             deposition?
some areas and other types of defences             How and why do
better suited to other areas?                      features vary along the
                                                   Swanage coastline?
                                                   Some questions for you
                                                                                      What man made features are
         What causes deposition?                   to consider and think
                                                                                      there (coastal defences)?
                                                   about


What causes erosion? What types of
erosion are there?
                                                                             How does the geology (rock type) change
                                                                             in the area and how does this impact on
                                                                             the features?
                        Why do some areas have features caused
                        by erosion and other areas have features
                        caused by deposition?
Key Questions to answer:
  1. What features of erosion are found along the Swanage coast?
  2. What has caused this erosion and led to these landforms?
  3. What features of deposition are found along the Swanage coast?
  4. What has caused some places to have deposition rather than erosion?
  5. Which areas have sea defences and which defences are used?
  6. Why are different defences used in different places?


Writing your answer – 1200 words
Section 1: Setting the scene (200 words)
   • What is the question you are trying to answer?
   • What is your hypothesis (what do you expect the answer to the title to
       be)
   • Where is Swanage? (Remember, when describing location you use
       distance, direction, other nearby places that people may have heard
       of).
   • What relevant information can you provide about Swanage (keep it
       brief, not a long history of the place)

Section 2: Method (in a table so not included in word count)
   • Describe the fieldwork techniques that you will be using
       (fieldsketching, geological map study, wave counts, pebble analysis,
       longshore drift analysis,
   • Explain why these techniques are useful (what will they show us?)
   • Explain what problems there may be of these techniques (try to think
       as many problems as you can about each technique)

Section 3: Data presentation and analysis (the most important bit) (800
words)
   • Present your findings using annotated photographs, annotated
       fieldsketches, wave count graphs, pebble analysis graphs and so on for
       each method used
   • Describe the findings of your fieldwork
   • Explain the findings (basically answer the key questions)

Section 4: Evaluation and conclusion (200 words)
   • Go back to the original question and sum up what you have found out
       – don’t say new things though
   • Say what the strengths of your work are
   • Say what the weaknesses of your work are
   • Say how you would improve the work (again, this can be done in a
       table with three columns – strengths, weaknesses and improvements –
       remember, recognising weaknesses in your work is a good thing as it
       shows you are thinking about what you are doing)
LEVEL 1                 LEVEL 2                   LEVEL 3
Question or        Simple description,     Sound description,      Good description,             A02
hypothesis         in the context of       considers wider         considers range &
                   the enquiry             context                 variety of contexts          Applic
Evidence           Simple description      Adequate description    Thorough description &
                   & explanation           & explanation; stops    explanation                    of
                                           short
                                                                                                K&U

                                                                                                 /12
Location &         Done simply             Done ok                 Done well
description of     Limited use of          Selects & uses a        Effectively selects &
study area         techniques              variety of techniques   uses a variety of
                                                                   techniques
Methodology        Suggests a limited      Suggests a variety of   Suggests an
                   number of               techniques &            appropriate variety of
                   techniques &            technologies            techniques &
                   technologies                                    technologies
Data               A limited selection     A varied selection of   A varied selection of
Collection         of evidence             appropriate             accurate and
                   (results) is            evidence (results) is   appropriate evidence
                   presented, mainly       presented, mainly       (results) is presented,
                                                                                                 A03
                   fieldwork               fieldwork, but other    using a wide range of
                                           sources                 sources
                                                                                               Analysis
Data               A few simple maps,      A range of maps,        An appropriate range of
representation     graphs or diagrams      graphs or diagrams      maps, graphs or
                                                                                                  &
                                                                   diagrams
Analysis,          The limited             Evidence has been       Evidence has been
                                                                                              Evaluation
Interpretation &   evidence has been       analysed/interpreted    analysed/interpreted; a
Conclusion         commented upon; a       ; a plausible           substantiated
                   simplistic conclusion   conclusion has been     conclusion has been
                   has been made           made                    made
                                                                                                 /24
Evaluation         Attempted – odd         Overall evaluation      Critical evaluation;
                   basic comment           made; some              considers limitations of
                                           suggestions for         methodology/data;
                                           improvements            suggests how to put
                                                                   these right & extend
                                                                   the enquiry
SPAG               Contains errors         Mostly accurate;        Almost no errors;
                   Hinders                 easily understood       meaning communicated
                   communication,                                  clearly
Written            Writes too little/too   Writes with some        Writes precisely & to
style              much; not focused       precision; meets        the point; word limit
                                           word limit              not exceeded
     SCORE                0 - 12                  13 - 24                    25 - 36

Controlled assessment plan

  • 1.
    GCSE fieldwork forControlled assessment – Fieldwork Focus Title: How and why do features vary along the Swanage coastline? Learning outcomes: All students will- • List and describe different coastal defences • Observe and describe a range of coastal landforms • Complete location maps for the “setting the scene” scene section. • Describe the different methods used on the trip • State a hypothesis that will be investigated Most students will- • Label photo’s and sketches with explanations of how landforms have been created (referring to the processes at work) • Outline the advantages and disadvantages of different coastal defences • Describe and explain different data collection methods • Create location maps for the “setting the scene” scene section. • Comment on the different methods of presenting data and suggest trends in the data Some students will- • Assess the effectiveness of different coastal protection schemes • Explain the reasons why different landforms are located in specific places along the coastline • Suggest limitations of the study and possible solutions So…….. What features are we expecting to see? Which features are made by erosion? How do different coastal defences work? Which features are made by Why are some defences more appropriate in deposition? some areas and other types of defences How and why do better suited to other areas? features vary along the Swanage coastline? Some questions for you What man made features are What causes deposition? to consider and think there (coastal defences)? about What causes erosion? What types of erosion are there? How does the geology (rock type) change in the area and how does this impact on the features? Why do some areas have features caused by erosion and other areas have features caused by deposition?
  • 2.
    Key Questions toanswer: 1. What features of erosion are found along the Swanage coast? 2. What has caused this erosion and led to these landforms? 3. What features of deposition are found along the Swanage coast? 4. What has caused some places to have deposition rather than erosion? 5. Which areas have sea defences and which defences are used? 6. Why are different defences used in different places? Writing your answer – 1200 words Section 1: Setting the scene (200 words) • What is the question you are trying to answer? • What is your hypothesis (what do you expect the answer to the title to be) • Where is Swanage? (Remember, when describing location you use distance, direction, other nearby places that people may have heard of). • What relevant information can you provide about Swanage (keep it brief, not a long history of the place) Section 2: Method (in a table so not included in word count) • Describe the fieldwork techniques that you will be using (fieldsketching, geological map study, wave counts, pebble analysis, longshore drift analysis, • Explain why these techniques are useful (what will they show us?) • Explain what problems there may be of these techniques (try to think as many problems as you can about each technique) Section 3: Data presentation and analysis (the most important bit) (800 words) • Present your findings using annotated photographs, annotated fieldsketches, wave count graphs, pebble analysis graphs and so on for each method used • Describe the findings of your fieldwork • Explain the findings (basically answer the key questions) Section 4: Evaluation and conclusion (200 words) • Go back to the original question and sum up what you have found out – don’t say new things though • Say what the strengths of your work are • Say what the weaknesses of your work are • Say how you would improve the work (again, this can be done in a table with three columns – strengths, weaknesses and improvements – remember, recognising weaknesses in your work is a good thing as it shows you are thinking about what you are doing)
  • 3.
    LEVEL 1 LEVEL 2 LEVEL 3 Question or Simple description, Sound description, Good description, A02 hypothesis in the context of considers wider considers range & the enquiry context variety of contexts Applic Evidence Simple description Adequate description Thorough description & & explanation & explanation; stops explanation of short K&U /12 Location & Done simply Done ok Done well description of Limited use of Selects & uses a Effectively selects & study area techniques variety of techniques uses a variety of techniques Methodology Suggests a limited Suggests a variety of Suggests an number of techniques & appropriate variety of techniques & technologies techniques & technologies technologies Data A limited selection A varied selection of A varied selection of Collection of evidence appropriate accurate and (results) is evidence (results) is appropriate evidence presented, mainly presented, mainly (results) is presented, A03 fieldwork fieldwork, but other using a wide range of sources sources Analysis Data A few simple maps, A range of maps, An appropriate range of representation graphs or diagrams graphs or diagrams maps, graphs or & diagrams Analysis, The limited Evidence has been Evidence has been Evaluation Interpretation & evidence has been analysed/interpreted analysed/interpreted; a Conclusion commented upon; a ; a plausible substantiated simplistic conclusion conclusion has been conclusion has been has been made made made /24 Evaluation Attempted – odd Overall evaluation Critical evaluation; basic comment made; some considers limitations of suggestions for methodology/data; improvements suggests how to put these right & extend the enquiry SPAG Contains errors Mostly accurate; Almost no errors; Hinders easily understood meaning communicated communication, clearly Written Writes too little/too Writes with some Writes precisely & to style much; not focused precision; meets the point; word limit word limit not exceeded SCORE 0 - 12 13 - 24 25 - 36