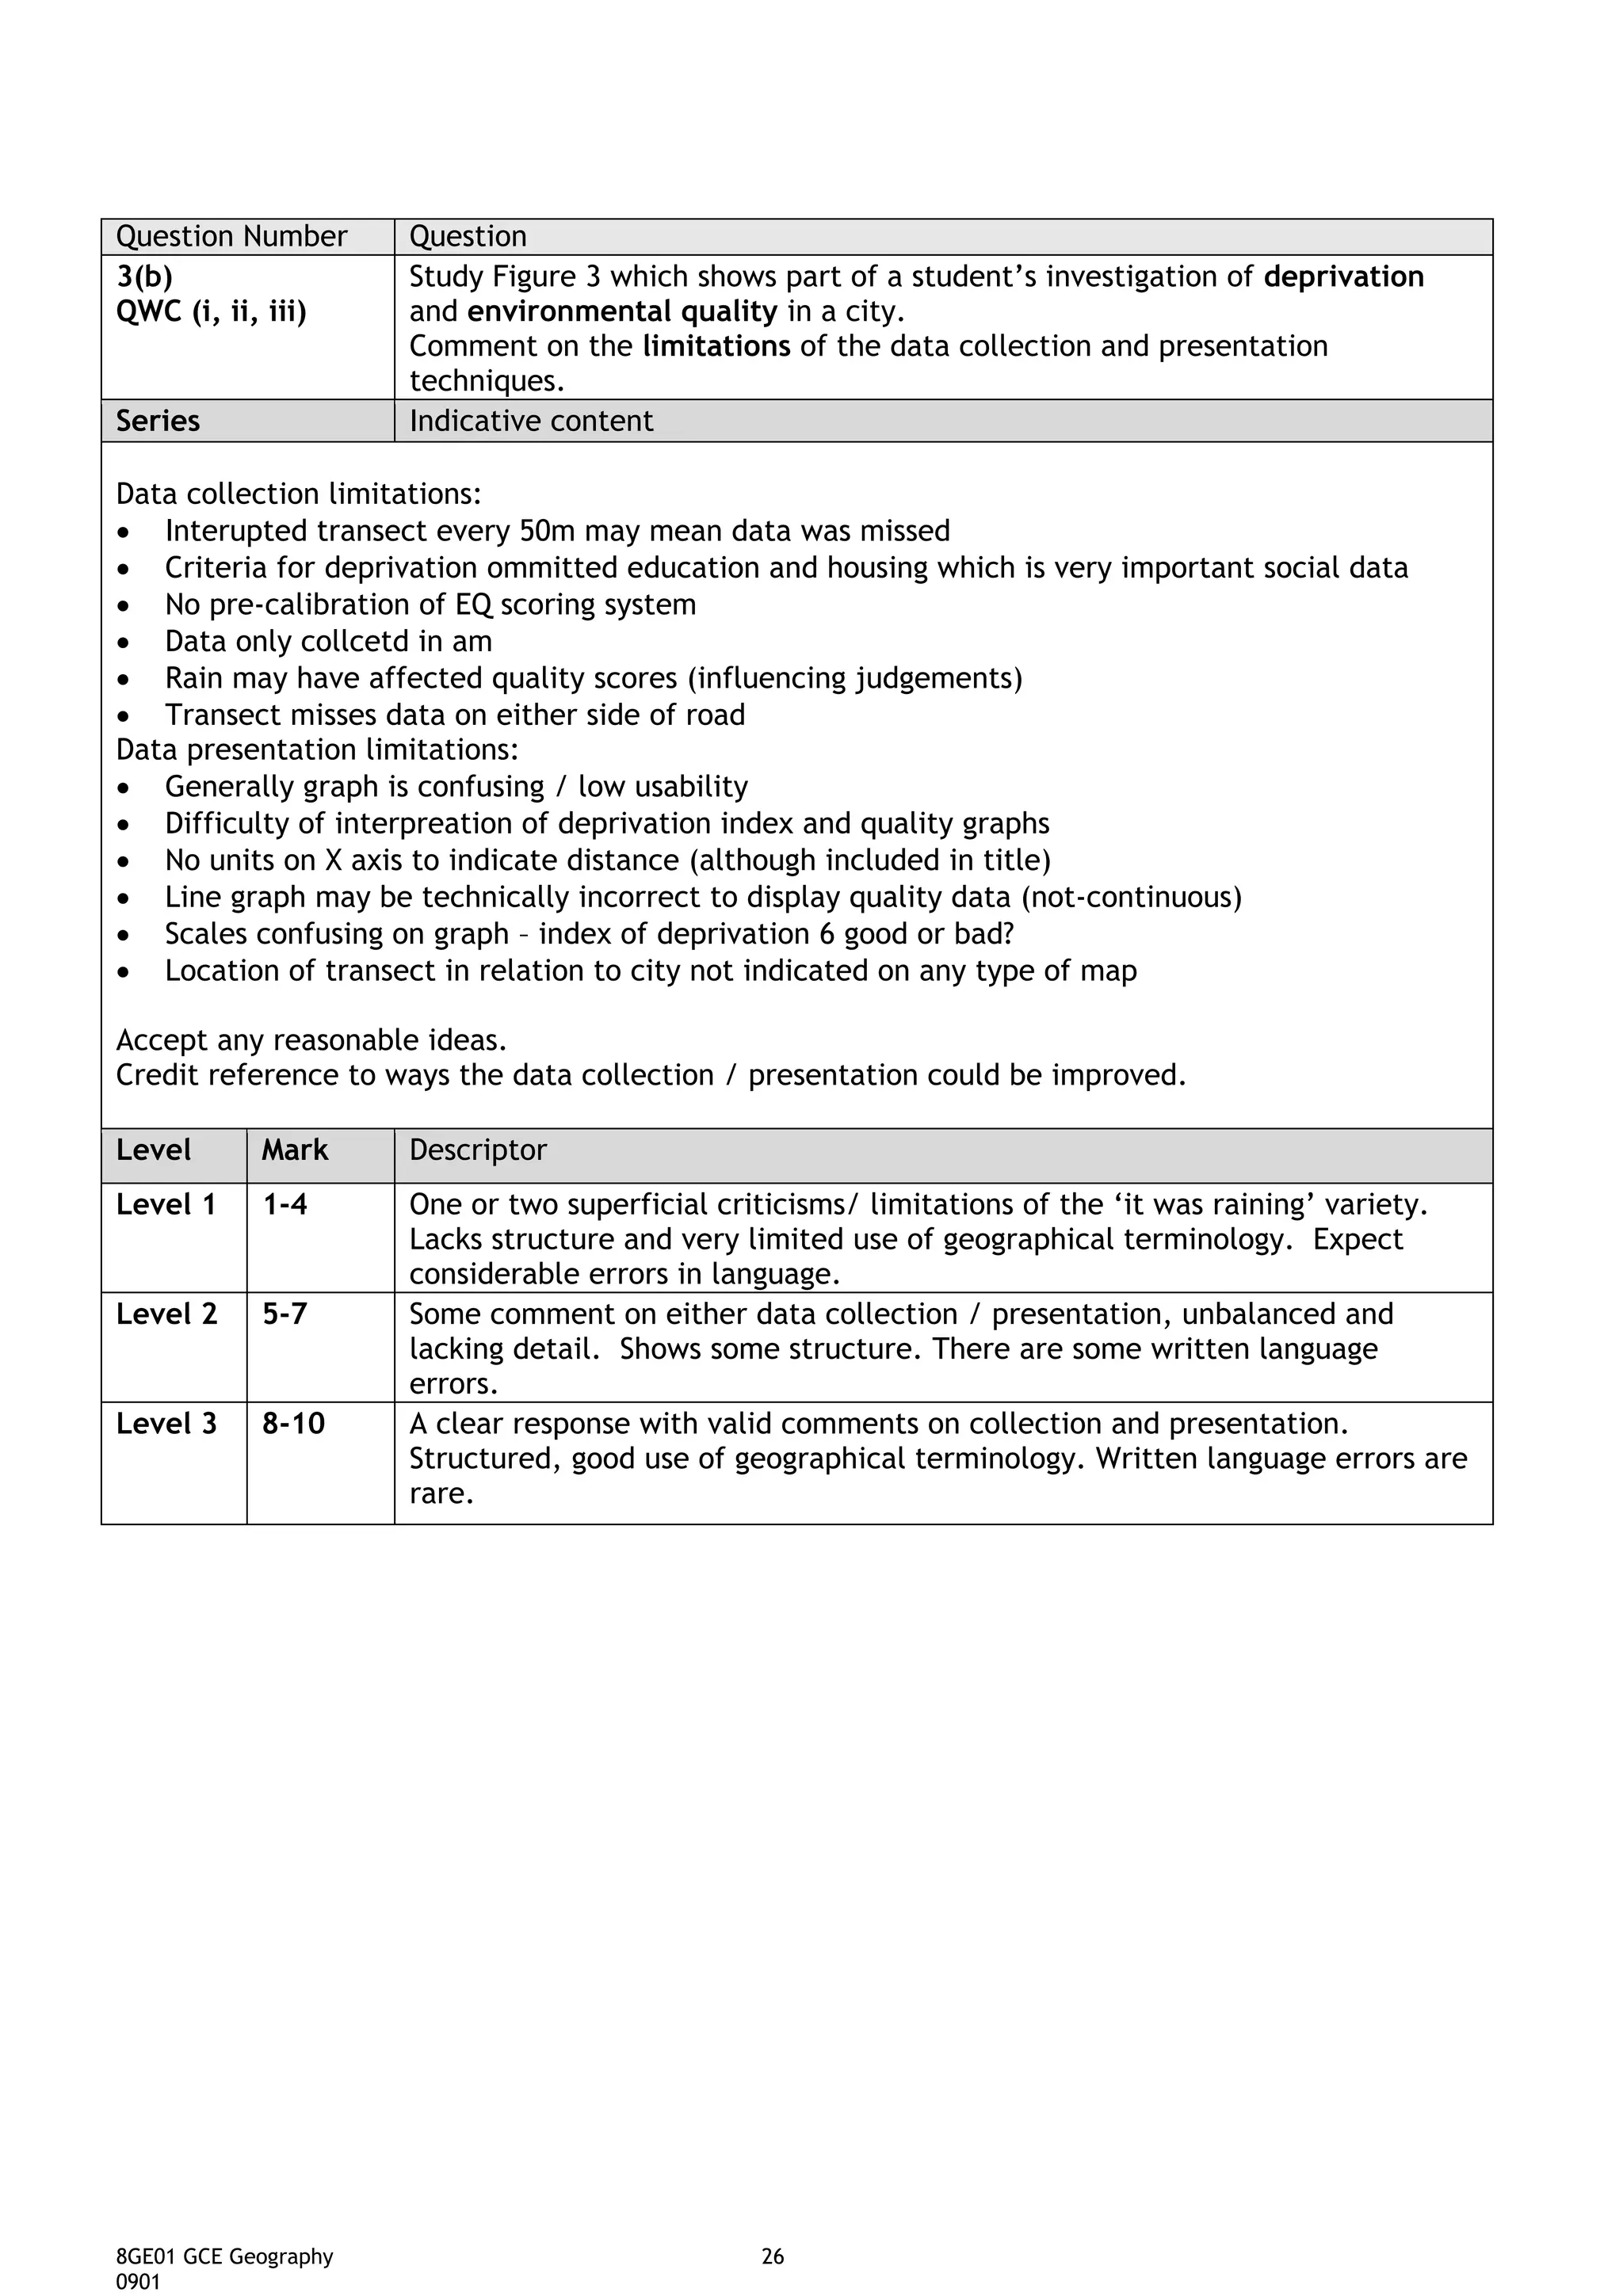
The student's investigation into deprivation and environmental quality in a city has some limitations:
1. The data collection techniques of questionnaires and surveys are subjective and open to bias.
2. Presenting the data as maps and diagrams does not show correlations or causation between variables.
3. No information is provided about sampling strategies, so the reliability of the results is unclear.
Jan 2009 Global Challenges Mark SchemeHarpal Bains
The document is a mark scheme for the January 2009 GCE Geography exam from Edexcel. It provides the exam questions, acceptable answers, and number of marks awarded for each question. The mark scheme serves to evaluate student responses on the exam in a standardized way. It aims to provide transparency around what constitutes a complete or partial answer for each question.
This document provides a mark scheme for the January 2012 GCE Geography (6GE02) Paper 01 Geographical Investigations exam. It outlines the general guidance on marking, including looking for qualities to reward rather than faults to penalize. It also provides the specific level descriptors and indicative content for each question on the exam.
(1) Landslides and avalanches are natural hazards found in mountainous areas.
(2) Landslides occur where there are steep slopes and cliffs near the coast or inland, and their risk is increased by earthquakes, heavy rainfall, and human activities like deforestation.
(3) Avalanches are more common in areas with heavy snowfall and glaciers at high elevations. The risk of these hazards affecting people is greater in locations that are inhabited.
Global warming is occurring faster than predicted according to observed temperature rise data. The observed temperature rise line is steeper and more variable than the predicted rise line from 1950. Reasons for the faster than expected warming include higher than predicted greenhouse gas emissions and a lack of complete understanding of climate change feedback processes. Natural factors like volcanic eruptions and variations in solar activity or Earth's orbit can also cause short-term temperature changes.
This document provides information about Edexcel, an examining and awarding body, and details about their GCE qualifications and support services. It outlines Edexcel's network of UK and international offices that provide support to centres, and lists contact details for subject-specific questions about GCE content and exams. The document establishes Edexcel as an examining body and provides their contact information.
Global Challenges Mark Scheme January 2012Sally Longford
The document provides a mark scheme for a geography exam on global challenges. It outlines the general marking guidance instructing examiners to mark candidates positively and use the full range of marks. It also provides specific guidance on marking for individual questions on the exam, identifying what examiners should award marks for in candidate responses.
The document provides guidance for examiners marking the GCE Geography exam. It outlines the general principles of marking, including rewarding qualities over faults, and ensuring all candidates receive equal treatment. It also provides specific guidance on using the mark scheme, such as how marks are awarded for each question and acceptable versus unacceptable answers.
Mark Scheme (Results) June 2011 GCE Geography 6GE01 Global Challenges
1. This document provides the mark scheme for the June 2011 GCE Geography exam on global challenges, outlining the answers and marks awarded for each question.
2. General guidance is given on marking approaches, such as looking for what candidates get right rather than wrong and awarding marks for extended explanations.
3. For each question, the expected answers and mark allocations are clearly outlined, along with examples of responses that should not receive credit.
This document provides information about an exam board and qualifications offered, as well as contact details for subject advisors. It includes a mark scheme for a geography exam that provides guidance to examiners on marking answers. The mark scheme outlines the types of responses expected and how marks should be awarded. It also provides examples of responses that should not receive credit.
The document is a summary of the 2012 summer exam for GCE Geography on global challenges. It provides instructions and guidelines for examiners on how to mark exam responses for different questions. Some key points include:
- The exam contains questions on topics like drought in Australia and its links to El Nino, factors influencing changes in Earth's climate over long time periods, and the economic and food security impacts of climate change.
- Model answers and mark schemes are provided for different questions testing knowledge of these topics. Marks are awarded for specific points or explanations within answers.
- Instructions are given to examiners on what to accept or not accept for marks, and how many marks different parts of a response can receive
This document contains an end of year social studies exam for 8th grade students at Vere Technical High School in Jamaica. The exam consists of multiple choice, true/false, short answer, and diagram/map questions covering topics like Jamaica's geography, climate, population, natural disasters, and human-environment interactions. The exam is divided into 4 sections (A-D) worth a total of 100 marks and tests students on their knowledge of Jamaica's social studies curriculum for the year.
The document is a social studies e-test for grade 8 students. It contains 30 multiple choice questions testing students' knowledge of topics like geography, climate, natural disasters, rocks, and weather symbols. It also includes exercises labeling locations on a grid, defining key terms, and identifying lines of latitude on a diagram.
The document provides instructions and content for a Grade 8 social studies mid-year examination covering topics such as Jamaica's location, geography, climate, natural hazards, and environmental issues. Students are to answer multiple choice, true/false, and short answer questions testing their knowledge across four sections within a 90 minute time period while following exam rules. The exam is designed to evaluate students' understanding of key social studies concepts related to Jamaica.
Here is the map of Jamaica with the requested fishing villages shaded:
[MAP OF JAMAICA WITH ROCKY POINT IN CLARENDON, ALLIGATOR POND IN ST. ELIZABETH,
BLACK RIVER IN ST. ELIZABETH, AND OLD HARBOUR BAY IN ST. CATHERINE SHADED]
Total 5 marks
This document provides a mark scheme for a GCE Geography exam from Edexcel. It outlines the general guidance examiners should follow when marking responses, including looking for what students do correctly rather than faults. It then provides indicative content and descriptors to guide examiners for each question on the exam. The mark scheme emphasizes rewarding students' understanding and use of geographical concepts and terminology.
Field geology involves using a variety of skills and geological knowledge to solve problems and interpret the geology of an area based on observations and measurements in the field. A successful field geologist is able to integrate data from different subdisciplines, think spatially, produce accurate maps, and develop hypotheses to explain geological features. While digital methods are increasingly used, traditional skills such as identifying rock units, measuring structures, and making careful field notes remain important. Fieldwork provides opportunities to gain experience solving problems and interpreting geology in different environments. Safety and minimizing environmental impact are also priorities for field geologists.
The document provides guidance for marking the GCE Geography exam paper. It outlines general marking principles and additional comments specific to the exam. It also provides a mark scheme for Question 1, including indicative content for parts (a) and (b) and level descriptors for scoring candidate responses.
Global warming is occurring faster than predicted according to observed temperature rise data. The observed temperature rise line is steeper and more variable than the predicted rise line from 1950. Reasons for the faster than expected warming include higher than predicted greenhouse gas emissions and a lack of complete understanding of climate change feedback processes. Natural factors like volcanic eruptions and variations in solar activity or Earth's orbit can also cause short-term temperature changes.
Mark Scheme Unit 1 Global Challenges May 2009Sally Longford
This document provides a mark scheme for the GCE Geography exam for Edexcel. It outlines the answers and marks for each question on the exam. It provides details on what type of responses would be awarded marks and how many marks each response is worth. The mark scheme serves to ensure consistent and fair marking of the exams by defining the essential information and level of detail required in students' responses to receive marks. It also gives examiners guidance on question interpretation and scope to allow for accurate assessment of student answers.
Global warming is occurring faster than predicted according to observed temperature rise data. The observed temperature rise line is steeper and more variable than the predicted rise line from 1950. Reasons for the faster than expected warming include higher than predicted greenhouse gas emissions and a lack of complete understanding of climate change feedback processes. Natural factors like volcanic eruptions and variations in solar activity or Earth's orbit can also cause short-term temperature changes.
PHY 103 Final Project Guidelines and RubricOverviewThe final .docxmattjtoni51554
PHY 103: Final Project Guidelines and RubricOverview
The final project for this course is the creation of a preliminary report of environmental findings.
The final project encompasses several Earth science processes that form the foundation of geosciences work—from understanding how human activities change a landscape to mitigating potential natural hazards to addressing the impacts of weather and climate. Students apply geologic science in a practical manner. For example, as a spatial analysis technician uses knowledge of water drainage, underlying geology, soils, and weather components to design and place roads, houses, power lines, and drainage systems in a new neighborhood, you will draw on the knowledge gained in this course to create the final project.
Understanding Earth system processes is critical for projects such as bridge design, soil or water contamination studies, analyzing climate change, and developing policies that safeguard both humans and their environment.
For this assessment, you will apply the Earth systems information learned throughout the course by assuming the role of an intern at an environmental consulting firm. You will be charged with conducting basic background research for an environmental report the company is preparing for a client in relation to the development of a subdivision. The supervisor has asked you to prepare a preliminary report that the firm can eventually incorporate into its report to communicate the findings to the client. The report should cover the basic geomorphology and climate for the area and highlight what these factors suggest for the planned subdivision in broad terms, using the provided documents—the geological cross section, topographical maps, historical data on volcanos and earthquakes, regional weather information, and stream discharge data. (Note that the location in this scenario is fictitious, although the landscape includes elements of the real world, and weather and climate data are representative of the region.)
The project is divided into three milestones, which will be submitted at various points throughout the course to scaffold learning and ensure quality final submissions. These milestones will be submitted in Modules Two, Four, and Six. The final submission will be in Module Seven.
In this assignment, you will demonstrate your mastery of the following course outcomes:
· Draw basic connections between the Earth’s spheres for their implications on human activities
· Utilize basic geoscience information and data in determining how environmental settings are shaped by landform processes
· Connect key lithospheric processes to the theory of plate tectonics for determining the potential for natural hazards
· Analyze local weather patterns by summarizing how fundamental atmospheric processes create resultant weather and climate
Prompt
Imagine you are an intern working for an environmental consulting firm. One of the firm’s clients is considering building a subdivision .
The document discusses assessing climate change vulnerability for ecosystems in the Southeast and Caribbean. It describes a two-phase approach: Phase 1 qualitatively assesses sensitivity, exposure, and adaptive capacity based on literature and GIS data for 12 ecosystems. Phase 2 quantitatively assesses vulnerability for two ecosystems using the Habitat Climate Change Vulnerability Index, which calculates climate stress, envelope shift, and overall vulnerability scores. The assessment finds moderate to high vulnerability for the ecosystems studied. It identifies uncertainties and needs for incorporating additional factors and assessing more ecosystems.
Controlled assessment guidance and linksDavid Rogers
This document provides instructions for a controlled assessment on coastal management in Start Bay, England. It outlines three parts to the assessment: 1) Writing an introduction to describe the location, reasons for choosing Start Bay, and historical flooding events. 2) Telling the story of how the village of Hallsands was washed away by the sea. 3) Setting up an investigation with a hypothesis, key questions, and description of fieldwork techniques to answer the questions. Maps, photographs and additional resources are provided to incorporate into the assessment.
1
GEO347 – Climatic Geomorphology
Exercise #1 – Hillslope Stability: Analyses and Applications
Handed out: February 19, 2020
Write-up due: March 6, 2020
Purpose:
This exercise explores more deeply some of the mass wasting concepts covered in lectures. In Part (A)
we will make observations and collect some data for use in Part (B).
General Geologic Setting. Montara Mountain and the Devil's Slide area are located within the
California Coast Range Geomorphic Province, which consists of a series of northwesterly trending
ridges and valleys formed by compressional tectonic forces. The geologic units located within the study
area consist of Cretaceous Montara Mountain granodiorite overlain with Paleocene age sedimentary
rock. Granodiorite is a coarse-grained plutonic rock consisting of quartz, plagioclase and potassium
feldspar, biotite, hornblende, or, more rarely pyroxene. It is in fault contact with the overlying
sedimentary rock consisting of sandstone, shale, and conglomerate. The sedimentary rock within the
study area is steeply dipping, folded, faulted, and further disturbed by repeated episodes of landslides.
The fault separating these two units is an inactive, oblique fault that descends northwest across the cliff
face. Colluvium and shallow slide debris are found throughout the slide, above and below the roadway.
Source: U.S. Department of Transpiration and The State of California, Department of Transportation,
1986.
Part A (40 points) – To be worked on in class and written up outside class:
1. For this question we will examine a long-standing problem stretch of highway #1 along the California
coastline north of Half Moon Bay. The general geologic setting is described below, and a photograph is
provided separately (also posted on UBlearns). After reading about the general geologic setting, look
carefully at the left side of the photo.
Find the bedding (layering) of the sedimentary rocks. Don’t be confused by the ravines eroded by water.
Which way does the bedding dip? Explain why this makes the area more vulnerable to landslides. (Hint:
See Table 1, reproduced from Ritter et al. 2011)
2. For this question we will measure slopes at Devil’s Slide. The method for calculating slope from
topographic maps is shown in Figure 1. Figure 2 shows a portion of the Montara Mountain USGS 7.5-
minute Quadrangle. A scale is provided as this image does not retain the original 1:24K scale. Points (A)
and (B) show locations where landslides have occurred several times of the past 30 years.
Determine the average slope of the land surface from the shore to the highway at (A) and (B). Repeat for
an equal horizontal distance above the highway. Be sure to get your group’s numbers written down for
later calculations. Compare the slopes at (A) and (B) to those on the headland (C). Discuss why the
headland denudation rates are lower than those at (A) and (B).
2
tan 𝛼 = !!
.
1
GEO347 – Climatic Geomorphology
Exercise #1 – Hillslope Stability: Analyses and Applications
Handed out: February 19, 2020
Write-up due: March 6, 2020
Purpose:
This exercise explores more deeply some of the mass wasting concepts covered in lectures. In Part (A)
we will make observations and collect some data for use in Part (B).
General Geologic Setting. Montara Mountain and the Devil's Slide area are located within the
California Coast Range Geomorphic Province, which consists of a series of northwesterly trending
ridges and valleys formed by compressional tectonic forces. The geologic units located within the study
area consist of Cretaceous Montara Mountain granodiorite overlain with Paleocene age sedimentary
rock. Granodiorite is a coarse-grained plutonic rock consisting of quartz, plagioclase and potassium
feldspar, biotite, hornblende, or, more rarely pyroxene. It is in fault contact with the overlying
sedimentary rock consisting of sandstone, shale, and conglomerate. The sedimentary rock within the
study area is steeply dipping, folded, faulted, and further disturbed by repeated episodes of landslides.
The fault separating these two units is an inactive, oblique fault that descends northwest across the cliff
face. Colluvium and shallow slide debris are found throughout the slide, above and below the roadway.
Source: U.S. Department of Transpiration and The State of California, Department of Transportation,
1986.
Part A (40 points) – To be worked on in class and written up outside class:
1. For this question we will examine a long-standing problem stretch of highway #1 along the California
coastline north of Half Moon Bay. The general geologic setting is described below, and a photograph is
provided separately (also posted on UBlearns). After reading about the general geologic setting, look
carefully at the left side of the photo.
Find the bedding (layering) of the sedimentary rocks. Don’t be confused by the ravines eroded by water.
Which way does the bedding dip? Explain why this makes the area more vulnerable to landslides. (Hint:
See Table 1, reproduced from Ritter et al. 2011)
2. For this question we will measure slopes at Devil’s Slide. The method for calculating slope from
topographic maps is shown in Figure 1. Figure 2 shows a portion of the Montara Mountain USGS 7.5-
minute Quadrangle. A scale is provided as this image does not retain the original 1:24K scale. Points (A)
and (B) show locations where landslides have occurred several times of the past 30 years.
Determine the average slope of the land surface from the shore to the highway at (A) and (B). Repeat for
an equal horizontal distance above the highway. Be sure to get your group’s numbers written down for
later calculations. Compare the slopes at (A) and (B) to those on the headland (C). Discuss why the
headland denudation rates are lower than those at (A) and (B).
2
tan 𝛼 = !!
!!
..
Revision Powerpoint focussing on World At Risk missstarkie
This document provides revision guidance for an exam on global challenges, highlighting key areas to focus on, such as Section A questions from a past paper and controversy over global warming. It emphasizes revising the specification, avoiding rushing simple questions, and writing to the mark allocation for different question types. The document stresses learning from mistakes and using examples to support explanations. Lastly, it notes last minute cramming sessions scheduled for the upcoming exam.
- This document is a mark scheme for a GCE Geography exam assessing global challenges. It provides guidance to examiners on how to apply marks consistently and use the full range of marks.
- The mark scheme then provides answers and marks for multiple choice and longer answer questions on topics like natural hazards, climate change impacts and telecommunications. Sample student responses are given for questions on these topics.
- Examiners are instructed to reward students for what they have shown they can do rather than penalizing omissions, and to mark answers according to the scheme rather than perceptions of grade boundaries.
Global challenges mark scheme january 2009Sally Longford
The document is a mark scheme for a GCE Geography exam administered by Edexcel in January 2009. It provides the questions, acceptable answers, and marks awarded for each question on the exam. The mark scheme offers guidance to examiners on how to evaluate students' responses for each question on the test, which covered topics such as plate tectonics, climate change, migration, and globalization. It aims to ensure examiners apply evaluation criteria consistently and accurately across all exam scripts.
This document discusses geological maps, including what they are, their features and parts. A geological map portrays the distribution of rocks and geological structures on Earth's surface. It shows features like faults, folds, rock layers and more through the use of colors, patterns and symbols. Key parts of a geological map include the legend, interpretation, title, susceptibility and sources. Symbols convey information about geological age, formations, rock types and structures. Geological maps are an important tool that provide information for understanding earth resources, hazards and environments.
This document provides guidance for students on investigating crowded coasts as part of a geography unit. It outlines various fieldwork and research techniques students could employ organized under four strands: competition for coasts, coping with pressure, increasing risks, and coastal management. Examples of one-day and two-day fieldwork itineraries are given to demonstrate how different techniques could be combined at coastal locations. The document also discusses opportunities for follow-up research and preparation for examinations through activities like methodology write-ups, data analysis and presentation, and fieldwork evaluations. Revision tips are provided, emphasizing selection of key details from fieldwork and location-specific knowledge.
The document discusses management strategies for coastal environments to ensure conservation and sustainable use. It should describe both "hard" and "soft" engineering techniques used to manage coastal erosion and flooding, as well as non-structural approaches like coastal zoning and education programs. Effective management requires balancing environmental protection with public access and development.
This document summarizes a study on mapping liquefaction hazard zonation in Dahej, India. It discusses evaluating liquefaction potential at both the macro and micro levels. At the macro level, factors like geology, age of deposits, water table, geomorphology, and seismicity of the area were considered to determine liquefaction susceptibility. At the micro level, soil properties from borehole data like lithology, soil classification, and SPT values at different depths were examined. Twenty-seven representative boreholes were selected for detailed analysis. Maps of geology, geomorphology, and water table were presented. The study area was found to have moderate-high liquefaction potential based on the macro factors analyzed.
This document outlines the objectives and methodology for a GCSE fieldwork assignment on how and why natural features vary along the River Alyn in Wales. Students will observe and describe river landforms and collect data on changes to the river channel and materials transported downstream. They will use methods like field sketching, pebble analysis, and flow depth and velocity measurements. Higher-level students will explain how landforms are shaped by erosion and deposition processes and analyze trends in the collected data. Students will write a 1,200-word report presenting their findings and evaluating their fieldwork methods.
The document provides instructions for completing a geography report on a chosen topic or title. It outlines the key steps and sections required, including: collecting information from various sources to answer provided questions; annotating a map to show relevant locations; writing introductory background information; discussing effects and obtaining different stakeholder perspectives; and concluding with a summary and thoughts on sustainability and the future. Sources must be properly cited in-text and in a reference list. Self-assessment criteria are also to be used to evaluate strengths and weaknesses. The final report should include basic identifying information on the cover page.
The document provides guidance on how to be successful on exams by interpreting exam questions correctly. It explains that students should carefully read the command words and key words in exam questions to understand exactly what is being asked. Command words indicate what type of answer is expected, such as "explain" or "compare". Key words show the topic being discussed and how it has been narrowed, and may point to specific examples or case studies required. Understanding the command words and key words is essential to answering the right question and addressing the specific focus required to earn marks.
The document describes a fieldtrip to Dorset in May 2010 that included visits to Swanage Bay, Lulworth Cove, Durdle Door and Studland. The fieldtrip took the group to coastal areas in Dorset, England to see geological formations and landmarks.
The document outlines the objectives and methodology for a GCSE fieldwork assignment on coastal landforms in Swanage, England. All students will describe coastal defences, landforms, and complete location maps. Most students will label photos/sketches, compare defences, and describe data collection methods. Some students will assess defence effectiveness, explain landform locations, and suggest limitations. The assignment involves setting the scene, describing methods, presenting and analyzing data, and evaluating findings. Students will investigate how and why coastal features vary along the Swanage coastline.
This document provides advice to students on preparing for and maximizing their performance on GCSE Geography exams. It emphasizes the importance of following exam rubrics and techniques like using command words correctly, writing concise yet detailed answers, practicing time management skills, and thoroughly revising case studies, as getting even one additional mark can make the difference between grades. Not fully preparing case studies or wasting time on questions can negatively impact exam scores.
June 2009 Global Challenges Resource BookletHarpal Bains
This document contains a resource booklet for an Edexcel GCE Geography exam on global challenges. It includes 10 figures with data and maps on topics like natural hazards, population growth, urbanization, internet connectivity, climate change impacts and surveys of family structures over time. The figures provide supporting information for exam questions on human and environmental geography concepts.
Command words are important terms in exam questions that indicate what needs to be done in the answer. The command word "compare" refers to describing both the similarities and differences between two things. When comparing, it is helpful to use comparative adjectives like larger than or smaller than. Other common command words include analyze, assess, contrast, describe, evaluate, explain, how far, and justify, each of which requires a specific type of response.
The document discusses plans to redevelop Carlyon Bay in Cornwall through tourism and construction projects including new sea defenses, a visitor center, and holiday apartments that will generate 400 jobs and £21 million annually for the local economy. It also mentions other areas in Cornwall like Watergate Bay, which has hotels, restaurants, and an extreme sports academy, and Constantine Bay, which has sand dunes and a youth hostel. Measurements will be taken of beaches and some existing sea defenses are noted along with buildings to be protected in these areas.
How to Interpret Trends in the Kalyan Rajdhani Mix Chart.pdfChart Kalyan
A Mix Chart displays historical data of numbers in a graphical or tabular form. The Kalyan Rajdhani Mix Chart specifically shows the results of a sequence of numbers over different periods.
Have you ever been confused by the myriad of choices offered by AWS for hosting a website or an API?
Lambda, Elastic Beanstalk, Lightsail, Amplify, S3 (and more!) can each host websites + APIs. But which one should we choose?
Which one is cheapest? Which one is fastest? Which one will scale to meet our needs?
Join me in this session as we dive into each AWS hosting service to determine which one is best for your scenario and explain why!
HCL Notes and Domino License Cost Reduction in the World of DLAUpanagenda
Webinar Recording: https://www.panagenda.com/webinars/hcl-notes-and-domino-license-cost-reduction-in-the-world-of-dlau/
The introduction of DLAU and the CCB & CCX licensing model caused quite a stir in the HCL community. As a Notes and Domino customer, you may have faced challenges with unexpected user counts and license costs. You probably have questions on how this new licensing approach works and how to benefit from it. Most importantly, you likely have budget constraints and want to save money where possible. Don’t worry, we can help with all of this!
We’ll show you how to fix common misconfigurations that cause higher-than-expected user counts, and how to identify accounts which you can deactivate to save money. There are also frequent patterns that can cause unnecessary cost, like using a person document instead of a mail-in for shared mailboxes. We’ll provide examples and solutions for those as well. And naturally we’ll explain the new licensing model.
Join HCL Ambassador Marc Thomas in this webinar with a special guest appearance from Franz Walder. It will give you the tools and know-how to stay on top of what is going on with Domino licensing. You will be able lower your cost through an optimized configuration and keep it low going forward.
These topics will be covered
- Reducing license cost by finding and fixing misconfigurations and superfluous accounts
- How do CCB and CCX licenses really work?
- Understanding the DLAU tool and how to best utilize it
- Tips for common problem areas, like team mailboxes, functional/test users, etc
- Practical examples and best practices to implement right away
Building Production Ready Search Pipelines with Spark and MilvusZilliz
Spark is the widely used ETL tool for processing, indexing and ingesting data to serving stack for search. Milvus is the production-ready open-source vector database. In this talk we will show how to use Spark to process unstructured data to extract vector representations, and push the vectors to Milvus vector database for search serving.
Best 20 SEO Techniques To Improve Website Visibility In SERPPixlogix Infotech
Boost your website's visibility with proven SEO techniques! Our latest blog dives into essential strategies to enhance your online presence, increase traffic, and rank higher on search engines. From keyword optimization to quality content creation, learn how to make your site stand out in the crowded digital landscape. Discover actionable tips and expert insights to elevate your SEO game.
Ivanti’s Patch Tuesday breakdown goes beyond patching your applications and brings you the intelligence and guidance needed to prioritize where to focus your attention first. Catch early analysis on our Ivanti blog, then join industry expert Chris Goettl for the Patch Tuesday Webinar Event. There we’ll do a deep dive into each of the bulletins and give guidance on the risks associated with the newly-identified vulnerabilities.
Digital Marketing Trends in 2024 | Guide for Staying AheadWask
https://www.wask.co/ebooks/digital-marketing-trends-in-2024
Feeling lost in the digital marketing whirlwind of 2024? Technology is changing, consumer habits are evolving, and staying ahead of the curve feels like a never-ending pursuit. This e-book is your compass. Dive into actionable insights to handle the complexities of modern marketing. From hyper-personalization to the power of user-generated content, learn how to build long-term relationships with your audience and unlock the secrets to success in the ever-shifting digital landscape.
Skybuffer AI: Advanced Conversational and Generative AI Solution on SAP Busin...Tatiana Kojar
Skybuffer AI, built on the robust SAP Business Technology Platform (SAP BTP), is the latest and most advanced version of our AI development, reaffirming our commitment to delivering top-tier AI solutions. Skybuffer AI harnesses all the innovative capabilities of the SAP BTP in the AI domain, from Conversational AI to cutting-edge Generative AI and Retrieval-Augmented Generation (RAG). It also helps SAP customers safeguard their investments into SAP Conversational AI and ensure a seamless, one-click transition to SAP Business AI.
With Skybuffer AI, various AI models can be integrated into a single communication channel such as Microsoft Teams. This integration empowers business users with insights drawn from SAP backend systems, enterprise documents, and the expansive knowledge of Generative AI. And the best part of it is that it is all managed through our intuitive no-code Action Server interface, requiring no extensive coding knowledge and making the advanced AI accessible to more users.
For the full video of this presentation, please visit: https://www.edge-ai-vision.com/2024/06/temporal-event-neural-networks-a-more-efficient-alternative-to-the-transformer-a-presentation-from-brainchip/
Chris Jones, Director of Product Management at BrainChip , presents the “Temporal Event Neural Networks: A More Efficient Alternative to the Transformer” tutorial at the May 2024 Embedded Vision Summit.
The expansion of AI services necessitates enhanced computational capabilities on edge devices. Temporal Event Neural Networks (TENNs), developed by BrainChip, represent a novel and highly efficient state-space network. TENNs demonstrate exceptional proficiency in handling multi-dimensional streaming data, facilitating advancements in object detection, action recognition, speech enhancement and language model/sequence generation. Through the utilization of polynomial-based continuous convolutions, TENNs streamline models, expedite training processes and significantly diminish memory requirements, achieving notable reductions of up to 50x in parameters and 5,000x in energy consumption compared to prevailing methodologies like transformers.
Integration with BrainChip’s Akida neuromorphic hardware IP further enhances TENNs’ capabilities, enabling the realization of highly capable, portable and passively cooled edge devices. This presentation delves into the technical innovations underlying TENNs, presents real-world benchmarks, and elucidates how this cutting-edge approach is positioned to revolutionize edge AI across diverse applications.
A Comprehensive Guide to DeFi Development Services in 2024Intelisync
DeFi represents a paradigm shift in the financial industry. Instead of relying on traditional, centralized institutions like banks, DeFi leverages blockchain technology to create a decentralized network of financial services. This means that financial transactions can occur directly between parties, without intermediaries, using smart contracts on platforms like Ethereum.
In 2024, we are witnessing an explosion of new DeFi projects and protocols, each pushing the boundaries of what’s possible in finance.
In summary, DeFi in 2024 is not just a trend; it’s a revolution that democratizes finance, enhances security and transparency, and fosters continuous innovation. As we proceed through this presentation, we'll explore the various components and services of DeFi in detail, shedding light on how they are transforming the financial landscape.
At Intelisync, we specialize in providing comprehensive DeFi development services tailored to meet the unique needs of our clients. From smart contract development to dApp creation and security audits, we ensure that your DeFi project is built with innovation, security, and scalability in mind. Trust Intelisync to guide you through the intricate landscape of decentralized finance and unlock the full potential of blockchain technology.
Ready to take your DeFi project to the next level? Partner with Intelisync for expert DeFi development services today!
In the realm of cybersecurity, offensive security practices act as a critical shield. By simulating real-world attacks in a controlled environment, these techniques expose vulnerabilities before malicious actors can exploit them. This proactive approach allows manufacturers to identify and fix weaknesses, significantly enhancing system security.
This presentation delves into the development of a system designed to mimic Galileo's Open Service signal using software-defined radio (SDR) technology. We'll begin with a foundational overview of both Global Navigation Satellite Systems (GNSS) and the intricacies of digital signal processing.
The presentation culminates in a live demonstration. We'll showcase the manipulation of Galileo's Open Service pilot signal, simulating an attack on various software and hardware systems. This practical demonstration serves to highlight the potential consequences of unaddressed vulnerabilities, emphasizing the importance of offensive security practices in safeguarding critical infrastructure.
Freshworks Rethinks NoSQL for Rapid Scaling & Cost-EfficiencyScyllaDB
Freshworks creates AI-boosted business software that helps employees work more efficiently and effectively. Managing data across multiple RDBMS and NoSQL databases was already a challenge at their current scale. To prepare for 10X growth, they knew it was time to rethink their database strategy. Learn how they architected a solution that would simplify scaling while keeping costs under control.
Let's Integrate MuleSoft RPA, COMPOSER, APM with AWS IDP along with Slackshyamraj55
Discover the seamless integration of RPA (Robotic Process Automation), COMPOSER, and APM with AWS IDP enhanced with Slack notifications. Explore how these technologies converge to streamline workflows, optimize performance, and ensure secure access, all while leveraging the power of AWS IDP and real-time communication via Slack notifications.
Let's Integrate MuleSoft RPA, COMPOSER, APM with AWS IDP along with Slack
Jan 2009 Geog Investigation Mark Scheme
1. Mark Scheme January 2009
GCE
GCE Geography (6GE02)
Edexcel Limited. Registered in England and Wales No. 4496750
Registered Office: One90 High Holborn, London WC1V 7BH
3. 6GE02 Mark Scheme
Question Number Question
1(a) Describe the characteristics and tracks of the two storms.
QWC (i, ii, iii)
Series Indicative content
Ivan Jeanne
Characteristics Few deaths despite high Greatest number of deaths, although
intensity Cat 5 storm. Much of only tropical storm strength.
the high intensity hurricane Secondary problems of floods and
activity was over the sea. landslides (caused by high rainfall)
Predictably lost lots of its are indicated on the resource.
energy on landfall. Relatively slow.
122 deaths 3000 deaths
Damage $21 billion $7.6 billion damages
Tracks A more westerly track An easterly track, doing an unusual
compared to Jeanne. Also loop-the-loop sequence. This may
looped the loop. Travelled over have may it harder to predict and
sea long time before striking evacuate.
landfall. May have made Shorter overall track than Ivan, but
prediction easier. more power over land
Level Mark Descriptor
Level 1 1-4 Basic use of diagram only with one or two descriptive lift-offs only. Lacks
structure and depth. Considerable errors in language.
Level 2 5-7 Describes some of the characteristics and track for both storms / one storm in
depth. May be unbalanced. Some structure, and some written language
errors.
Level 3 8-10 A clear response with effective use of resource and data. Describes
characteristics and tracks for both storms. Structured and balanced response.
Written language errors are rare.
8GE01 GCE Geography 19
0901
4. Question Number Question
1(b) Describe the fieldwork and research you would undertake in order to
QWC (i, ii, iii) investigate changing weather conditions.
Series Indicative content
• Observation of changing weather conditions can conducted over different time periods, e.g. few
days to look at changes associated with a depression, or over 1 term / even a year. Expect
students to discuss weather diaries which can take a mixture of forms, e.g. e-diary (on web),
written notes, video / pictures.
• Expect many candidates to record changes in air masses, weather systems, anticyclones etc and
link to synoptic conditions.
• Some candidates may also recognise that the most reliable records involve the use of a range of
techniques and research opportunities. Data could also be pooled as a group.
Fieldwork Use of various local weather instruments, e.g.
(primary): anemometer, thermometer, whirling psychrometer, rain
gauges etc. Also more qualitative observations, e.g.
changes in cloud cover, what it ‘feels’ like, whether the
heating is required, seeing starts at night.
Research Use of various sources to get a picture of weather –
(secondary): websites, newspapers, blogs / forums etc.
The best responses will provide detailed evidence of
specific sources, e.g. specialist weather websites etc,
rather than ‘the internet’.
Note: It is important to distinguish which fieldwork and research is relevant to weather and which is
not (e.g. rivers / flooding, land use etc).
Always credit relevant descriptions of fieldwork (including virtual) from both UK and overseas
locations.
Level Mark Descriptor
Level 1 1-4 Very limited range of fieldwork / research described. Fieldwork may be not
appropriate to weather studies. Lacks structure. Considerable errors in
language.
Level 2 5-8 Descriptive style but with some statements about either fieldwork or research
approaches linked to weather. May be a description that lacks focus on the
question / less relevant techniques. Likely to be unbalanced and lacking
detail. Expect limited use of geographical terminology. There are some
written language errors.
Level 3 9-12 Describes a range of fieldwork and/or research approaches linked to weather,
but may lack balance. Some use of geographical terminology. Response shows
some structure, limited written language errors.
Max 10 if only fieldwork or research.
Level 4 13-15 Structured account which describes a balanced range of personal weather
fieldwork and research techniques in detail; shows good use of own / group
fieldwork, with good use of terminology. Written language errors are rare.
8GE01 GCE Geography 20
0901
5. Question Number Question
1(c) For ONE extreme weather event describe the methods of management used
QWC (i, ii, iii) and comment on their effectiveness.
Series Indicative content
Candidates may choose from a range of extreme weather events – hurricanes, river floods, tornado,
heatwave, or drought.
Detail of management strategies will depend on choice of event and location e.g. Levees /
evacuation / preparedness linked to hurricane Katrina, land use zoning related to river flooding,
warnings and shelter for tornadoes, emergency water management for droughts or longer term
water management in preparation for drought.
• Some candiadtes may describe top-down vs bottom up or the role of community preparedness /
participation and education.
• Some responses may consider factors, i.e. which are more important, rather than a decsription
of different types of approach.
• Credit reference to own fieldwork and research.
Level Mark Descriptor
Level 1 1-4 Extreme weather event may not be identified. Basic, generalised points that
lack focus on management; may focus on impacts of extreme weather event.
Lacks structure; very limited use of geographical terminology. Considerable
errors in language.
Level 2 5-7 Some management methods identified for an extreme weather event, with
some description and occasional comment. Some structure. Likely to be
unbalanced. Some written language errors.
Level 3 8-10 Detailed description of management methods linked to extreme weather event
with some comments on their effectiveness. Well structured and balanced
response. Written language errors are rare.
8GE01 GCE Geography 21
0901
6. Question Number Question
2(a) Describe the physical and human features of the coast shown in the
QWC (i, ii, iii) photograph.
Series Indicative content
The photo reveals a range of features:
Physical Human
• Spit / bar /tombolo • Groynes on beaches (to build up
• Beaches / cliffs sand and reduce impact of LSD)
• Natural habour / bay for shelter • Port
• Sand dune ecosystems / • Settlement in distance /urban
saltmarsh • New shoreline homes / hotels
• Various sand banks / mud flats built
and shallow (safe) water. • Road leading to ferry; ferries /
• Woodland near coast and scrub in boats
foreground, e.g. gorse etc. • Footpaths in dunes / coastal
areas
Some candidates may attempt to recognise scale of different features, e.g. length of spit /
tombolo; also identify the importance of deposition also this stretch of coast.
Structure likely to be physical and human elements or geographical approach e.g.
foreground/background/along shoreline, etc
Remember that the question requires description, so do not overly credit explanation.
Level Mark Descriptor
Level 1 1-4 Lacks structure, limited range of features described; lacks accuracy and
limited use of geographical terminology. Considerable errors in language.
Level 2 5-7 Some range of features described with some accuracy, physical and/or
human, but may be unbalanced. Some structure. Some written language
errors.
Level 3 8-10 A detailed, accurate description with effective use of resource across a range
of both physical and human features. Well structured good, use of correct
terminology to identify features. Written language errors are rare.
8GE01 GCE Geography 22
0901
7. Question Number Question
2(b) Describe the fieldwork and research you would undertake in order to
QWC (i, ii, iii) investigate changes in coastal land use over time.
Series Indicative content
There are a range of fieldwork opportunities – expect these to include:
Fieldwork Create land use map and compare to historic plans; speaking to
(primary): residents and visitors (questionnaires / structured interviews),
oral histories, footfalls, parking etc. Use of video or
transcripts to record ideas (could be group approach). Rates of
erosion if linked to landuse change (could be secondary too).
Research Historic maps to illustrate change, e.g. www.old-maps.co.uk ;
(secondary): also local newspapers, blogs / forums etc. Old photographs
and post cards may be a useful source (again could be internet
sourced). Possible use of GIS / electronic maps / satellite
images to illustrate change.
The best responses will provide detailed evidence of specific
sources, e.g. specialist local historical websites etc, rather
than ‘the internet’ .
• Provide credit for possible reference to sampling strategies, e.g. systematic and stratified,
no of people etc; also some candidates may have used a pilot survey, e.g. to format
questionnaires.
• Also credit more detailed description of land use map categories and justification for this.
• Allow liberal interpretation of ‘over time’, i.e. 150 years to 5 years (e.g. for a recent
regeneration strategy at coastal town).
Important to distinguish which fieldwork and research is relevant to coastal land use and which is
not (e.g. beach processes, sand dune surveys, costal defences etc)
Always credit relevant descriptions of fieldwork (including virtual) from both UK and overseas
locations.
Level Mark Descriptor
Level 1 1-4 Very limited range of fieldwork / research described. Fieldwork may be not
appropriate to coastal landuse. Lacks structure. Considerable errors in
language.
Level 2 5-8 Descriptive style but with some statements about either fieldwork or research
approaches linked to coastal landuse. May be a description that lacks focus on
the question / less relevant techniques. Likely to be unbalanced and lacking
detail. Expect limited use of geographical terminology. There are some
written language errors.
Level 3 9-12 Describes a range of fieldwork and/or research approaches linked to coastal
landuse, but may lack balance. Some use of geographical terminology.
Response shows some structure, limited written language errors.
Max 10 if only fieldwork or research.
Level 4 13-15 Structured account which describes a balanced range of coastal landuse
fieldwork and research techniques in detail; appreciates the time dimension,
shows good use of own / group fieldwork, with good use of terminology.
Written language errors are rare.
8GE01 GCE Geography 23
0901
8. Question Number Question
2(c) Using examples, explain why the methods of coastal management vary from
QWC (i, ii, iii) place to place.
Series Indicative content
Four coastal management options are available to decision makers:
Do nothing, Retreat, Hold the line, Advance the line.
Decisions are largely based on: land use cost-benefit (land use may be integral to this),
environmental impact assessment (EIA), feasibility studies and risk assessment.
• In general places with high land values would expect to be protected, often by hard
defences. This is largely due to presence of economic development and/or dense population.
• In contrast, little protection is offered in places where farmland, few resources, sparse
population and limited finance are found.
• ‘Value’ may alternatively be environmental, eg ecosystems, heritage, etc and here
softer/sustainable methods might be appropriate.
• Other natural factors such as geology, relief, coastal processes, etc may be relevant in
decisions.
Expect some reference to SMP’s and ICZM; role of Environment Agency or local authority
partnerships.
Best responses will tend to describe defence methods with little exemplification while the best will
provide explanation and fuller exemplification
Credit reference to own fieldwork / case studies which have linkage.
• NB Examples could be location or types of coastal management
• Max 7 for a response with only 1 type in 1 location.
Level Mark Descriptor
Level 1 1-4 Describes some management options / defences. Lacks structure and very
limited use of geographical terminology. Limited or no reference to an
examples. Considerable errors in language.
Level 2 5-7 Some methods identified to support ideas about management options, with
some explanation. Some structure. Likely to be unbalanced. There are some
written language errors.
Level 3 8-10 A clear, exemplified, explanation of why coastal management methods vary
‘from place to place’. Well structured and balanced response which uses
examples effectively. Written language errors are rare.
8GE01 GCE Geography 24
0901
9. Question Number Question
3(a) Describe the fieldwork and research you would undertake in order to
QWC (i, ii, iii) investigate economic and social inequality in an urban area.
Series Indicative content
There are a wide range of fieldwork and research activities linked to both economic and social
inequality.
Primary Range of environmental quality surveys (e.g. landscape,
data street quality etc). These are surrogate indicators for both
economic and social inequality. Questionnaires, oral
histories, extended interviews etc may also be relevant.
Opportunity for mobility / accessibility maps, clone town
surveys; graffiti assessment, litter etc. Transport data (could
also be secondary)
Secondary Use the internet to research ‘geo-demographic’ data (e.g.
research: Acorn and Cameo profiles), socio-economic profiles from
census (National Statistics). Also geo-located pictures to help
with inequality e.g. Flickr, Panoramio, Geograph etc.
May also use VOA website to further pursue shopping
inequality etc.
Provide credit for possible reference to sampling strategies, e.g. systematic and stratified, no of
people etc; also some candidates may have used a pilot survey, e.g. to format questionnaires.
Credit good distinction between economic and social inequality, although there is overalp between
technqiues. Ecocomic more likley to be focused on research rather than field-based techniques.
• Also credit candidates who indicate that quality surveys have been pre-calibrated or
customised to improve their reliability.
• Always credit relevant descriptions of fieldwork (including virtual) from both UK and
overseas locations.
• If rubric, credit generally applicable concepts and techniques up to Max 6.
• Reward candidates who link to a specfic location where they have collected information.
Level Mark Descriptor
Level 1 1-4 Very limited range of fieldwork / research described. Fieldwork may be not
appropriate to investigating inequality. Lacks structure. Considerable errors
in language.
Level 2 5-8 Descriptive style but with some statements about either fieldwork or research
approaches linked to inequality a description that lacks focus on the question
/ less relevant techniques. Likely to be unbalanced and lacking detail. Expect
limited use of geographical terminology. There are some written language
errors.
Level 3 9-12 Describes a range of fieldwork and/or research approaches linked to
inequality, but may lack balance. Some use of geographical terminology.
Response shows some structure, limited written language errors.
Max 10 if only fieldwork or research.
Level 4 13-15 Structured account which describes a balanced range of fieldwork and
research techniques to measure inequality in detail; appreciates the economic
and social dimension, shows good use of own / group fieldwork, with good use
of terminology. Written language errors are rare.
8GE01 GCE Geography 25
0901
10. Question Number Question
3(b) Study Figure 3 which shows part of a student’s investigation of deprivation
QWC (i, ii, iii) and environmental quality in a city.
Comment on the limitations of the data collection and presentation
techniques.
Series Indicative content
Data collection limitations:
• Interupted transect every 50m may mean data was missed
• Criteria for deprivation ommitted education and housing which is very important social data
• No pre-calibration of EQ scoring system
• Data only collcetd in am
• Rain may have affected quality scores (influencing judgements)
• Transect misses data on either side of road
Data presentation limitations:
• Generally graph is confusing / low usability
• Difficulty of interpreation of deprivation index and quality graphs
• No units on X axis to indicate distance (although included in title)
• Line graph may be technically incorrect to display quality data (not-continuous)
• Scales confusing on graph – index of deprivation 6 good or bad?
• Location of transect in relation to city not indicated on any type of map
Accept any reasonable ideas.
Credit reference to ways the data collection / presentation could be improved.
Level Mark Descriptor
Level 1 1-4 One or two superficial criticisms/ limitations of the ‘it was raining’ variety.
Lacks structure and very limited use of geographical terminology. Expect
considerable errors in language.
Level 2 5-7 Some comment on either data collection / presentation, unbalanced and
lacking detail. Shows some structure. There are some written language
errors.
Level 3 8-10 A clear response with valid comments on collection and presentation.
Structured, good use of geographical terminology. Written language errors are
rare.
8GE01 GCE Geography 26
0901
11. Question Number Question
3(c) For one named rural or urban area, explain why it is difficult to reduce
QWC (i, ii, iii) deprivation
Series Indicative content
Deprivation is a lack of access to services / amenities / opportunities considered the norm in a
society. The very nature and causes of deprivation are an explanation for why the problem is
difficult to solve.
There are a number of potential difficulties:
Rural Urban
• Loss of traditional employment • May be a culture of deprivation
sources, e.g. farming / fishing which is difficult to overcome.
• Deprivation may be ‘hidden’ in • Historic cycle of poverty /
rural areas (e.g. no graffiti, litter deprivation, e.g. caused by de-
etc). industrialisation – unemployment
• Lack of rural employment etc.
opportunity, e.g. limited new • Uneven distribution of resources
business start-up grants. and power.
• New technologies may not be • Social barriers, e.g. age, income,
available / realistic to some disability, religion, culture etc.
remote communities.
• Rural people may have less
‘voice’ / political sway or
interest.
• Inaccessibility / isolation
May also be some generic limitations, e.g. lack of community enthusiasm / push, lack of local or
central government funding priority, lack of technology etc. May also be physical factors, e.g.,
rivers, roads, relief etc. Accept any reasonable ideas.
• Can be LEDC / overseas, but expect more UK example(s).
• If urban and rural are both tackled, mark both and credit the best.
Level Mark Descriptor
Level 1 1-4 Identifies one or two difficulties only; no / limited reference to location. May
alternatively describe what deprivation is. Little structure and very limited
use of geographical terminology. Considerable errors in language.
Level 2 5-7 Identifies some difficulties with some explanations linked to the nature of
deprivation; reference to a named location. Some structure. There are some
written language errors.
Level 3 8-10 A structured account which considers difficulties for a location, with some
supporting detail and explanations. Well structured and balanced response.
Written language errors are rare.
8GE01 GCE Geography 27
0901
12. Question Number Question
4(a) Describe the fieldwork and research you would undertake in order to
QWC (i, ii, iii) investigate why some urban areas are in need of rebranding.
Series Indicative content
Urban can include town / city OR coastal, former coal mining area etc. Give urban a wide
interpretation.
There are a wide range of fieldlwork and research activities -
Primary Field notes, field sketches, photographs, extended
data interviews, focus groups, customised ‘placecheck form’. Also
questionnaires, retail / shopping quality, footfall / pedestrian
count and other personalised environmental quality
assessments, litter survey, graffiti assessment etc
Secondary Use the internet to research ‘geo-demographic’ data (e.g.
research: Acorn and Cameo profiles), socio-economic profiles from
census (National Statistics). Also geo-located pictures to help
with place identity e.g. Flickr, Panoramio, Geograph etc.
May also use VOA website to further pursue shopping quality
etc.
Provide credit for possible reference to sampling strategies, e.g. systematic and stratified, no. of
people etc; also some candidates may have used a pilot survey, e.g. to format questionnaires.
Credit good distinction between fieldwork and research, although there is likely overalp between
approaches.
• Also credit candidates who indicate that quality surveys have been pre-calibrated or
customised to improve their reliability.
• Always credit relevant descriptions of fieldwork (including virtual) from both UK and
overseas locations.
• If rubric, credit generally applicable concepts and techniques up to Max 6.
Level Mark Descriptor
Level 1 1-4 Very limited range of fieldwork / research described. Fieldwork may be not
appropriate to investigating the need to rebrand. Lacks structure.
Considerable errors in language.
Level 2 5-8 Descriptive style but with some statements about either fieldwork or research
approaches linked to the need to rebrand; lacks focus on the question / less
relevant techniques. Likely to be unbalanced and lacking detail. Expect
limited use of geographical terminology. There are some written language
errors.
Level 3 9-12 Describes a range of fieldwork and/or research approaches linked to the need
to rebrand, but may lack balance. Some use of geographical terminology.
Response shows some structure, limited written language errors.
Max 10 if only fieldwork or research.
Level 4 13-15 Structured account which describes a balanced range of fieldwork and
research techniques to determine the need to rebrand in detail, shows good
use of own / group fieldwork, with good use of terminology. Written language
errors are rare.
8GE01 GCE Geography 28
0901
13. Question Number Question
4(b) Study Figure 4 which shows some of the results from a students’ investigation
QWC (i, ii, iii) of a coastal town in south-west England.
Comment on the limitations of the data collection and presentation
techniques.
Series Indicative content
Data collection limitations:
• Central postcode not identified
• Postcode checkers are very generalised having large spatial area. Reliability issues.
• Postcode checkers only reveal certain types of data about people – can be missleading.
• Limited range of websites used to collect research information. No use of census / local
authority data etc which may be more reliable / detailed
• Blogs attract people who ‚like to have a rant’ – therefore likely biased.
• Photos are inherently biased – can easily show good or bad, depending on photographer
Data presentation limitations:
• Photographs not located onto any type of base map
• Photos could be eaily annotated to improve visual appeal
• No graphing up of any information, e.g. upmystreet data which could easily be done
• Annotation / interpretaion / highlighhting of blogs data would mek it more meaningful
Accept any reasonable ideas.
Level Mark Descriptor
Level 1 1-4 One or two superficial criticisms/ limitations e.g. photos too small / not
labelled. Lacks structure and very limited use of geographical terminology.
Expect considerable errors in language.
Level 2 5-7 Some comment on either data collection / presentation, unbalanced and
lacking detail. Shows some structure. There are some written language
errors.
Level 3 8-10 A clear response with valid comments on collection and presentation.
Structured, good use of geographical terminology. Written language errors are
rare.
8GE01 GCE Geography 29
0901
14. Question Number Question
4(c) With reference to examples, examine the role of different ‘players’ involved
QWC (i, ii, iii) in the rebranding process.
Series Indicative content
Players are really stakeholders, i.e. are individuals, groups or organisations who have an interest in
the development or outcomes of a particular project. They are interested parties as they may be
involved financially or emotionally as the development is within a neighbourhood close to where
they live.
Depending on projects / examples chosen there could be a number of stakeholders – ‘bigger players’
examples can include:
Urban Rural
The Arts Council offers various European Union , e.g. Objective 1
funding opportunities for arts linked programme and LEADER programme
projects.
English Partnerships - principle aim Action with Communities in Rural
is to 'deliver high quality sustainable England, or ACRE promotes local
growth in England’. rural initiatives
Advantage West Midlands – Natural England – grants to farmers
Development Agency for various agri-environmental
schemes.
Also Regional Development Agencies (can be both urban and rural); heritage Lottery Fund (HLF), Big
Lottery Fund.
Could also be local small-scale / bottom-up / community groups acting as stakeholders. Huge range
of possibilities here.
May also have mention of the important of ‘partnership’ working.
Examples can be places, players or strategies.
Level Mark Descriptor
Level 1 1-4 Identifies one or two players only, with a few generalised ideas. Little
structure and very limited use of geographical terminology. Considerable
errors in language.
Level 2 5-7 Identifies some players with some details and support. Some structure. Likely
to be unbalanced. There are some written language errors.
Level 3 8-10 A structured account which examines the role of different players with sound
supporting detail: balanced response. Written language errors are rare.
8GE01 GCE Geography 30
0901