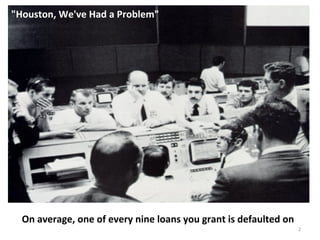
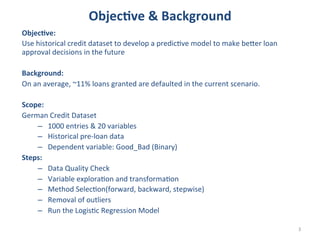
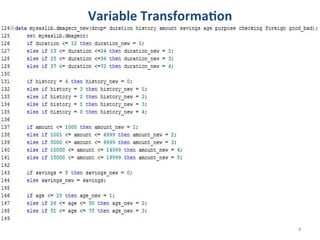
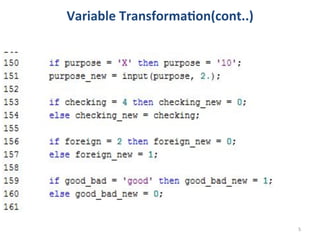
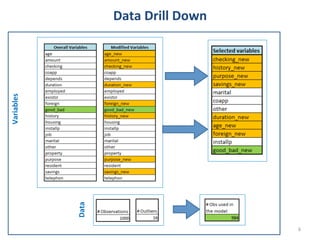
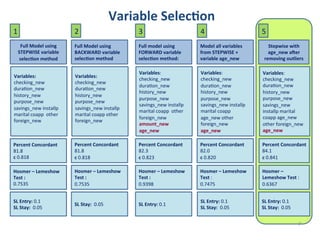
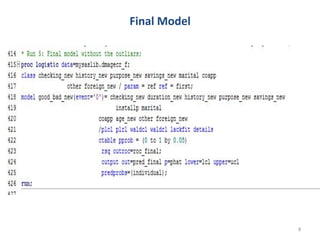
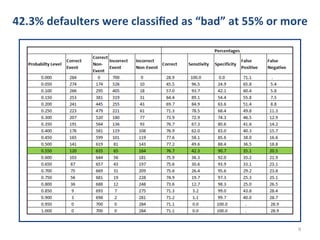
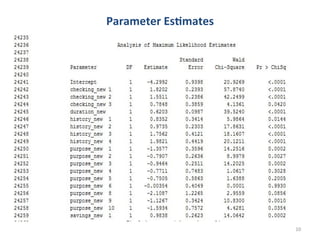
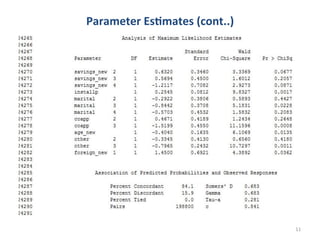
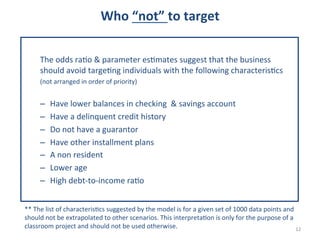
German	
  Bank	
  
Loan	
  Approval	
  Decision	
  Model	
  
Mohamed	
  Ibrahim	


  Rahul	
  Goel	
  	
  
Akanksha	
  Jain	


  Chhavi	
  Sharma	


"Houston,	
  We've	
  Had	
  a	
  Problem"	
  

On	
  average,	
  one	
  of	
  every	
  nine	
  loans	
  you	
  grant	
  is	
  defaulted	
  on	
  
2	
  
Objec<ve	
  &	
  Background	
  
Objec<ve:	
  	
  
Use	
  historical	
  credit	
  dataset	
  to	
  develop	
  a	
  predicAve	
  model	
  to	
  make	
  beBer	
  loan	
  
approval	
  decisions	
  in	
  the	
  future	


Background:	
  
On	
  an	
  average,	
  ~11%	
  loans	
  granted	
  are	
  defaulted	
  in	
  the	
  current	
  scenario.	


Scope:	
  	
  
German	
  Credit	
  Dataset	
  
–  1000	
  entries	
  &	
  20	
  variables	
  
–  Historical	
  pre-­‐loan	
  data	
  	
  
–  Dependent	
  variable:	
  Good_Bad	
  (Binary)	
  
Steps:	
  
–  Data	
  Quality	
  Check	
  
–  Variable	
  exploraAon	
  and	
  transformaAon	
  
–  Method	
  SelecAon(forward,	
  backward,	
  stepwise)	
  
–  Removal	
  of	
  outliers	
  
–  Run	
  the	
  LogisAc	
  Regression	
  Model	


3	
  
Variable	
  Transforma<on	
  

4	
  
Variable	
  Transforma<on(cont..)	
  

5	
  
Data	
  

Variables	
  

Data	
  Drill	
  Down	
  

6	
  
 Variable	
  Selec<on	
  
1

2

3

4


Full	
  Model	
  using	
  
STEPWISE	
  variable	
  
selec<on	
  method	


Full	
  Model	
  using	
  
BACKWARD	
  variable	
  
selec<on	
  method	
  

Full	
  model	
  using	
  
FORWARD	
  variable	
  
selec<on	
  method:	
  

Model	
  all	
  variables	
  
from	
  STEPWISE	
  +	
  
variable	
  age_new	


Variables:	
  	
  
checking_new	
  
duraAon_new	
  
history_new	
  
purpose_new	
  
savings_new	
  installp	
  
marital	
  coapp	
  	
  other	
  
foreign_new	


Variables:	
  	
  
checking_new	
  
duraAon_new	
  
history_new	
  
purpose_new	
  
savings_new	
  installp	
  
marital	
  coapp	
  other	
  
foreign_new	


Variables:	
  
checking_new	
  
duraAon_new	
  
history_new	
  
purpose_new	
  
savings_new	
  installp	
  
marital	
  coapp	
  	
  other	
  
foreign_new	
  
amount_new	
  
age_new	


Percent	
  Concordant	
  
82.3	
  
c	
  0.823	


Hosmer	
  –	
  Lemeshow	
  
Test	
  :	
  
0.9398	


SL	
  Entry:	
  0.1	


Variables:	
  
checking_new	
  
duraAon_new	
  
history_new	
  
purpose_new	
  
savings_new	
  installp	
  	
  
marital	
  coapp	
  
age_new	
  other	
  
foreign_new	
  	
  
age_new	


Percent	
  Concordant	
  
82.0	
  
c	
  0.820	


Hosmer	
  –	
  Lemeshow	
  
Test	
  :	
  
0.7475	


Variables:	
  
checking_new	
  
duraAon_new	
  
history_new	
  
purpose_new	
  
savings_new	
  
installp	
  marital	
  
coapp	
  age_new	
  
other	
  foreign_new	
  
age_new	


Percent	
  Concordant	
  
84.1	
  
c	
  0.841	


Hosmer	
  –	
  
Lemeshow	
  Test	
  :	
  
0.6367	


SL	
  Entry:	
  0.1	
  	
  
SL	
  Stay:	
  	
  0.05	
  

SL	
  Entry:	
  0.1	
  	
  
SL	
  Stay:	
  	
  0.05	
  

Percent	
  Concordant	
  
81.8	
  
c	
  0.818	
  
Hosmer	
  –	
  Lemeshow	
  
Test	
  :	
  
0.7535	
  
SL	
  Entry:	
  0.1	
  	
  
SL	
  Stay:	
  	
  0.05	


Percent	
  Concordant	
  
81.8	
  
c	
  0.818	


Hosmer	
  –	
  Lemeshow	
  
Test	
  :	
  
0.7535	


SL	
  Stay:	
  	
  0.05	


5
Stepwise	
  with	
  
age_new	
  aLer	
  
removing	
  outliers	
  

7	
  
Final	
  Model	
  

8	
  
42.3%	
  defaulters	
  were	
  classified	
  as	
  “bad”	
  at	
  55%	
  or	
  more	
  

9	
  
Parameter	
  Es<mates	
  

10	
  
Parameter	
  Es<mates	
  (cont..)	
  

11	
  
Who	
  “not”	
  to	
  target	


The	
  odds	
  raAo	
  &	
  parameter	
  esAmates	
  suggest	
  that	
  the	
  business	
  
should	
  avoid	
  targeAng	
  individuals	
  with	
  the	
  following	
  characterisAcs	
  
(not	
  arranged	
  in	
  order	
  of	
  priority)	


– 
– 
– 
– 
– 
– 
– 

Have	
  lower	
  balances	
  in	
  checking	
  	
  &	
  savings	
  account	
  
Have	
  a	
  delinquent	
  credit	
  history	
  	
  
Do	
  not	
  have	
  a	
  guarantor	
  	
  
Have	
  other	
  installment	
  plans	
  
A	
  non	
  resident	
  
Lower	
  age	
  
High	
  debt-­‐to-­‐income	
  raAo	
  

**	
  The	
  list	
  of	
  characterisAcs	
  suggested	
  by	
  the	
  model	
  is	
  for	
  a	
  given	
  set	
  of	
  1000	
  data	
  points	
  and	
  
should	
  not	
  be	
  extrapolated	
  to	
  other	
  scenarios.	
  This	
  interpretaAon	
  is	
  only	
  for	
  the	
  purpose	
  of	
  a	
  
classroom	
  project	
  and	
  should	
  not	
  be	
  used	
  otherwise.	
  
12	
  
Thank	
  You	
  

13	
  
Appendix	
  
• 
• 
• 
• 

CorrelaAon	
  Results	
  
Proc	
  Means	
  &	
  VIF	
  Test	
  
Outliers	
  
Proc	
  Rank	
  

14	
  
Correla<on	
  Results	
  

15	
  
Means	
  &	
  VIF	
  
Variance	
  Infla<on	
  Factor	
  
Proc	
  Means	
  

16	
  
List	
  of	
  16	
  Outliers	
  in	
  the	
  Dataset	
  

17	
  
Rank	
  Results	
  

18	
  

Predictive Model for Loan Approval Process using SAS 9.3_M1

  • 1.
    German  Bank   Loan  Approval  Decision  Model   Mohamed  Ibrahim                                                    Rahul  Goel     Akanksha  Jain                                                                      Chhavi  Sharma      
  • 2.
    "Houston,  We've  Had  a  Problem"   On  average,  one  of  every  nine  loans  you  grant  is  defaulted  on   2  
  • 3.
    Objec<ve  &  Background   Objec<ve:     Use  historical  credit  dataset  to  develop  a  predicAve  model  to  make  beBer  loan   approval  decisions  in  the  future       Background:   On  an  average,  ~11%  loans  granted  are  defaulted  in  the  current  scenario.       Scope:     German  Credit  Dataset   –  1000  entries  &  20  variables   –  Historical  pre-­‐loan  data     –  Dependent  variable:  Good_Bad  (Binary)   Steps:   –  Data  Quality  Check   –  Variable  exploraAon  and  transformaAon   –  Method  SelecAon(forward,  backward,  stepwise)   –  Removal  of  outliers   –  Run  the  LogisAc  Regression  Model     3  
  • 4.
  • 5.
  • 6.
    Data   Variables   Data  Drill  Down   6  
  • 7.
     Variable  Selec<on   1 2 3 4   Full  Model  using   STEPWISE  variable   selec<on  method     Full  Model  using   BACKWARD  variable   selec<on  method   Full  model  using   FORWARD  variable   selec<on  method:   Model  all  variables   from  STEPWISE  +   variable  age_new     Variables:     checking_new   duraAon_new   history_new   purpose_new   savings_new  installp   marital  coapp    other   foreign_new     Variables:     checking_new   duraAon_new   history_new   purpose_new   savings_new  installp   marital  coapp  other   foreign_new       Variables:   checking_new   duraAon_new   history_new   purpose_new   savings_new  installp   marital  coapp    other   foreign_new   amount_new   age_new         Percent  Concordant   82.3   c  0.823       Hosmer  –  Lemeshow   Test  :   0.9398       SL  Entry:  0.1         Variables:   checking_new   duraAon_new   history_new   purpose_new   savings_new  installp     marital  coapp   age_new  other   foreign_new     age_new       Percent  Concordant   82.0   c  0.820       Hosmer  –  Lemeshow   Test  :   0.7475     Variables:   checking_new   duraAon_new   history_new   purpose_new   savings_new   installp  marital   coapp  age_new   other  foreign_new   age_new     Percent  Concordant   84.1   c  0.841       Hosmer  –   Lemeshow  Test  :   0.6367     SL  Entry:  0.1     SL  Stay:    0.05   SL  Entry:  0.1     SL  Stay:    0.05   Percent  Concordant   81.8   c  0.818   Hosmer  –  Lemeshow   Test  :   0.7535   SL  Entry:  0.1     SL  Stay:    0.05     Percent  Concordant   81.8   c  0.818       Hosmer  –  Lemeshow   Test  :   0.7535       SL  Stay:    0.05     5 Stepwise  with   age_new  aLer   removing  outliers   7  
  • 8.
  • 9.
    42.3%  defaulters  were  classified  as  “bad”  at  55%  or  more   9  
  • 10.
  • 11.
  • 12.
    Who  “not”  to  target     The  odds  raAo  &  parameter  esAmates  suggest  that  the  business   should  avoid  targeAng  individuals  with  the  following  characterisAcs   (not  arranged  in  order  of  priority)     –  –  –  –  –  –  –  Have  lower  balances  in  checking    &  savings  account   Have  a  delinquent  credit  history     Do  not  have  a  guarantor     Have  other  installment  plans   A  non  resident   Lower  age   High  debt-­‐to-­‐income  raAo   **  The  list  of  characterisAcs  suggested  by  the  model  is  for  a  given  set  of  1000  data  points  and   should  not  be  extrapolated  to  other  scenarios.  This  interpretaAon  is  only  for  the  purpose  of  a   classroom  project  and  should  not  be  used  otherwise.   12  
  • 13.
  • 14.
    Appendix   •  •  •  •  CorrelaAon  Results   Proc  Means  &  VIF  Test   Outliers   Proc  Rank   14  
  • 15.
  • 16.
    Means  &  VIF   Variance  Infla<on  Factor   Proc  Means   16  
  • 17.
    List  of  16  Outliers  in  the  Dataset   17  
  • 18.