This is the first session (Sep 4) of our Free Open Advanced Branding Masterclass at www.mootee.typepad.com. Pls rememebr no books are needed. We will forward additional reading material for all registered participants.
A brand strategy is a plan for brand management that answers the big questions: who, where, why, what and when?
Building a strong brand requires a continuous commitment to excellence and an understanding of the qualities that define
the brand.
Here a practical guide to help you outline a successful Brand strategy.
A BRAND IS FOREVER! A FRAMEWORK FOR REVITALIZING DECLINING AND DEAD BRANDS
2. REVIVAL OF A DEAD BRAND The revitalization of a brand is usually less costly and risky than introducing a new brand, which can cost tens of millions and will more likely fail than succeed -Aaker(1991)
3. REVIVAL OF A DEAD BRAND  neither the lifespan of a brand nor its ultimate destiny is predetermined  But, brand decline is a reversible process  Ex: Harley Davidson and ford after facing great competition lost their hold still regained their status because of their brand value.
4. REVIVAL OF A DEAD BRAND The revitalization of a brand is usually less costly and risky than introducing a new brand, which can cost tens of millions and will more likely fail than succeed -Aaker(1991)
5. DECLINE AND DEATH OF BRANDS Brand equity framework: The differential effect that consumer knowledge about a brand has on the customer’s response to marketing activity, and consumer brand knowledge can be characterized in terms of brand awareness and brand image dimensions A brand with strong equity has high awareness and consumers hold strong, favourable, and unique brand associations
6. DECLINE AND DEATH OF BRANDS Pan am and Oldsmobile (general electrical) examples illustrate that even well-known brands can decline as a result of a wide variety of factors.
7. CAUSES OF BRAND DECLINE Product life cycle (PLC) framework: identifies four stages: introduction, growth, maturity, and decline. It uses sales to define the stages of the life cycle, which in turn are used to predict sales. Different forces leads to brand’s evolution • Managerial actions • Environmental factors • Competitive actions
8. CAUSES OF BRAND DECLINE MANAGERIAL ACTIONS Brands often decline because of leadership, management, and employees making excuses rather than acting with integrity Managerial actions which can cause this are: product quality, price increases, price cuts, brand neglect, and inability to stay with the target market.
9. CAUSES OF BRAND DECLINE MANAGERIAL ACTIONS Product quality: When compromises in product quality for cost-cutting reasons • do not impact brand loyalty in the short run, • managers mistakenly conclude that consumers are willing to accept or live with the change. • At some point when customers’ experiences with the brand do not live up to their expectations, • the brand starts to decline.
10. CAUSES OF BRAND DECLINE MANAGERIAL ACTIONS Price increases : If a company continues to raise prices without offering a corresponding increase in benefits, sooner or later consumers will start to abandon the brand. Volkswagen launched golf but was unable to control costs and had to keep raising prices, until it effectively drove itself out of the entry-level segment where it had once been a leader
11. CAUSES OF BRAND DECLINE MANAGERIAL ACTIONS Price cuts: When a company cuts prices in desperation to increase
Zappos Case Analysis Itm Fenway Cohort Team 9Ashish Tandon
Presentation on Zappos competitive advantage using Twitter and other social media tools to reach out to their target consumer and generate active interest in their business
In this presentation, we will discuss about the value of a brand, why consumers are willing to pay for the brand, the core value of a product, the importance of brand personality and total value proposition. We will also understand value through Porter’s Value Chain and Levitt’s four level model, meaning of brand proposition and USP.
To know more about Welingkar School’s Distance Learning Program and courses offered, visit:
http://www.welingkaronline.org/distance-learning/online-mba.html
A creative brief is a unifying document that identifies the important key benefits for a campaign or launch. It tells the story and explains why it’s important to the audience, serving as a guide for the creation of new materials. It seems simple. Yet developing an effective creative brief is far more difficult that it may first seem. Learn more about the creative brief and download our free creative map template for 11 critical questions to help you craft a killer creative roadmap.
This slide show was part of a presentation on the retailing and distribution model of GoPro. This slide show covers the evolution of the GoPro camera, how the GoPro camera is distributed, and finally ends with a heroic video, which presents the rescue of a kitten in a burning house from the POV of the fireman.
The objective of this presentation is to demonstrate how well we understand the marketing research practices taught by Prof. David Rice at Schulich School of Business, York University in Toronto, Canada.
Zuzatz sandal shoes with interchangeable strapsZuzatz Sandals
Zuzatz womens sandals and womens flip flops are fashionable shoe sandals and flip flop sandals. With a single Zuzatz sandal base, you can mix and match a stylish array of interchangeable straps. For sandals shoes, womens sandal shoes, women flip flops, or women sandals, shop http://www.zuzatz.com.
Greensole, recycles discarded sports shoes to comfortable footwear and provide them to the neediest through corporates, NGOs and schools. Greensole also market a part of the footwear manufactured towards building a self-sustaining social venture.
Our MBA Pricing Strategy final project analyzed the Internet TV set top box market We surveyed 50 consumers and segmenting the respondents based on their utility values for a series of features for Apple and Google TV devices. From these results we projected each vendors market share and recommending product and pricing strategies.
Sports simba deals with all sports equipment, specifically designed to be worn for participating in various sports. Since friction between the foot and the ground is an important force in most sports, modern athletic shoes are designed to maximize this force, and materials, such as rubber, are used.
Marketing Research and Consumer Behavior Report for Sandals Resorts
Created a professional brand management market segmentation report for Sandals Resorts including a market situation analysis, psychographic, demographic, geodemographics, and product-related behavioral characteristics, consumer market segmentation analysis, identified Sandals Resorts target market, VALS2, PRIZM, consumer benefit segmentation, market size and sales potential, consumer decision process model, identified consumer problems and suggested marketing mix solutions to all problems, and identified opportunities for growth.
Why Customers Buy | Conjoint Analysis: Unlocking the Secret to What Your Cu...Qualtrics
Conjoint analysis is the key to unlocking the value customers place on different feature of a given product, service, or experience. Join us as we explore five different types of conjoint analysis and discuss how you can use them to let your customers do the talking.
Modeling Online Hotel Choice: Conjoint analysis as a multivariate alternative...SKIM
How can researchers best investigate what drives online purchase decisions? Currently, A/B-tests of isolated features on two otherwise identical versions of a website are the gold standard for testing online purchase environments. Despite its simplicity, A/B-testing is tedious since only a single feature can be changed at a time and possible interactions between features are not accounted for.
In their presentation, Christine and Paulo examined whether conjoint analysis can be used as a multivariate alternative to A/B-testing. Choice-based conjoint is a powerful method to analyze purchase decisions as it allows for optimization across various attributes and levels. While in most conjoint applications attributes and levels pertain to the product itself, the method can also be applied to optimizing the user interface (where elements are placed, how they are designed and executed, the use of rankings, reviews, and promotions). With the application of choice-based conjoint, we can test which booking site features impact purchase decisions for hotel accommodation.
Find out more at www.skimgroup.com/gor-2015
Learn all about conjoint analysis in this guide by Survey Analytics. While we focus on choice-based conjoint because it is the most common, you can also learn about what it can be used for and how to conduct it in your research.
How to Start Leather Production, Processing & Tannery BusinessAjjay Kumar Gupta
Leather Industry has been one of the traditional industries operating at present. The hides and skins of animals are the source of leather and preserving hides and tanning them into leather has become an important industry. Leather-making is now a scientifically based industry, but still retains some of the charm and mystery of the original craft. Tanning is the final process in turning hides and skins into leather. Tanning involves a complex combination of mechanical and chemical processes.
See more
http://goo.gl/nfPBBP
http://goo.gl/qwZbf5
http://www.entrepreneurindia.co/
Tags
Book on Leather Technology, Booming Leather Industry, Business guidance on Leather Processing Industry, Business guidance on Leather Tanning Industry, Business Plan for a Startup Business, Business Plan of Leather Products, How to Start a Leather Business Startup Business, How to start a leather goods export business in India, How to start a leather manufacturing business, How to Start a Leather Production Business, How to Start a Leather tanning industry?, How to start a successful Leather business, How to start leather business in India, How to Start Leather Processing Industry in India, How to Start Leather Production, Processing & Tannery Business, Leather bag business plan, Leather Based Small Scale Industries Projects, Leather business Ideas, Leather Export Business Ideas, Leather Making Small Business Manufacturing, Leather manufacturing business plan, Leather Manufacturing Business, Leather processing and tanning technology with manufacturing, Leather processing business plan, Leather Processing Industry in India, Leather Processing Technology, Leather production business plan, Leather production processes, Leather production, Leather tannery business plan, Leather Tanning Based Profitable Projects, Leather Tanning Business, Leather Tanning Process Technical and processing, Leather technology books, Manufacture of antique leather, Manufacture of Box and Willow Sides, Manufacture of chamois leather, Manufacture of Chrome Picking Band and Lace Leather, Manufacture of Chrome Sole Leather, Manufacture of half tanned leather, Manufacture of harness, saddlery, belting and bag leather, Manufacture of japanned and enamelled leather, Manufacture of light and fancy leathers, Manufacture of upholstery leather, Manufacture of Vegetable Tanned Sole Leather, Most Profitable Leather Processing Business Ideas, New small scale ideas in Leather processing industry, Profitable Leather Business Ideas, Profitable Small Scale Leather Manufacturing, Setting up and opening your Leather Business, Setting up of Leather Processing Units, Small Scale Leather Processing Projects, Small scale Leather production line, Small Start-up Business Project, Start up India, Stand up India, Starting a Leather Processing Business, Start-up Business Plan for Leather tanning, Startup Project for Leather tanning Business, Tannery business plan
A Simple Tutorial on Conjoint and Cluster AnalysisIterative Path
A simple tutorial to show conjoint analysis and cluster analysis. please send your feedback, this version is still rough and I would like to iteratively improve it so it is useful for most.
HOW TO WRITE A PLAY REVIEW adapted from the New Ensemble TheatPazSilviapm
HOW TO WRITE A PLAY REVIEW
adapted from the New Ensemble Theatre
WRITE YOUR REVIEW IN ESSAY FORM,
NOT QUESTION AND ANSWER OR OUTLINE FORM!
Section 1: The Basics
Who? (The playwright, the theater company), What? (the title of the play),
Where? (the name of the theater or space in which it is playing), When? (what night did you see it, when is it running?)
Give a one phrase opinion on the production overall—enjoyable? Disappointing? Engaging? Confusing? Be creative with your adjectives.
Section 2: The Plot
Give a 1-2 sentence run down of the basic plot—but don’t give away too much!
Section 3: The Acting
Be sure to use their real names and character names when you mention specific people. Consider the following: Were they believable? How was their volume and articulation? Did their gestures and body movement convey the character well? Were their actions strong? Did they seem to have a strong sense of imagination and spontaneity? Who did you believe to be particularly good and why? Remember to tell me why.
Section 4: The Design
Mention the designers, if at all possible. Not all design items will apply to all shows.
The Set: Did it establish the clear mood, time period, or place for the play? What did it look like?
Costumes, Hair & Make Up: Did they seem to fit with the set? Were they well suited to the characters? What did changes in the costumes, hair and makeup say about the characters or the story as a whole? Remember to tell me how.
Sound: How did the sound effects and music contribute to the show's mood? Tell me how.
Consider other design elements: fight choreography, special effects?
Section 5: Directing, Style, and Language
Be sure to mention the director’s name.
Directing: Did all of the areas of the play seem to work together well? Why or why not? Were the actors’ movements on the stage clear? Did the world of the play seem complete? Was there anything truly missing that was needed? Was there too much in the play’s world making things confusing? Tell me why.
Style: period understanding and details; cohesiveness of style among the actors (do they all seem like they’re in the same play?);
Language: Was the story clear—even if you didn’t understand all of the language? Did you understand more or less of the language than you expected? Was the use of the language interesting, compelling to listen to?
Section 6: Intentions
What do you believe is the production’s main intention? To entertain us? To make us think about something? To make us feel something? What is it? How well does it achieve that goal? Overall, did you like it or dislike it? Give reasons for your opinion one way or the other.
Making the Case for Quality
Quality Revolution Reduces Defects,
Drives Sales Growth at 3M
• Forseveralyears,problems
withabrasivesbelts
toppedthelistofindustrial
abrasivescustomer
complaintsat3M.
• BycombiningLean
SixSigmaandaTop-
200customerfocus,
3Mimproveditsbelt
fabricationprocesses.
• Thebeltprojectledto
improvedqualityas
d ...
This text intends to introduce the reader to algorithmic, or automated design tools: survey their current uses in footwear, and speculate on how these transformative technologies will transcend being supplemental to the design process and will radically impact footwear, and broadly, product creation.
This research was compiled for my undergraduate Industrial + Interaction Design thesis project at the Syracuse University School of Design. Development of the concepts proposed in this text will continue over the spring of 2018.
Consumer behaviour towards action shoesRaj vardhan
CONTENTS
CHAPTER-1 : Introduction
1.1. Overview of the industry
1.2. Company Profile
1.3. Problems faced by the organization
1.4. Competitors Information
1.5. SWOT Analysis
CHAPTER-2: Research Methodology
2.1 Statement of problem
2.2 Objectives of the study
2.3 Research methodology
2.4 Limitations of the studies
Chapter 3: Conceptual Discussion
Chapter 4: Data Analysis and Interpretation
Chapter 5: Findings and recommendations
Chapter 6: Conclusion
Bibliography
Annexure
Questionnaire
A case study focusing on world’s two biggest names in the sports brands today - Nike and Adidas. Gives a good viewpoint to the marketing strategy of both.
Digital Transformation and IT Strategy Toolkit and TemplatesAurelien Domont, MBA
This Digital Transformation and IT Strategy Toolkit was created by ex-McKinsey, Deloitte and BCG Management Consultants, after more than 5,000 hours of work. It is considered the world's best & most comprehensive Digital Transformation and IT Strategy Toolkit. It includes all the Frameworks, Best Practices & Templates required to successfully undertake the Digital Transformation of your organization and define a robust IT Strategy.
Editable Toolkit to help you reuse our content: 700 Powerpoint slides | 35 Excel sheets | 84 minutes of Video training
This PowerPoint presentation is only a small preview of our Toolkits. For more details, visit www.domontconsulting.com
Top mailing list providers in the USA.pptxJeremyPeirce1
Discover the top mailing list providers in the USA, offering targeted lists, segmentation, and analytics to optimize your marketing campaigns and drive engagement.
Putting the SPARK into Virtual Training.pptxCynthia Clay
This 60-minute webinar, sponsored by Adobe, was delivered for the Training Mag Network. It explored the five elements of SPARK: Storytelling, Purpose, Action, Relationships, and Kudos. Knowing how to tell a well-structured story is key to building long-term memory. Stating a clear purpose that doesn't take away from the discovery learning process is critical. Ensuring that people move from theory to practical application is imperative. Creating strong social learning is the key to commitment and engagement. Validating and affirming participants' comments is the way to create a positive learning environment.
The world of search engine optimization (SEO) is buzzing with discussions after Google confirmed that around 2,500 leaked internal documents related to its Search feature are indeed authentic. The revelation has sparked significant concerns within the SEO community. The leaked documents were initially reported by SEO experts Rand Fishkin and Mike King, igniting widespread analysis and discourse. For More Info:- https://news.arihantwebtech.com/search-disrupted-googles-leaked-documents-rock-the-seo-world/
Building Your Employer Brand with Social MediaLuanWise
Presented at The Global HR Summit, 6th June 2024
In this keynote, Luan Wise will provide invaluable insights to elevate your employer brand on social media platforms including LinkedIn, Facebook, Instagram, X (formerly Twitter) and TikTok. You'll learn how compelling content can authentically showcase your company culture, values, and employee experiences to support your talent acquisition and retention objectives. Additionally, you'll understand the power of employee advocacy to amplify reach and engagement – helping to position your organization as an employer of choice in today's competitive talent landscape.
Event Report - SAP Sapphire 2024 Orlando - lots of innovation and old challengesHolger Mueller
Holger Mueller of Constellation Research shares his key takeaways from SAP's Sapphire confernece, held in Orlando, June 3rd till 5th 2024, in the Orange Convention Center.
Kseniya Leshchenko: Shared development support service model as the way to ma...Lviv Startup Club
Kseniya Leshchenko: Shared development support service model as the way to make small projects with small budgets profitable for the company (UA)
Kyiv PMDay 2024 Summer
Website – www.pmday.org
Youtube – https://www.youtube.com/startuplviv
FB – https://www.facebook.com/pmdayconference
3.0 Project 2_ Developing My Brand Identity Kit.pptxtanyjahb
A personal brand exploration presentation summarizes an individual's unique qualities and goals, covering strengths, values, passions, and target audience. It helps individuals understand what makes them stand out, their desired image, and how they aim to achieve it.
Understanding User Needs and Satisfying ThemAggregage
https://www.productmanagementtoday.com/frs/26903918/understanding-user-needs-and-satisfying-them
We know we want to create products which our customers find to be valuable. Whether we label it as customer-centric or product-led depends on how long we've been doing product management. There are three challenges we face when doing this. The obvious challenge is figuring out what our users need; the non-obvious challenges are in creating a shared understanding of those needs and in sensing if what we're doing is meeting those needs.
In this webinar, we won't focus on the research methods for discovering user-needs. We will focus on synthesis of the needs we discover, communication and alignment tools, and how we operationalize addressing those needs.
Industry expert Scott Sehlhorst will:
• Introduce a taxonomy for user goals with real world examples
• Present the Onion Diagram, a tool for contextualizing task-level goals
• Illustrate how customer journey maps capture activity-level and task-level goals
• Demonstrate the best approach to selection and prioritization of user-goals to address
• Highlight the crucial benchmarks, observable changes, in ensuring fulfillment of customer needs
Helen Lubchak: Тренди в управлінні проєктами та miltech (UA)
Conjoint ananlysis shoe industry
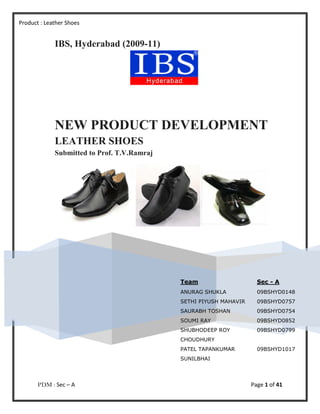
1. Product : Leather Shoes
IBS, Hyderabad (2009-11)
NEW PRODUCT DEVELOPMENT
LEATHER SHOES
Submitted to Prof. T.V.Ramraj
Team Sec - A
ANURAG SHUKLA 09BSHYD0148
SETHI PIYUSH MAHAVIR 09BSHYD0757
SAURABH TOSHAN 09BSHYD0754
SOUMI RAY 09BSHYD0852
SHUBHODEEP ROY 09BSHYD0799
CHOUDHURY
PATEL TAPANKUMAR 09BSHYD1017
SUNILBHAI
PDM : Sec – A Page 1 of 41
2. Product : Leather Shoes
INDIAN LEATHER FOOTWEAR INDUSTRY
The footwear industry is a significant segment in the leather industry in India. India
ranks second among the footwear producing countries next only to China.
This is a labor intensive industry and it is concentrated in the small and cottage
industries. While leather shoes and uppers are concentrated in large scale units, the
sandals and ‘chappals’ are produced in the household and cottage sectors. The leather
industry is the 8th largest earner of foreign exchange for the country and it employs
around 2.5 million people (mostly women).
Some facts and figures related to the Indian Footwear Industry:
• 2.06 billion pairs of footwear produces in a year.
• About 16% of the global production is produced in India.
• Major Foreign destination markets : U.S.A – 12%, EU countries – 63%, Hong
Kong – 10%, Australia – 1.5%, others – 13.5%.
• India has the best tanning expertise.
India has become the most favored destination for production of leather footwear. The
major production centers in India are Chennai, Ranipet, Ambur in Tamil Nadu, Mumbai
in Maharashtra, Kanpur in U.P, Jalandhar in Punjab, Agra and Delhi. Shoes marketed in
India wear brand names like Florsheim, Bata, Khadims, Action, Liberty, Woodland, Red
Tape, Red Chief, Lee Cooper, etc. As part of its effort to play a lead role in the global
trade, the Indian leather industry is focusing on key deliverables of innovative design,
consistently superior quality and unfailing delivery schedules. The availability of
abundant raw material base, large domestic market and the opportunity to cater to world
markets makes India an attractive destination for technology and investments.
The Indian footwear industry is provided with institutional infrastructure support through
premier institutions like Central Leather Research Institute, Chennai, Footwear Design
& Development Institute, Noida, National Institute of Fashion Technology, New Delhi,
etc in the areas of technological development, design and product development and
human resource development.
Export and Import of footwear from and to India constitute a significant share in the total
exports and imports in India. The different types of leather footwear exported from India
are dress shoes, casuals, moccasins, sport shoes, horrachies, sandals, ballerinas,
booties.
PDM : Sec – A Page 2 of 41
3. Product : Leather Shoes
This project has been undertaken to study NEW PRODUCT DEVELOPMENT in the
leather footwear market in India. This study considers various attributes and their
various levels like:
1) PRICE (Rs.) :
• 500
• 1000
• 1500
2) BRAND PREFERENCE :
• Branded
• Unbranded
• Indifferent
3) SHAPE :
• Flat nose
• Long nose
• Rounded nose
4) HEEL :
• Low
• Flat
• High
5) LACE :
• With lace
• Without lace
Since we proposed to launch the product for men, in two colors, viz. Black and Brown,
that attribute has not been taken into analysis; and respondents are men.
The complete project work is divided into two parts, viz. Conjoint Analysis and Multi
Dimensional Scale mapping.
PDM : Sec – A Page 3 of 41
5. Product : Leather Shoes
To begin with, we have run the Design.exe file which prompted us to enter the no. of
features. The no. of features in our analysis for Formal Leather shoes are 5, namely-
Price, Brand Preference, Shape, Heel and lace.
The features are now defined in Design Specifications with model type as Part Worth.
Apart from feature named Lace which is having 2 levels all other features have 3 levels
which are defined in the next screen.
16 cards were then selected to be generated by the software with n/T value to be 1.6
which is greater than 1.3 and hence an acceptable value.
PDM : Sec – A Page 5 of 41
6. Product : Leather Shoes
The levels of each attribute were then entered which are as shown-
The files were then saved twice as a card file and a design file. Duplicity for any card is
checked in the next step and no duplicate card was found at this stage hence there was
no need to change, replace or eliminate any card
The condition no. was then checked and found to be 2.13 which is within the acceptable
limit of 25.
PDM : Sec – A Page 6 of 41
7. Product : Leather Shoes
The correlation matrix is then analyzed which is shown as below-
In order to test the reliability and validity of our research we then proceeded to add 4
holdout cards to the existing 16 cards generated by the software. It was made sure that
these holdout cards do not dominate the cards generated by the design.
PDM : Sec – A Page 7 of 41
8. Product : Leather Shoes
Duplicity for any card is again checked in the next step and cards 5 and 18 were found
to be duplicate, hence one of the attribute of card 5 was altered to make sure that there
was no duplicity in the cards later.
The file is saved twice here in this stage as card and design file. The design file created
is further used in the study. The cards were then visually verified for their consistency in
their contents by displaying the cards under the display head.
PDM : Sec – A Page 8 of 41
9. Product : Leather Shoes
The Design stage was then exited, and we then proceeded to run the LINMAP.EXE.
Number of selection was chosen as 1 since we are going in for a new analysis.
Full profile conjoint was then selected to carry out further analysis.
PDM : Sec – A Page 9 of 41
11. Product : Leather Shoes
After the previous routine steps we then proceeded with the initial ordering of the
features as obtained via the software as shown under-
PDM : Sec – A Page 11 of 41
12. Product : Leather Shoes
Specification file was then created in the previous snapshot.
PDM : Sec – A Page 12 of 41
13. Product : Leather Shoes
After this we again went back to analyze the holdout data.
PDM : Sec – A Page 13 of 41
14. Product : Leather Shoes
The correlation between holdout data and the predicted scores is found to be 0.17
which is indeed very less than the acceptable value of 0.7; several attempts were made
to lower down the average percentage of pairs violated including addition of some more
respondents but this was the fair data which we managed to get without manipulations.
PDM : Sec – A Page 14 of 41
15. Product : Leather Shoes
Determining Group utility function was the next step in the analysis-
PDM : Sec – A Page 15 of 41
16. Product : Leather Shoes
The Group Statistics showed that the first preference for users was Price which was
rated as most important by 34.8% respondents then comes the preference for lace
which was important to 32.58% respondents. The other preferences are shown as
above.
We now proceed to determine the no. of respondents violating in our study, for this we
again go back to the initial screen and select option 4.
The threshold violations are then set to 20% in our study, and the distribution of number
of violations is then asked for by selecting option 2.
PDM : Sec – A Page 16 of 41
17. Product : Leather Shoes
The above screenshot shows the % of violations for the first respondent, and as can be
seen the respondent’s first preference is for the shape then brand followed by other
features. Likewise we obtained violations for each and every respondent and the
cumulative violations (exceeding the threshold of 20%) for the entire set are depicted in
the next screenshot.
PDM : Sec – A Page 17 of 41
18. Product : Leather Shoes
This shows that 27.3% of our respondents violated the threshold acceptance region of
20%.
PDM : Sec – A Page 18 of 41
19. Product : Leather Shoes
SEGMENT.EXE
Here we try to locate the segment where our product fits the best.
PDM : Sec – A Page 19 of 41
21. Product : Leather Shoes
From below, we can plot a graph of clusters.
60000
50000
40000
Axis Title
30000 Cluster
Distance
20000
10000
0
1 2 3 4 5 6 7 8 9 10 11 12 13 14 15 16 17
Probable cluster, we can target.
Above graph shows that we can form two clusters, based upon respondents’ responses.
Below is a group utility function, which shows % importance of each attribute of our
product. It is evident from below table that “PRICE” and “LACE” are the most prominent
attributes to be taken care in designing the product (SHOE).
PDM : Sec – A Page 21 of 41
22. Product : Leather Shoes
PRICE 1000 500 1500
REL. IMP. = 34.8% -5.735 0.467 5.268
NON-
BRAND PREFERENCE INDIFFERENT BRANDED
BRANDED
REL. IMP. = 8.57% 1.267 -1.444 0.177
ROUNDED
SHAPE LONG NOSE FLAT NOSE
NOSE
REL. IMP. = 4.12% 0.566 0.171 -0.737
HEEL FLAT HIGH LOW
REL. IMP. = 19.92% 2.635 -3.663 1.027
WITHOUT •
LACE WITH LACE
LACE
REL. IMP. = 32.58% 5.149 -5.149
PDM : Sec – A Page 22 of 41
23. Product : Leather Shoes
PRICE
6
4
2
REL. IMPORTANCE
0
500 1000 1500
-2
-4
-6
-8
PRICE
Here we can see that utility decreased as price increased from Rs. 500 to Rs. 1,000.
But thereafter it shows that utility increased as price increases beyond Rs. 1,000. So,
charging high prices, i.e. beyond 1000 we can not only increase customer utility, but can
also fetch more profits. This gives us room to enter into a segment where
consumers are ready to pay premium prices.
BRAND PREFERENCE
1.5
1
REL. IMPORTANCE
0.5
0
-0.5 NON-BRANDED INDIFFERENT BRANDED
-1
-1.5
-2
Most of the respondents are indifferent to brand.
PDM : Sec – A Page 23 of 41
24. Product : Leather Shoes
SHAPE OF NOSE
0.8
0.6
REL. IMPORTANCE 0.4
0.2
0
-0.2 FLAT NOSE ROUNDED NOSE LONG NOSE
-0.4
-0.6
-0.8
-1
Above graph shows lowest utility for ROUNDED NOSE and highest utility for
LONG NOSE. This is an indication of how fashion conscious, respondents are.
HEEL HEIGHT
3
REL. IMPORTANCE
2
1
0
FLAT LOW HIGH
-1
-2
-3
-4
Above shows FLAT HEELS are preferred by most of the respondents.
PDM : Sec – A Page 24 of 41
25. Product : Leather Shoes
SHOE LACE
6
REL. IMPORTANC 4
2
0
WITHOUT LACE WITH LACE
-2
-4
-6
Above graph shows respondents are more inclined to have a pair of shoes WITH LACE.
Here our analysis shows that the complete respondent group can is divided into two
clusters. Group #1 is more focused on LACE, HEEL and PRICE, whereas Group #2 is
more concerned about SHAPE and HEEL.
PDM : Sec – A Page 25 of 41
27. Product : Leather Shoes
SIMULATION.EXE
Here we simulate a market scenario. We take product features of competitors and map
their market share. Then we add our product and check that how successfully our
product fetches market share of the existing competitors.
Simulation file : SHOE-A.SIM is created.
It asks no. of product we wish to simulate. Here we have taken 2 probable competitors’
product features.
PDM : Sec – A Page 27 of 41
28. Product : Leather Shoes
Entre features of product #1.
Entre features of product #2.
Following shows market share of both the products (LEATHER SHOES) in the existing
market (based upon the responses we have collected, it simulates customer
preferences and calculates % of people who will buy which of these 2 products, of
competitors)
PDM : Sec – A Page 28 of 41
29. Product : Leather Shoes
Followings are the features of our product we intend to launch, against above 2
products of the competitor. (Here product #1 shows our launched product, which we
intend to compare with that of our competitors’.) Here based upon the segment criteria,
we derived earlier, we have taken values/information accordingly. Here we have banked
upon two main criteria, i.e. PRICE, SHAPE and LACE.
Following shows respective market shares of the products. Here please note that
product #1 and product #2 are competitors’ products, and product #3 is our
prospective launching. We can see that market share of product #1 has been
reduced from 48.468% to 24.24% and that of product #2 has been reduced from
51.52% to 21.21%. This is due to introduction of our new product in the market.
From above, we can infer that our product has very high prospects of being
popular and stands high adoptability from customers.
PDM : Sec – A Page 29 of 41
30. Product : Leather Shoes
So, here we can conclude that the product we proposed will be successful in the
market, which will have following attributes:
• Price : Rs. 1500
• Branded
• Long Nose
• High Heel
• With Lace
PDM : Sec – A Page 30 of 41
31. Product : Leather Shoes
Multi Dimensional
Scale Analysis
PDM : Sec – A Page 31 of 41
32. Product : Leather Shoes
POSITIONING USING MDS
Selection of the brands
The number of brands included in our study of the footwear market is 4. The brands
taken into consideration fulfill almost all possible attributes a footwear customer looks
for. The brands represent both the high end market for foot-wears as well as the lower
end of the market. This gives an overall view of the market in accordance to price,
comfort, durability and many other factors discussed later. The four brands taken into
consideration are:
• BATA
• KHADIM
• WOODLAND
• FLOROSCHEIM
The idea behind the selection of these brands is also because these brands are the
major players in the footwear industry. BATA originally an international brand but
because of its strong presence in the Indian market is often mistaken by the consumers
as an Indian brand. KHADIM is an Indian brand while WOODLAND and
FLOROSCHEIM both are international brands but with a strong presence in the Indian
market. So therefore by these selections we have tried to compare with two Indian and
two International brands.
We conducted a preliminary study where we asked the respondents to name few
footwear brands and then looking at the no of frequencies of each brands i.e. how many
times they were recalled by the respondents we zeroed into these four brands. The
other brands which were discussed about were:
• LIBERTY
• ACTION
• LEE COOPER
• RED TAPE
Going by the frequency of brand recall we thus decided to take into consideration the
first four brands.
PDM : Sec – A Page 32 of 41
33. Product : Leather Shoes
Selection of Attributes related to the brands
The selection of the attributes was done after we conducted focus group study. The
focus group studies were conducted in order to understand which are the attributes a
consumer relates to a particular brand or what are the attributes a consumer looks for
while purchasing a foot-wear. After two focus group studies the attributes which came
up for the brands are:
Affordability
Flexibility
Durability
Quality
Stylish
Comfortable
Firm Grip
The attributes are explained in brief below
Affordability: a consumer before a purchase considers the price of the product and this
attribute is one of the important elements of a purchase decision.
Flexibility: By flexibility the consumer looks how flexible the shoe is in terms of running,
walking or trekking.
Durability: The consumer looks for how durable the product is i.e. how long the product
will last.
Quality: The quality in terms of everything matters a lot to the consumer because that’s
what decides the value for money.
Stylish: The style of a shoe is another important element of footwear especially in the
case of formal and sports shoes.
Comfortable: The footwear if isn’t comfortable then no other attributes matter
Firm-Grip: The sole of the footwear needs to have a firm-grip so as to support and
maintain balance.
Process of the study using MDS
The process of the study can be broadly divided into four stages namely
1. Preparing the questionnaire
2. Filling up of the questionnaire
3. Data entry into EXCEL and SPSS
4. Analyzing the results and data interpretation
PDM : Sec – A Page 33 of 41
34. Product : Leather Shoes
Preparing the questionnaire
The questionnaire was prepared after the focus group studies where the aim was to
zero in the brands of the competitors following which to derive at the attributes a
consumer looks for. The questionnaire prepared is attached at the end of the report.
The questionnaire was divided into two parts. The first part required the respondents to
rate the brands on the basis of the attributes on a likert scale. A specimen question is
provided below
Q. Rate the brand BATA on the basis of the following attributes where 1 refers to
closest and 10 refers to the farthest to that attribute
Affordability 1 2 3 4 5 6 7 8 9 10
Durability 1 2 3 4 5 6 7 8 9 10
Flexibility 1 2 3 4 5 6 7 8 9 10
Comfort 1 2 3 4 5 6 7 8 9 10
Style 1 2 3 4 5 6 7 8 9 10
Quality 1 2 3 4 5 6 7 8 9
10
Firm Grip 1 2 3 4 5 6 7 8 9 10
The second part required the respondents to compare two attributes and also two
brands. A specimen question is given below
Q. Rate the following pairs on a scale of 1-10 where I refer to absolute closeness and
10 refer to absolute dissimilarity.
Affordable/ Durable 1 2 3 4 5 6 7 8 9 10
Durable/Quality 1 2 3 4 5 6 7 8 9 10
Filling up the questionnaire
A survey was then conducted with a sample size of 50 respondents in the campus with
25 males and 25 females.
Data entry into EXCEL and SPSS
After the questionnaires were filled the data was entered into EXCEL and SPSS for
analysis. The respondents rating were averaged and then entered. In some places the
average would arrive in decimals wherein we took the nearest decimal. The data was
entered into a form of a matrix shown below
PDM : Sec – A Page 34 of 41
35. Product : Leather Shoes
In the matrix above the comparison between one attribute to itself is shown by 1.
Analyzing the data in SPSS
The data entered was then imported to SPSS for further analysis.
The SPSS analysis is explained in detail in the next section
SPSS analysis using Multidimensional Scaling
Once the data has been entered in SPSS the next step was to analyze the data using
Multidimensional Scaling. The whole process has been explained step-wise
1. Select ANALYZE tab and then select SCALE and select Multidimensional Scaling
PDM : Sec – A Page 35 of 41
36. Product : Leather Shoes
2. On the selection of MDS from SCALE tab the output viewer opens up
PDM : Sec – A Page 36 of 41
38. Product : Leather Shoes
Analysis of the Multidimensional Scaling Model
Object Points
In the above chart the points of the brands represents the positioning of the brands in
the market and their closeness to the attributes as in how close are they to the attribute.
It is evident from the chart that KHADIM is considered both “durable” and “affordable”
because of its proximity towards both the attributes. While BATA is more of “affordable”
and somewhat “flexible”. The international brands WOODLAND and FLOROCHEIM are
in a different position in the market. WOODLAND is considered “comfortable” and
“flexible”. While FLOROCHEIM can be attributed to “quality” because of its proximity to
the point.
Positioning of our brand in the market
Looking at the chart above the positioning of our brand would be done at the space
above because that refers to the area which is not covered by any brand in the market.
The area is viewed below in the chart.
PDM : Sec – A Page 38 of 41
39. Product : Leather Shoes
The positioning of our brand will be done in the area near to “style” “durability” and
“quality”. This space in the market is uncovered by any other brands and this would be
the ideal space to capture in the foot-wear market.
Positioning Theme of our Brand
QUESTIONNAIRE
PART 1
Q. Rate the brand BATA on the basis of the following attributes where 1 refers to
closest and 10 refers to the farthest to that attribute
Affordability 1 2 3 4 5 6 7 8 9 10
Durability 1 2 3 4 5 6 7 8 9 10
Flexibility 1 2 3 4 5 6 7 8 9 10
Comfort 1 2 3 4 5 6 7 8 9 10
Style 1 2 3 4 5 6 7 8 9 10
Quality 1 2 3 4 5 6 7 8 9 10
PDM : Sec – A Page 39 of 41
40. Product : Leather Shoes
Firm Grip 1 2 3 4 5 6 7 8 9 10
Q. Rate the brand KHADIM on the basis of the following attributes where 1 refers to
closest and 10 refers to the farthest to that attribute
Affordability 1 2 3 4 5 6 7 8 9 10
Durability 1 2 3 4 5 6 7 8 9 10
Flexibility 1 2 3 4 5 6 7 8 9 10
Comfort 1 2 3 4 5 6 7 8 9 10
Style 1 2 3 4 5 6 7 8 9 10
Quality 1 2 3 4 5 6 7 8 9 10
Firm Grip 1 2 3 4 5 6 7 8 9 10
Q. Rate the brand WOODLAND on the basis of the following attributes where 1 refers to
closest and 10 refers to the farthest to that attribute
Affordability 1 2 3 4 5 6 7 8 9 10
Durability 1 2 3 4 5 6 7 8 9 10
Flexibility 1 2 3 4 5 6 7 8 9 10
Comfort 1 2 3 4 5 6 7 8 9 10
Style 1 2 3 4 5 6 7 8 9 10
Quality 1 2 3 4 5 6 7 8 9 10
Firm Grip 1 2 3 4 5 6 7 8 9 10
Q. Rate the brand FLOROCHEIM on the basis of the following attributes where 1 refers
to closest and 10 refers to the farthest to that attribute
Affordability 1 2 3 4 5 6 7 8 9 10
Durability 1 2 3 4 5 6 7 8 9 10
Flexibility 1 2 3 4 5 6 7 8 9 10
Comfort 1 2 3 4 5 6 7 8 9 10
Style 1 2 3 4 5 6 7 8 9 10
Quality 1 2 3 4 5 6 7 8 9 10
Firm Grip 1 2 3 4 5 6 7 8 9 10
PART 2
Q. Fill in the table comparing two attributes with each other and with Brands on a scale
of 1-10 where 1 refers to absolute similarity and 10 refers to absolute dissimilarity.
Aff Flex Dur Qlty Styl Com Firm Bata Wdld Flor Khad
Affordable 1
Flexibility 1
Durable 1
PDM : Sec – A Page 40 of 41
41. Product : Leather Shoes
Quality 1
Stylish 1
Comfortable 1
Firm-grip 1
BATA 1
WOODLAND 1
FLOROSCHEIM 1
KHADIM 1
If we combine both of our analysis – Conjoint Analysis and MDS Analysis – we
conclude the following attributes that should be featured in our prospective product:
• Price : Rs. 1500
• Branded
• Long nose & High Heel – with some fashionable features
• Durable
• Quality
• With Lace
PDM : Sec – A Page 41 of 41