Download as PDF, PPTX
![Related Work
Distance Based Classification Methods
Ding et al. [VLDB] (2008)1
For large datasets, the accuracy of elastic measures (DTW, LCSS,
EDR, ERP, etc.) converges with Euclidean distance (ED)
For small datasets, elastic measures can be significantly more accurate
than ED and other lock step measures
The efficiency of a similarity measure depends critically on the size of
the dataset
Keogh and Kassetty [SIGKDD] (2002)2
One nearest neighbour with Euclidean distance (1NN-ED) is very
difficult to beat
Novel similarity measures should be compared to simple strawmen,
such as Euclidian distance or Dynamic Time Warping.
1
H. Ding, G. Trajcevski, P. Scheuermann, X. Wang, and E. Keogh, Querying and mining of time series data: experimental
comparison of representations and distance measure, VLDB, 2008
2
E. Keogh and S. Kasetty, On the need for time series data mining benchmarks: A survey and empirical demonstration.
8th ACM SIGKDD, 2002
Dohare, Susheela Devi (IISc, India) Time Series Classification IEEE CEC, 2011 6 / 24](https://image.slidesharecdn.com/confpresent-120327013817-phpapp01/75/Combination-of-similarity-measures-for-time-series-classification-using-genetics-algorithms-6-2048.jpg)
![Related Work
Xi et al. [ICML] (2006)3
DTW is more accurate than ED for small datasets
Use numerical reduction to speed up DTW computation
Lee et al. [SIGMOD] (2007)4
The edit distance based similarity measures (LCSS, EDR, ERP) capture
the global similarity between two sequences, but not there local
similarity during a short time interval
3
Xiaopeng Xi, Eamonn Keogh, Christian Shelton, Li Wei and Chotirat Ann Ratanamahatana. Fast time series classification
using numerosity reduction. In ICML06, pages 1033-1040, 2006.
4
Jae-Gil Lee, Jiawei Han, and Kyu-Young Whang. Trajectory clustering: a partition-and-group framework. In Proceedings
of the 2007 ACM SIGMOD international conference on Management of data, SIGMOD 07, pages 593-604, New York, USA,
2007. ACM.
Dohare, Susheela Devi (IISc, India) Time Series Classification IEEE CEC, 2011 7 / 24](https://image.slidesharecdn.com/confpresent-120327013817-phpapp01/75/Combination-of-similarity-measures-for-time-series-classification-using-genetics-algorithms-7-2048.jpg)
![Methodology Genetic Algorithms
Our Approach
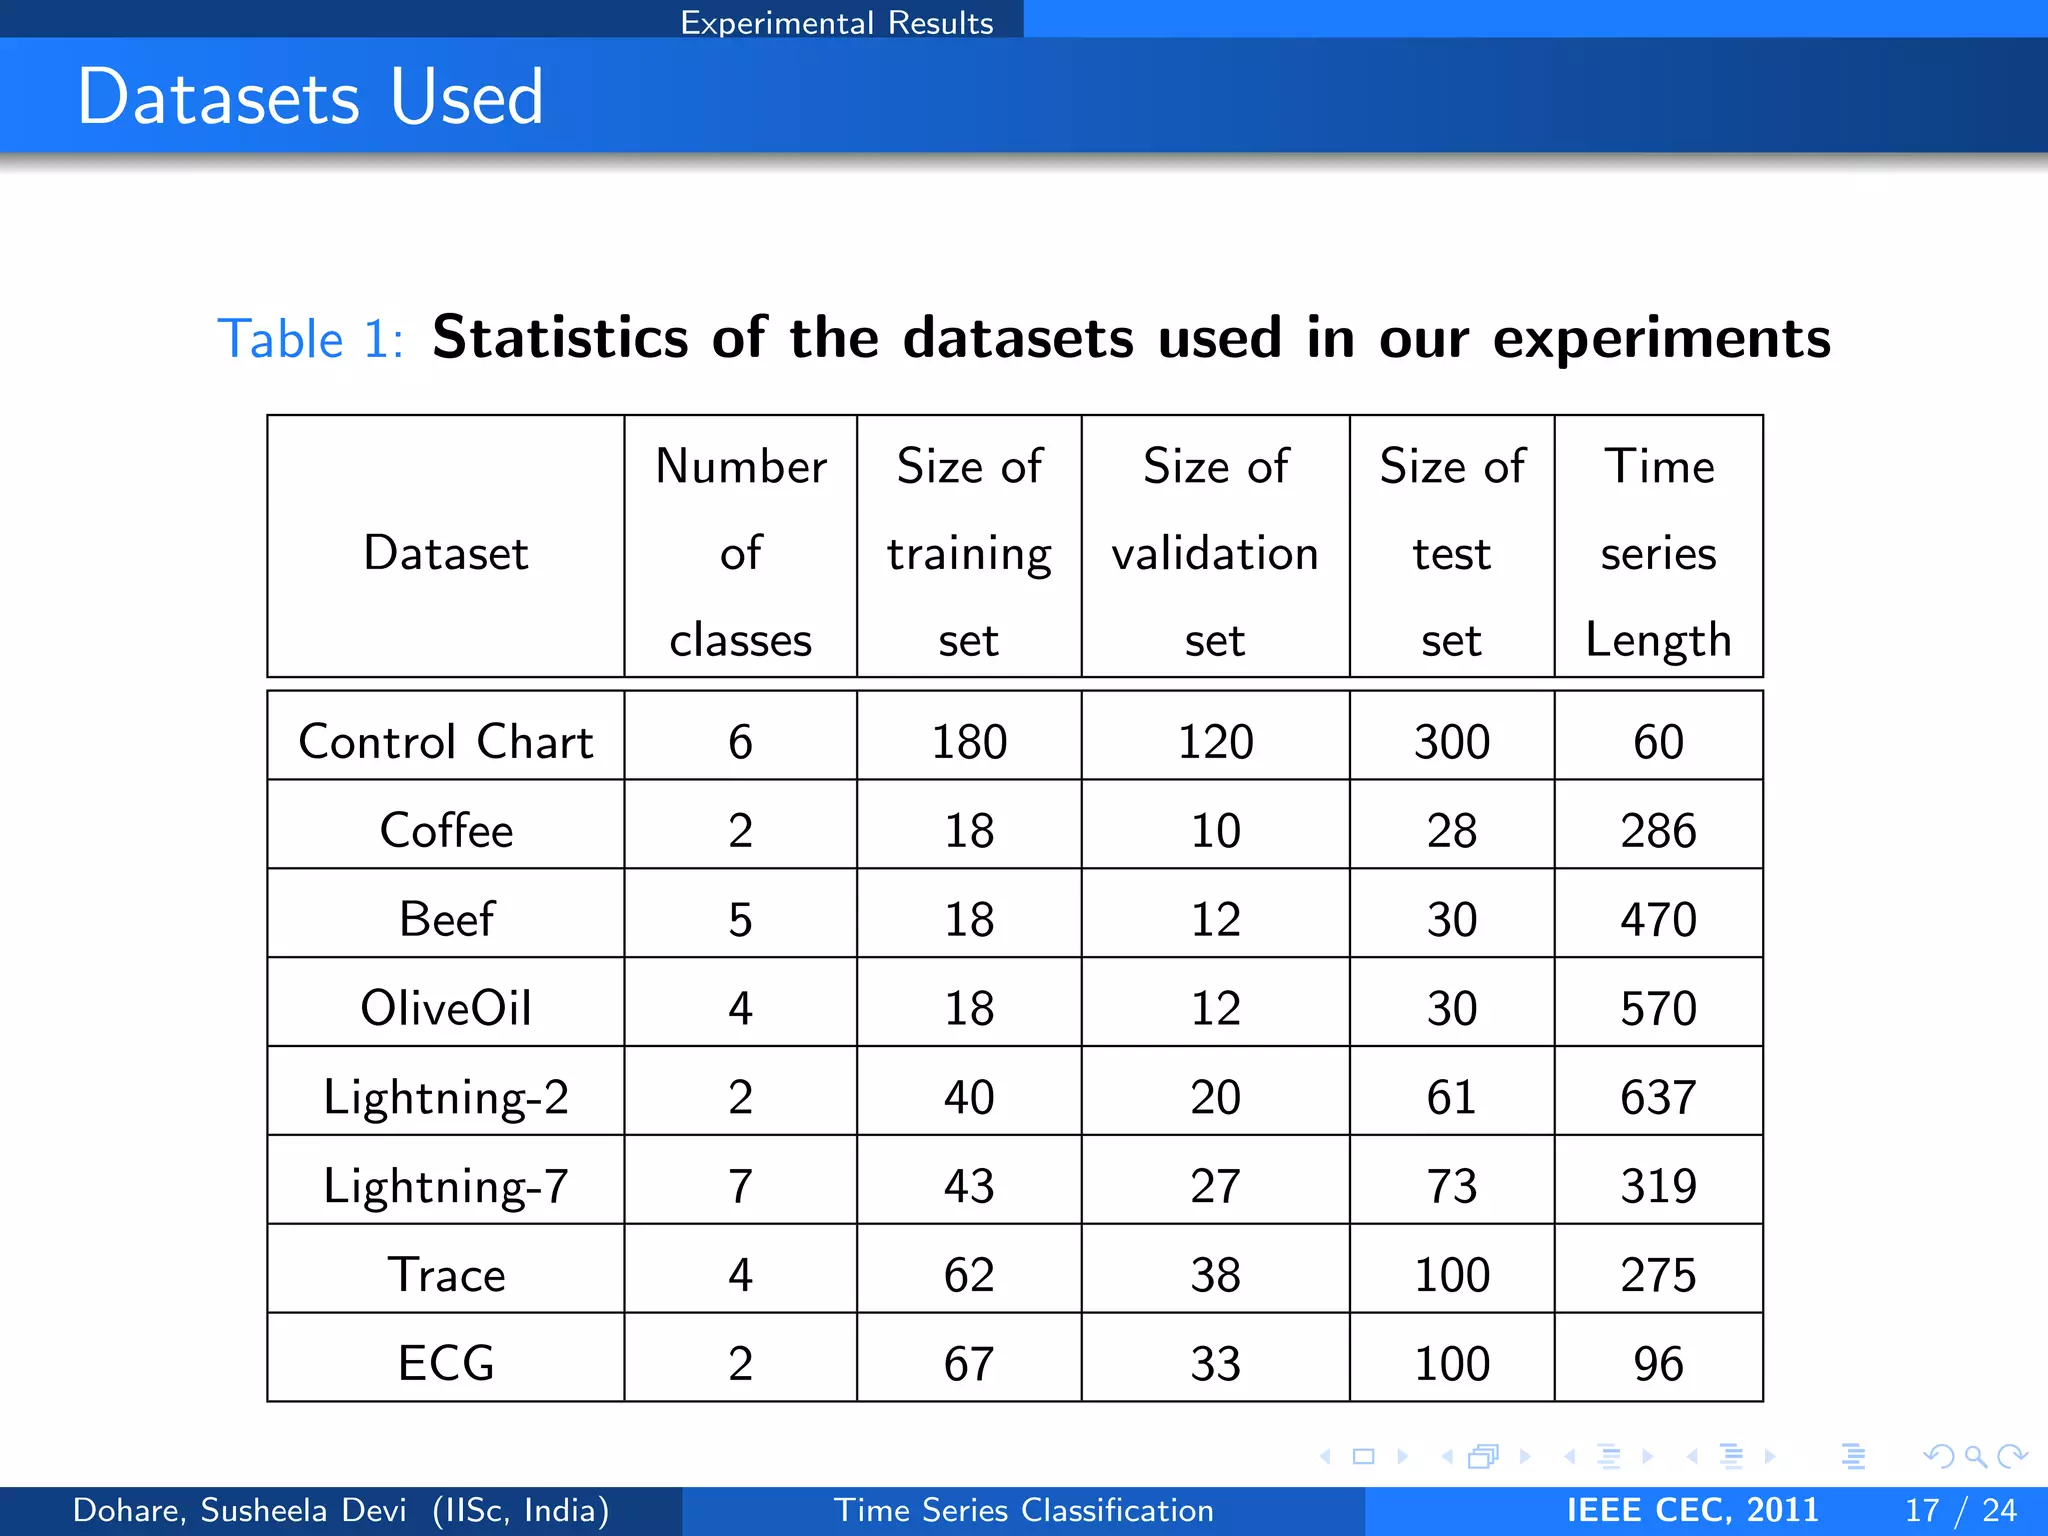
Divide the original training set into two sets: the training set and the
validation set
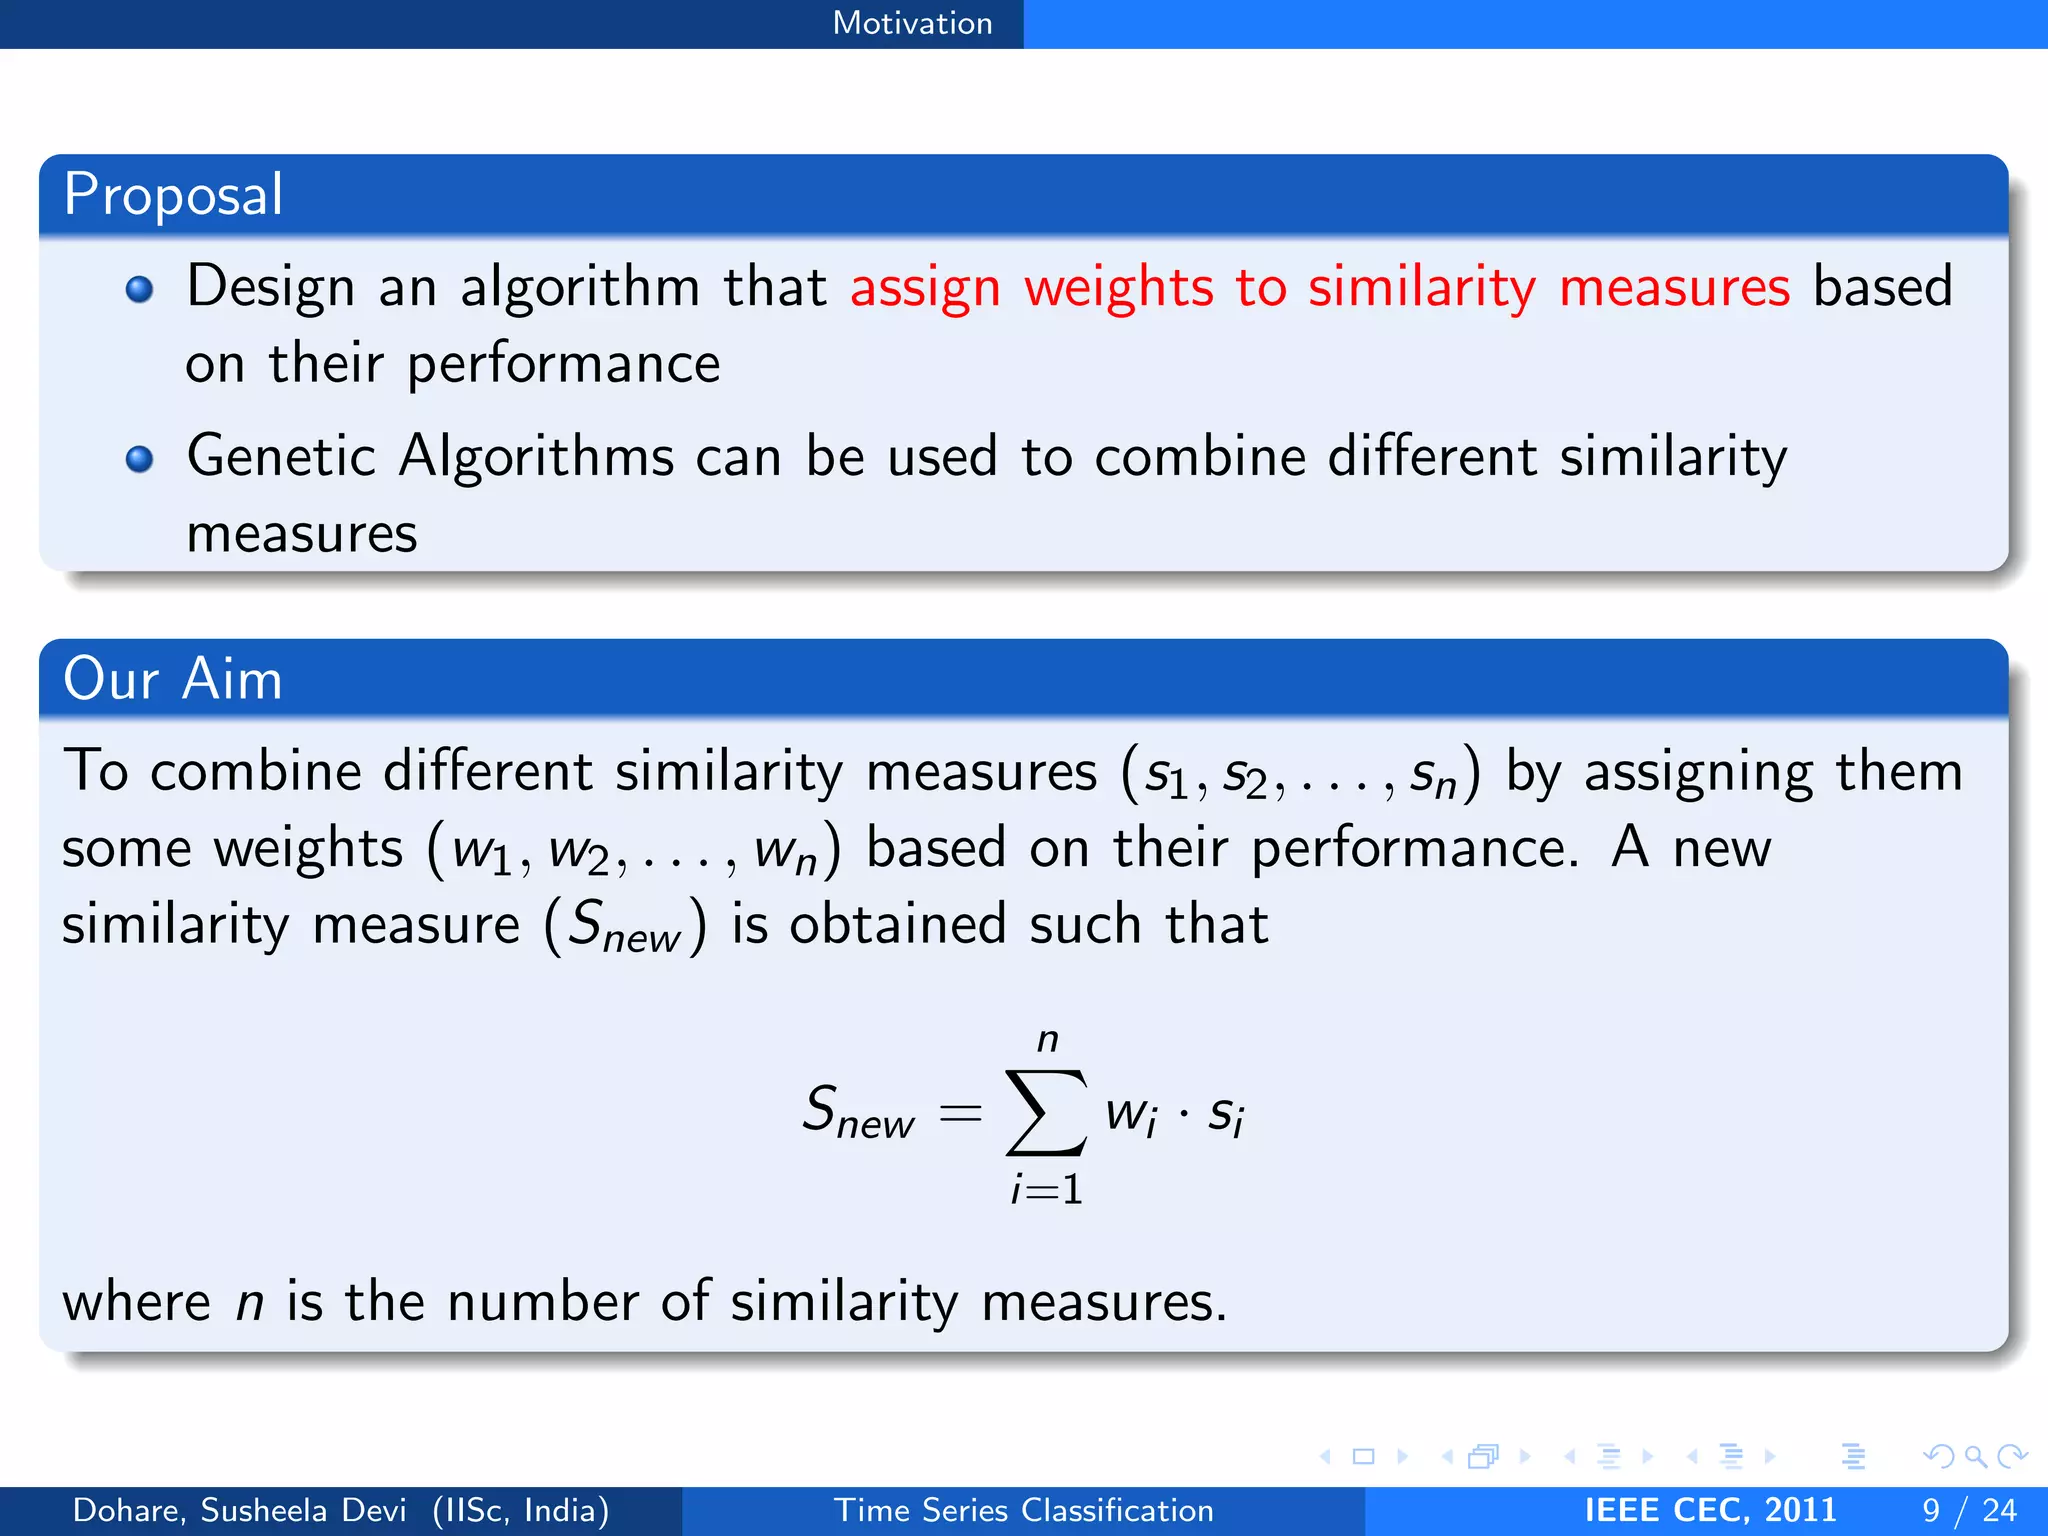
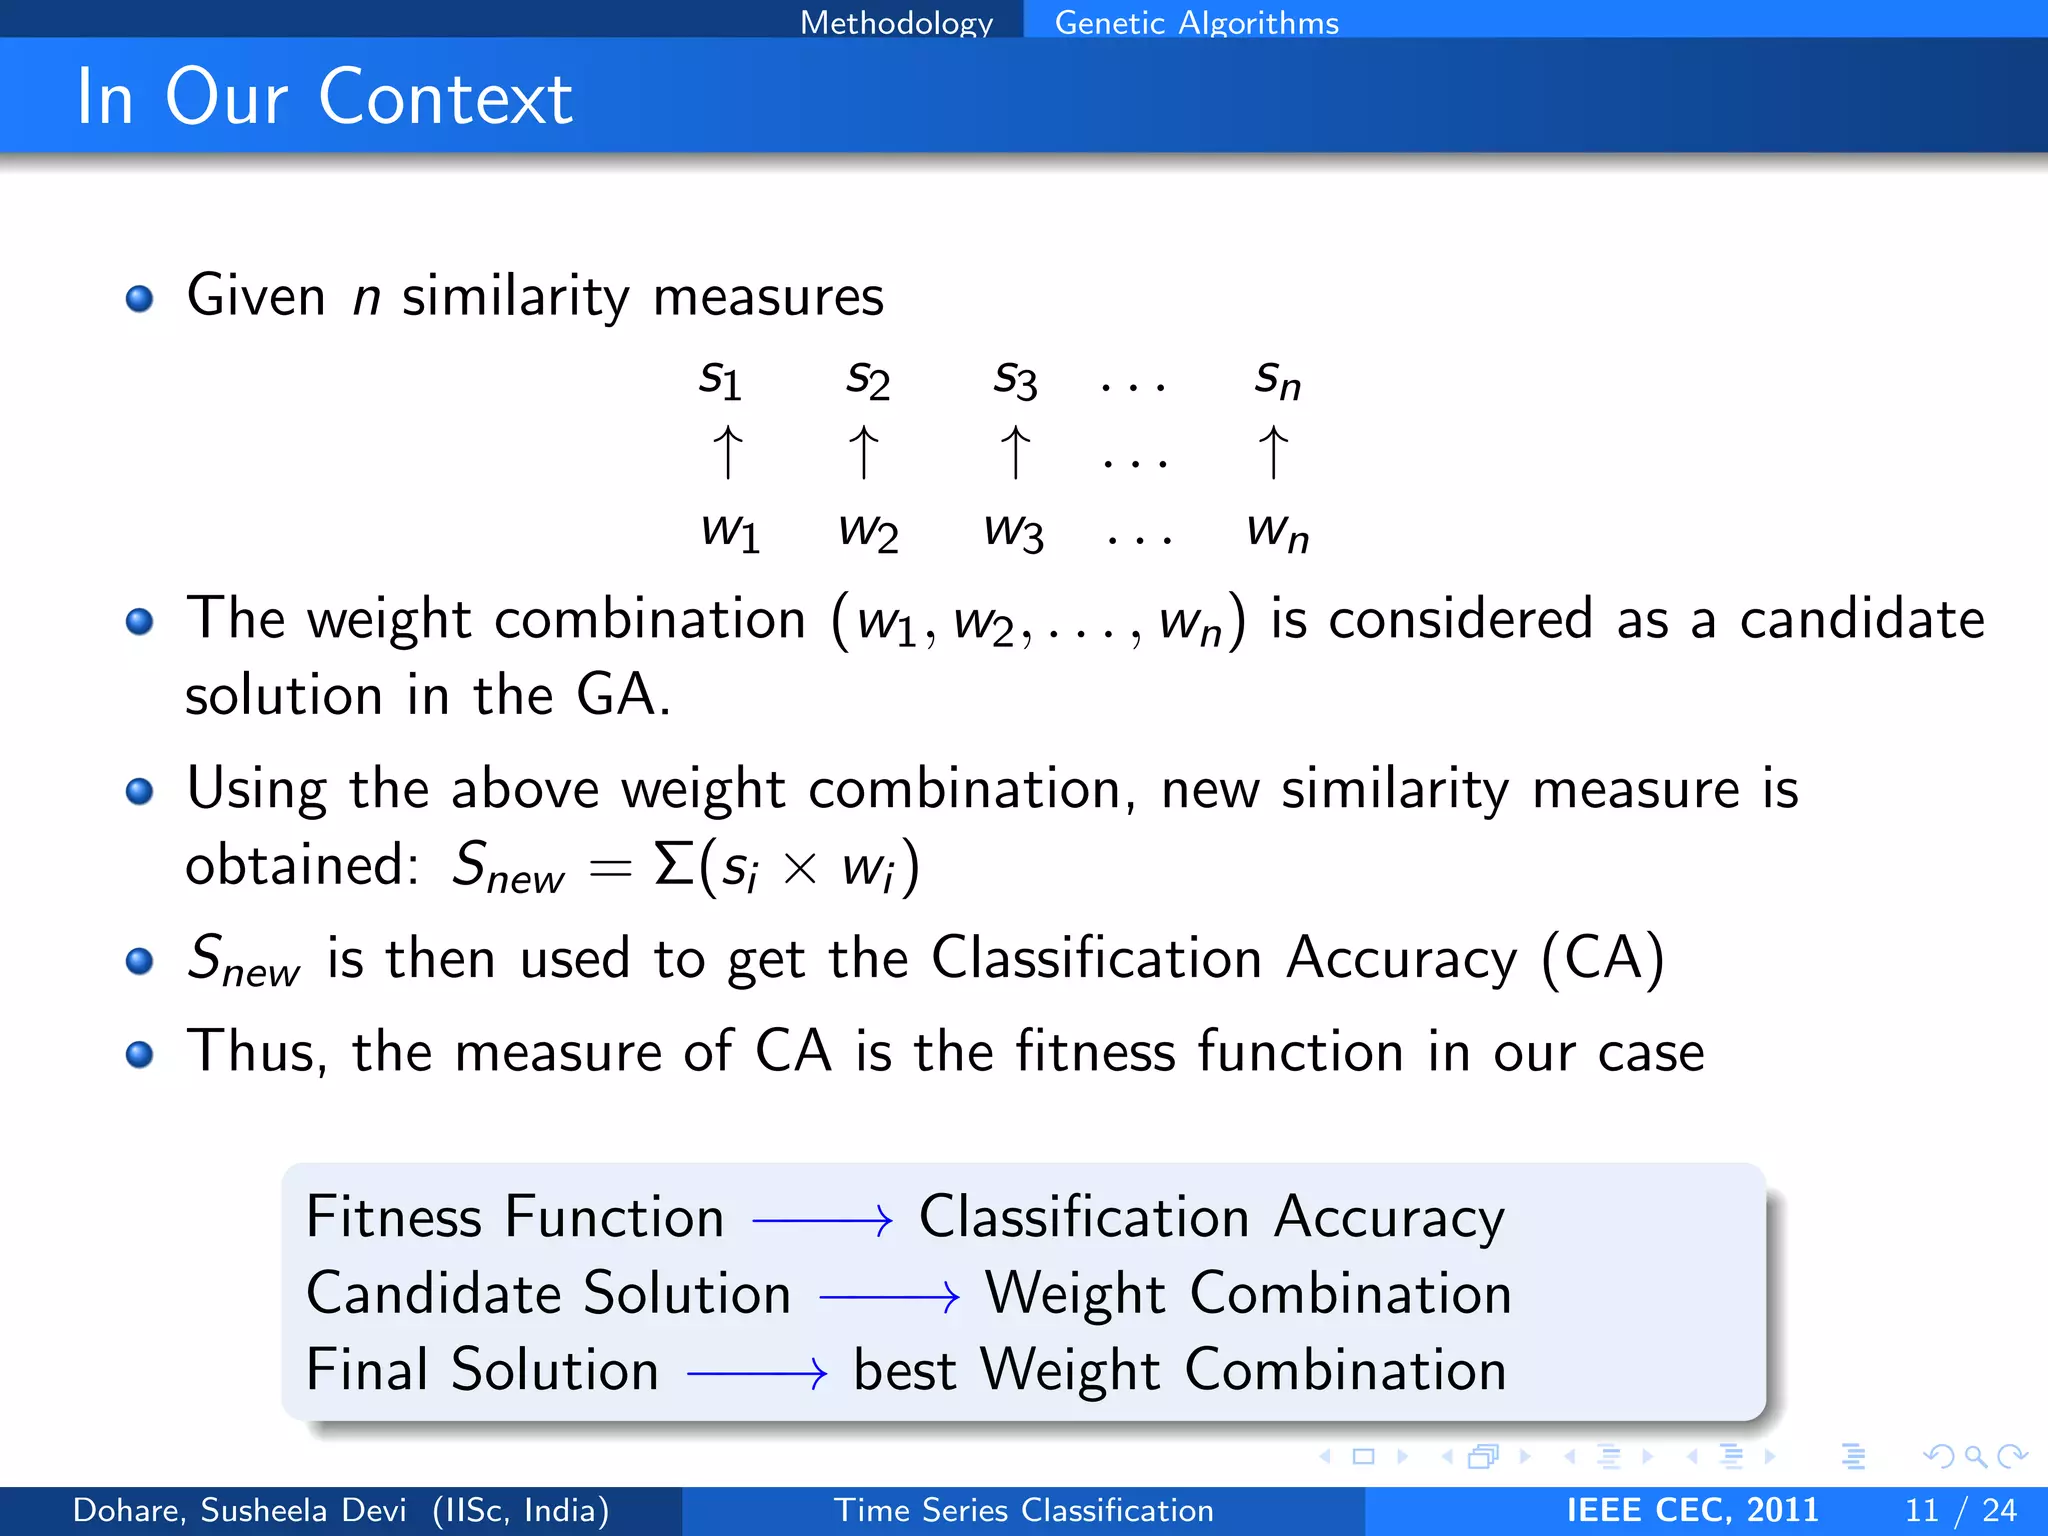
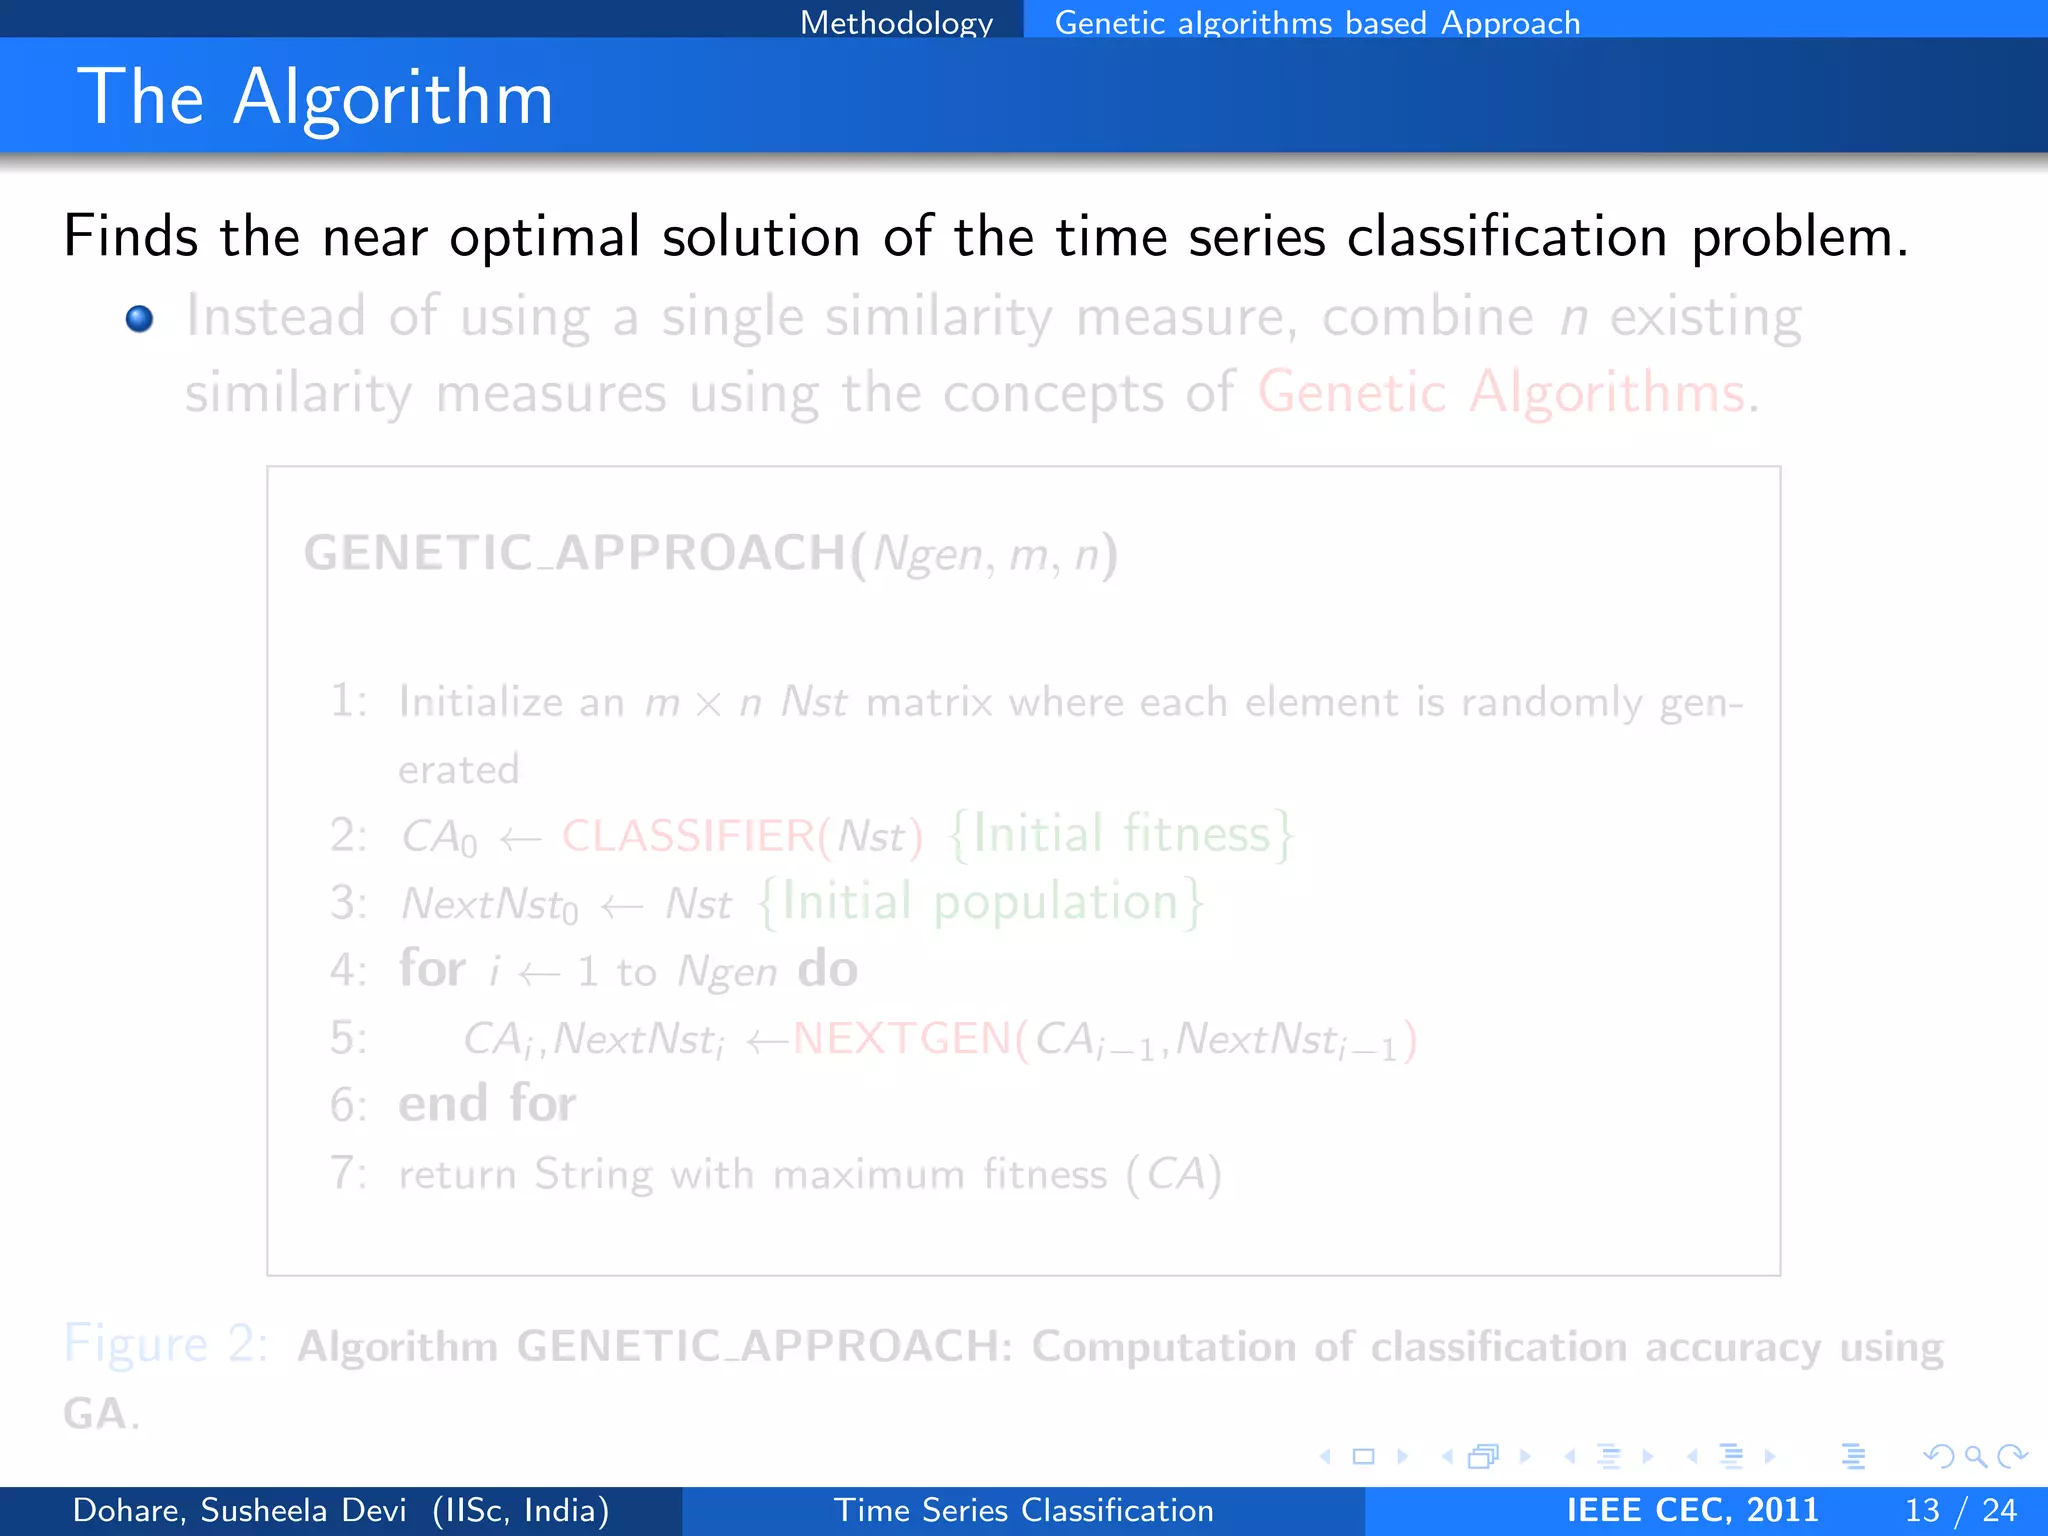
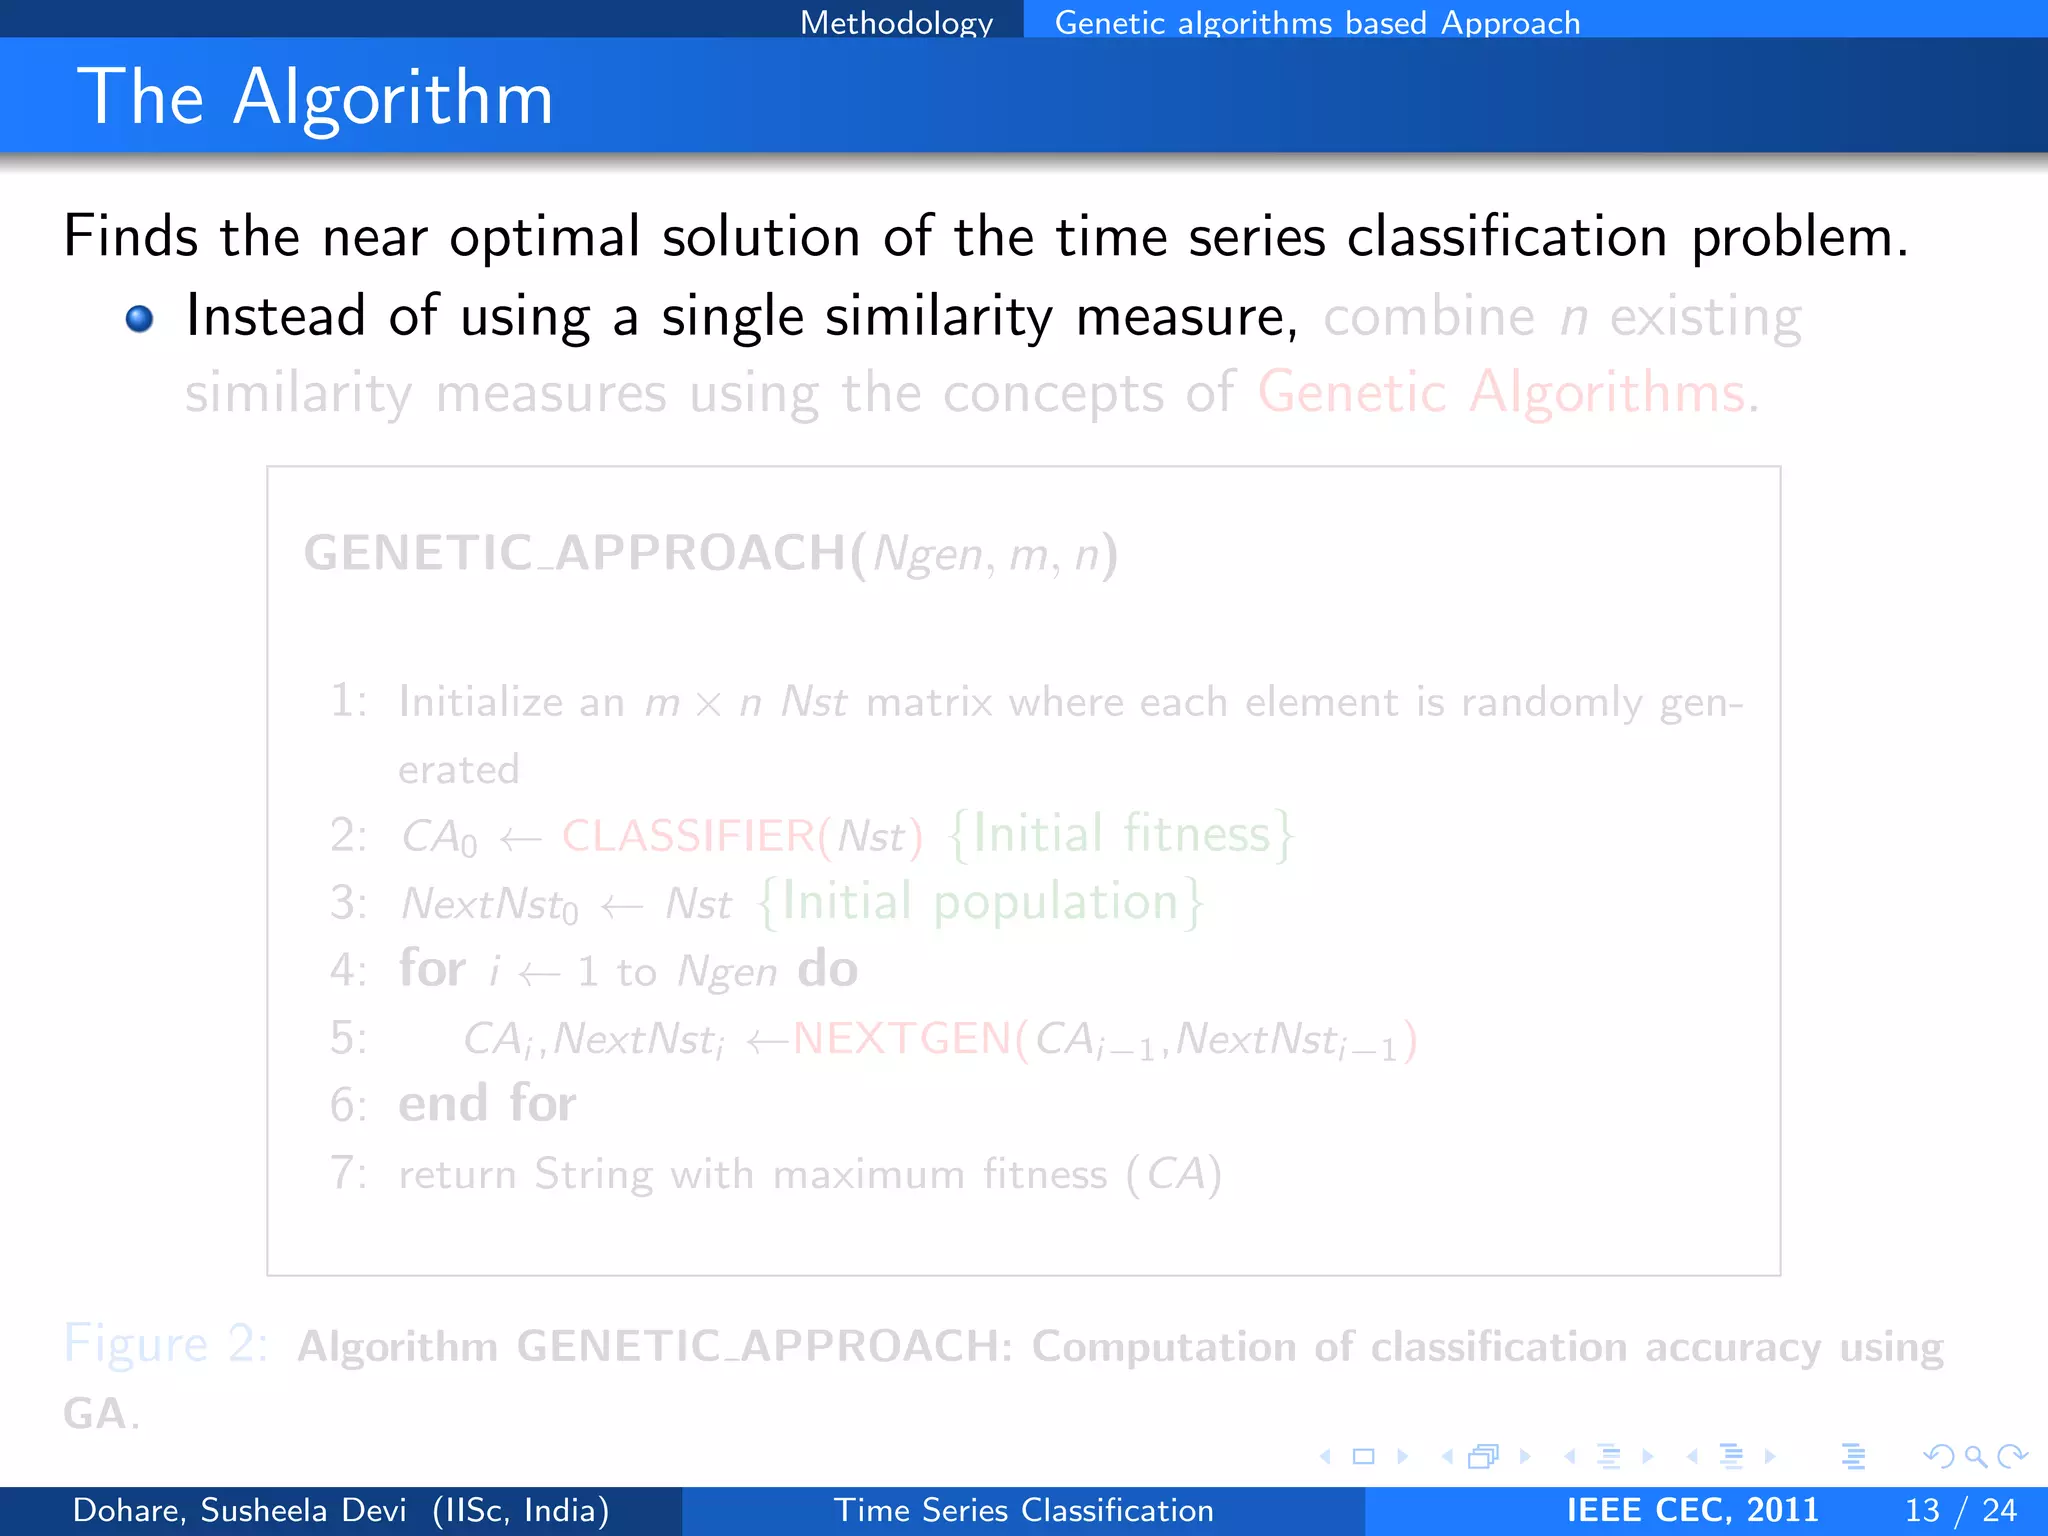
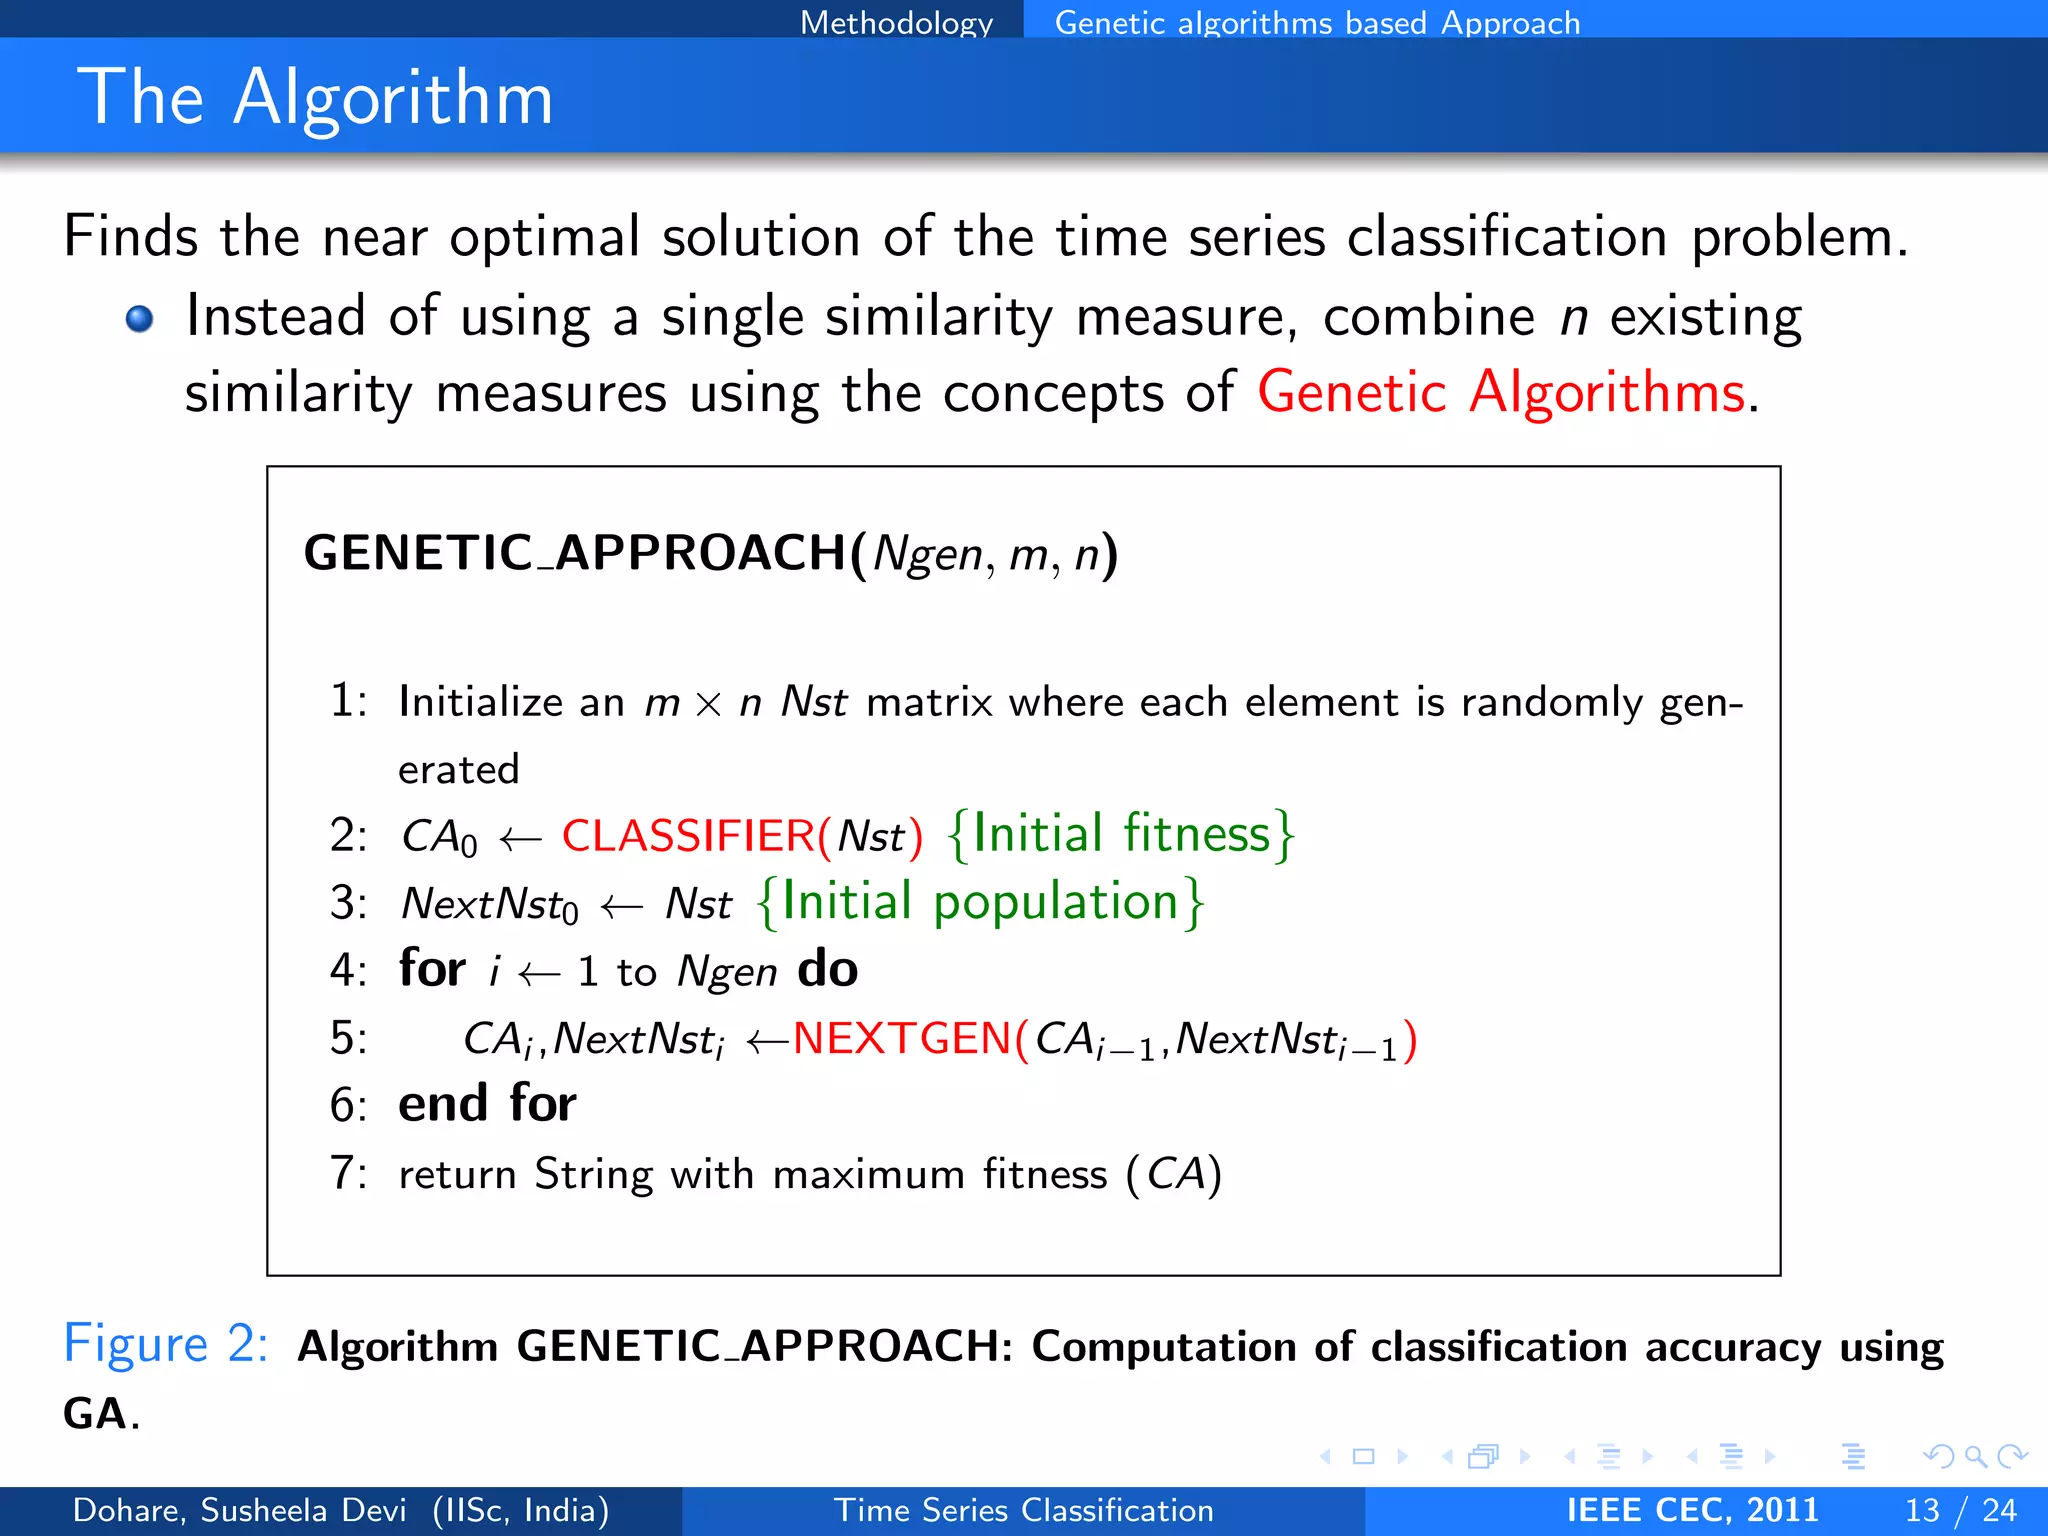
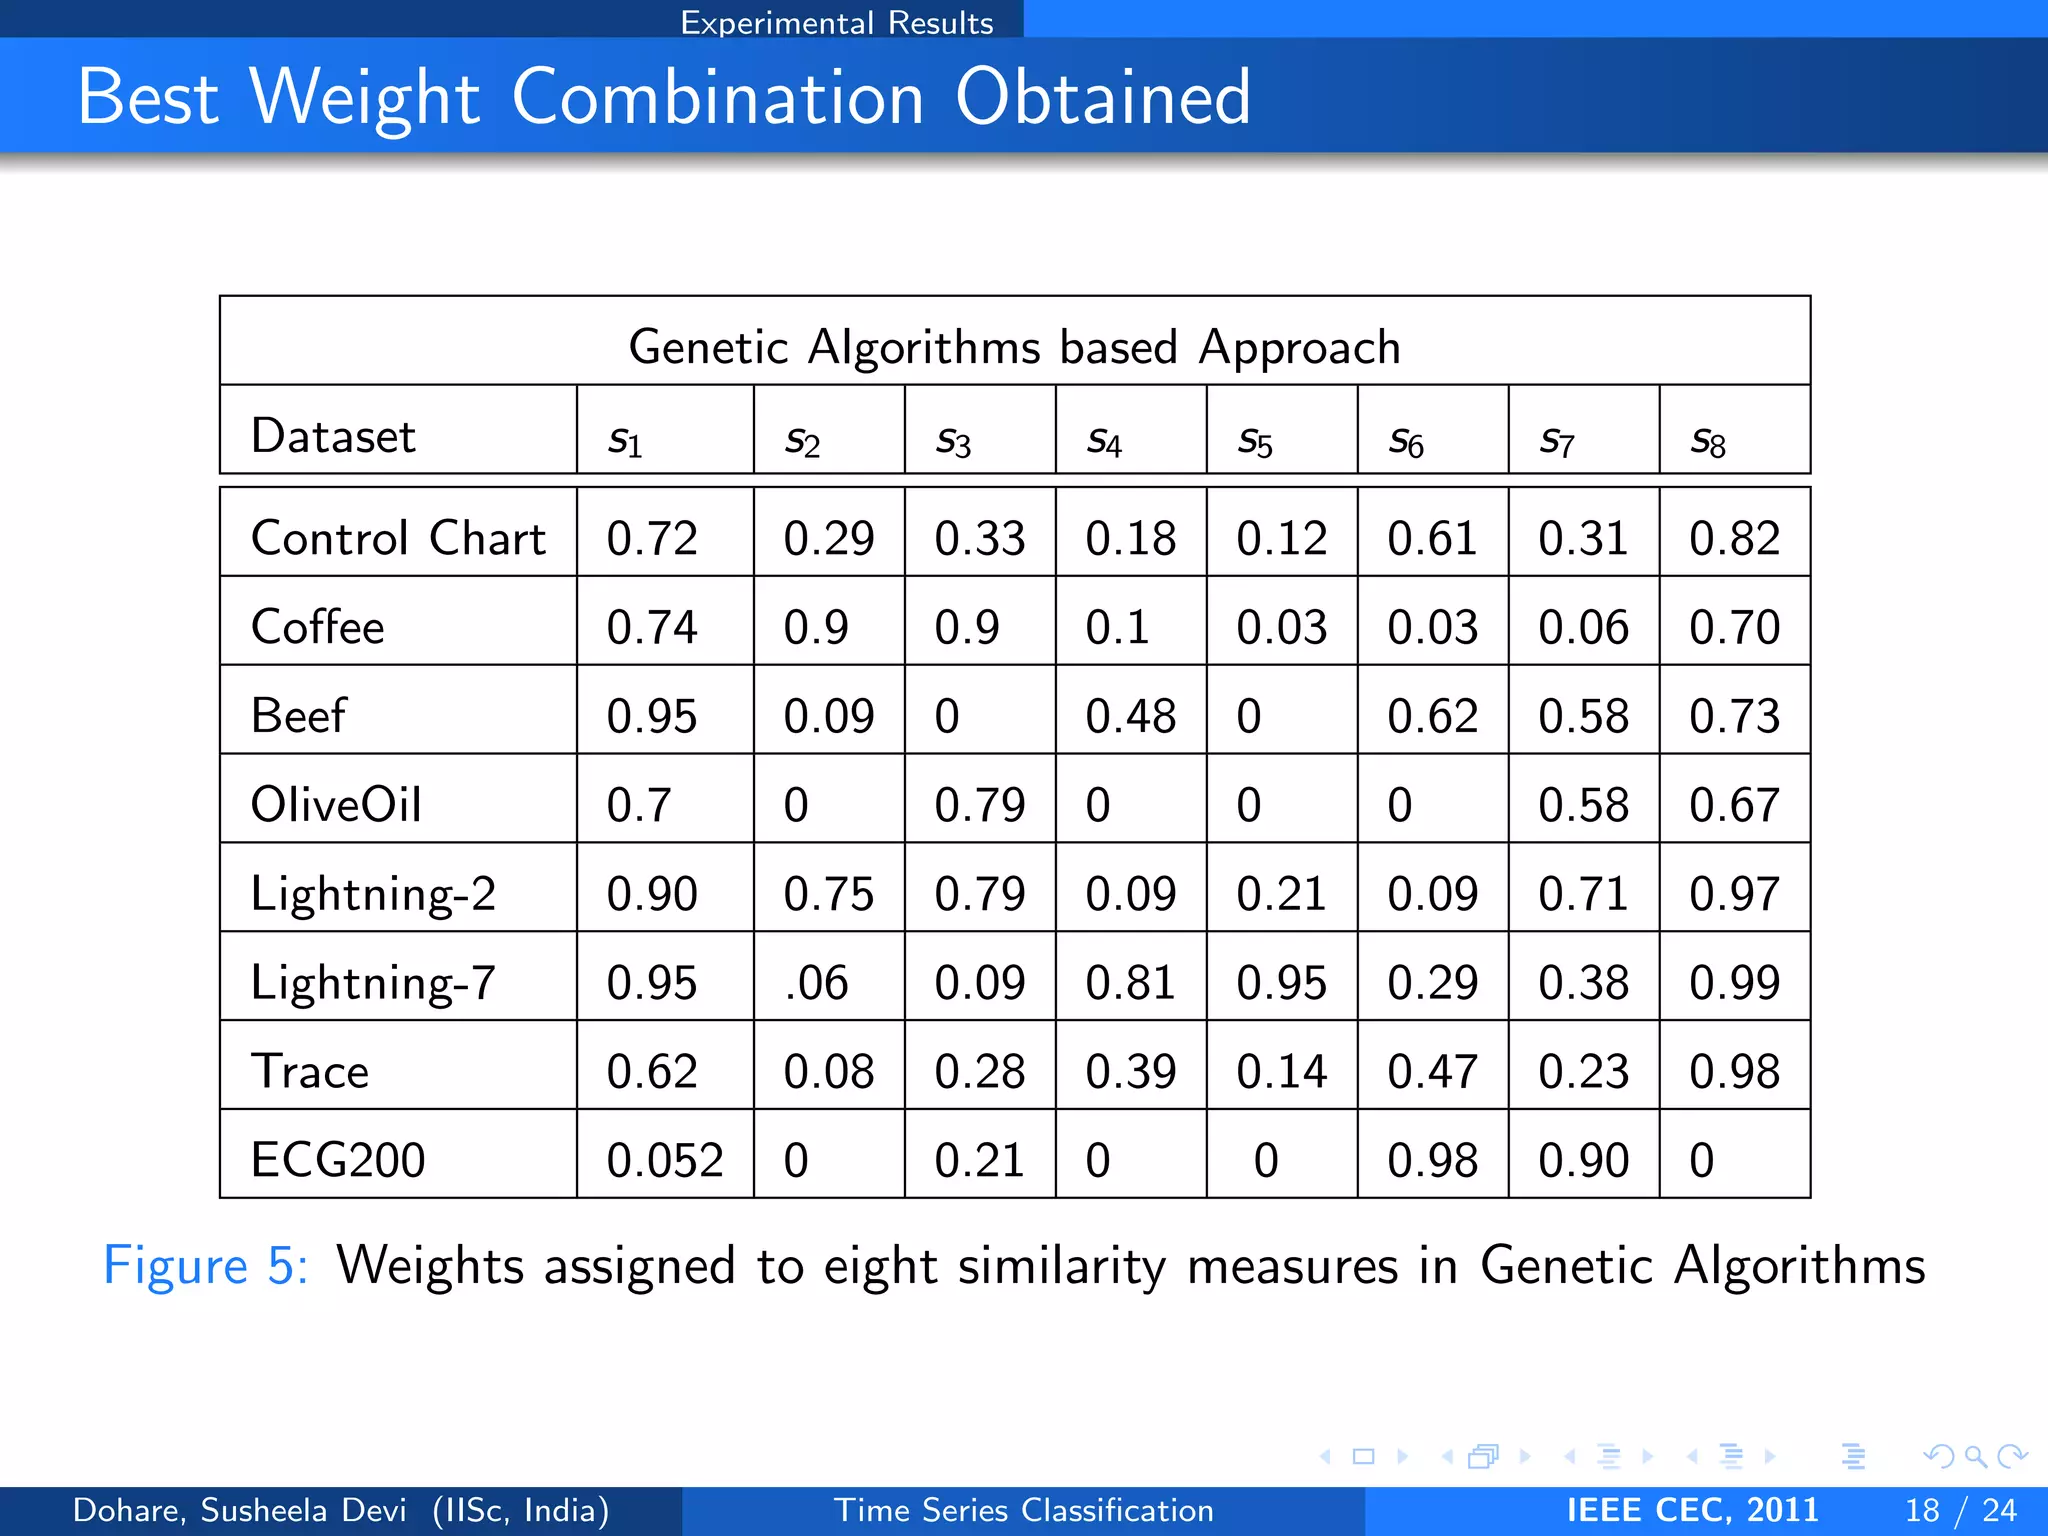
The proposed GENETIC APPROACH gives the best combination of
weights W :
W = [w1, w2, . . . , wn]
for n similarity measures using the training set and the validation set
Resultant weights are assigned to the different similarity measures
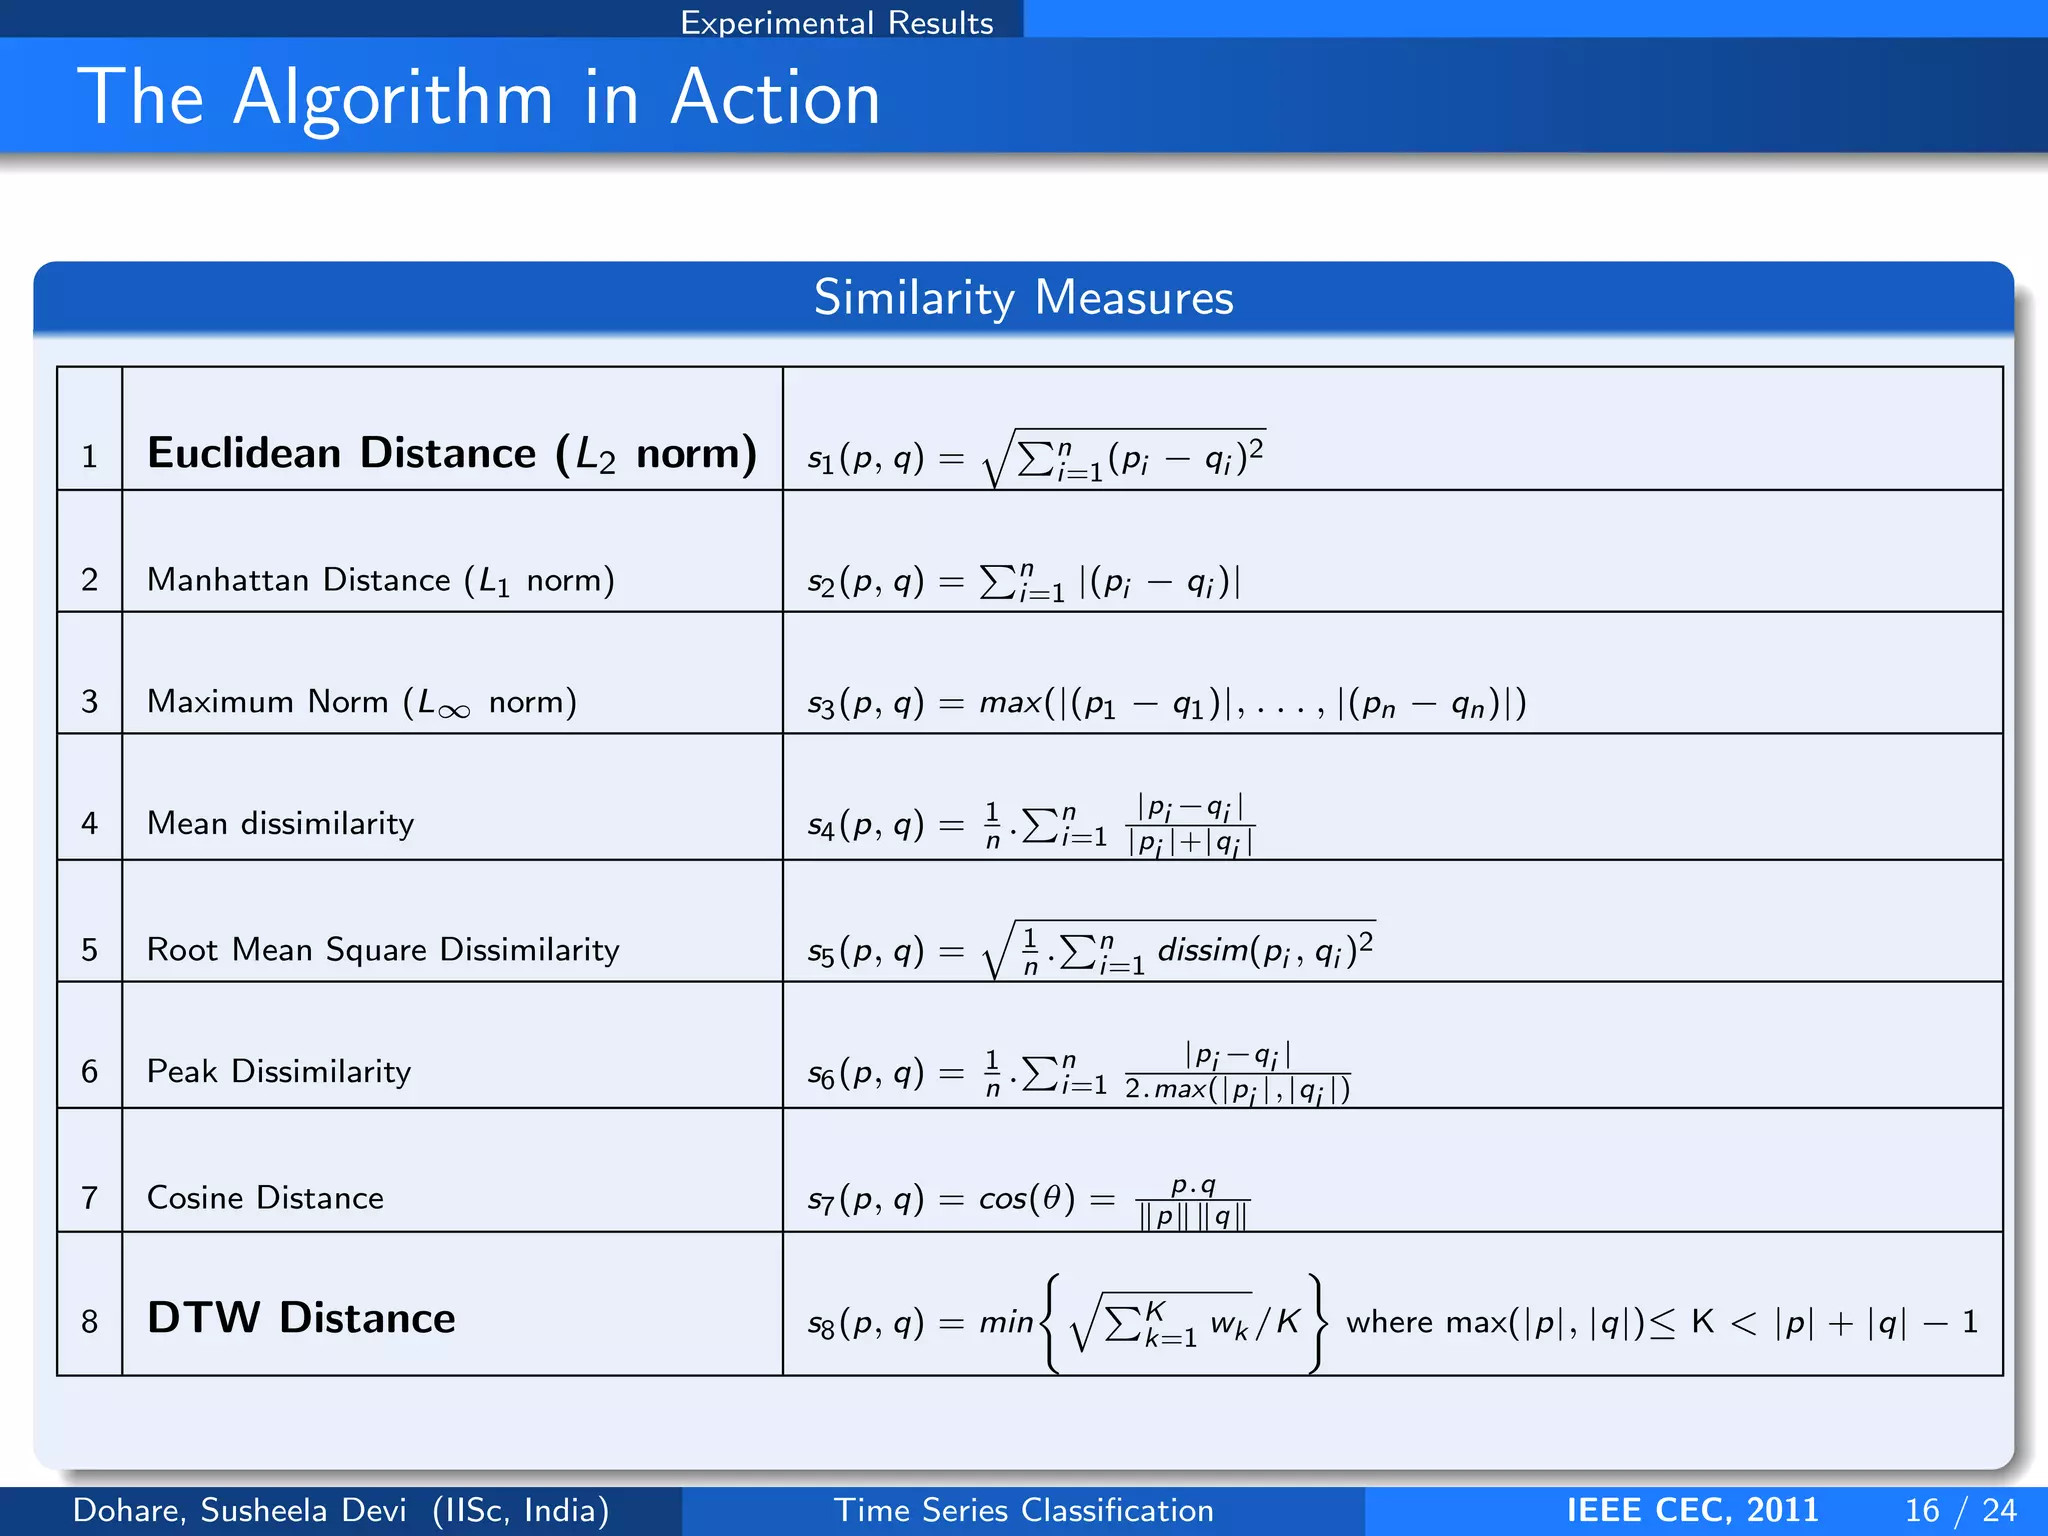
which are combined to yield the new similarity measure Snew :
Snew = s1.w1 + s2.w2 + · · · + sn.wn
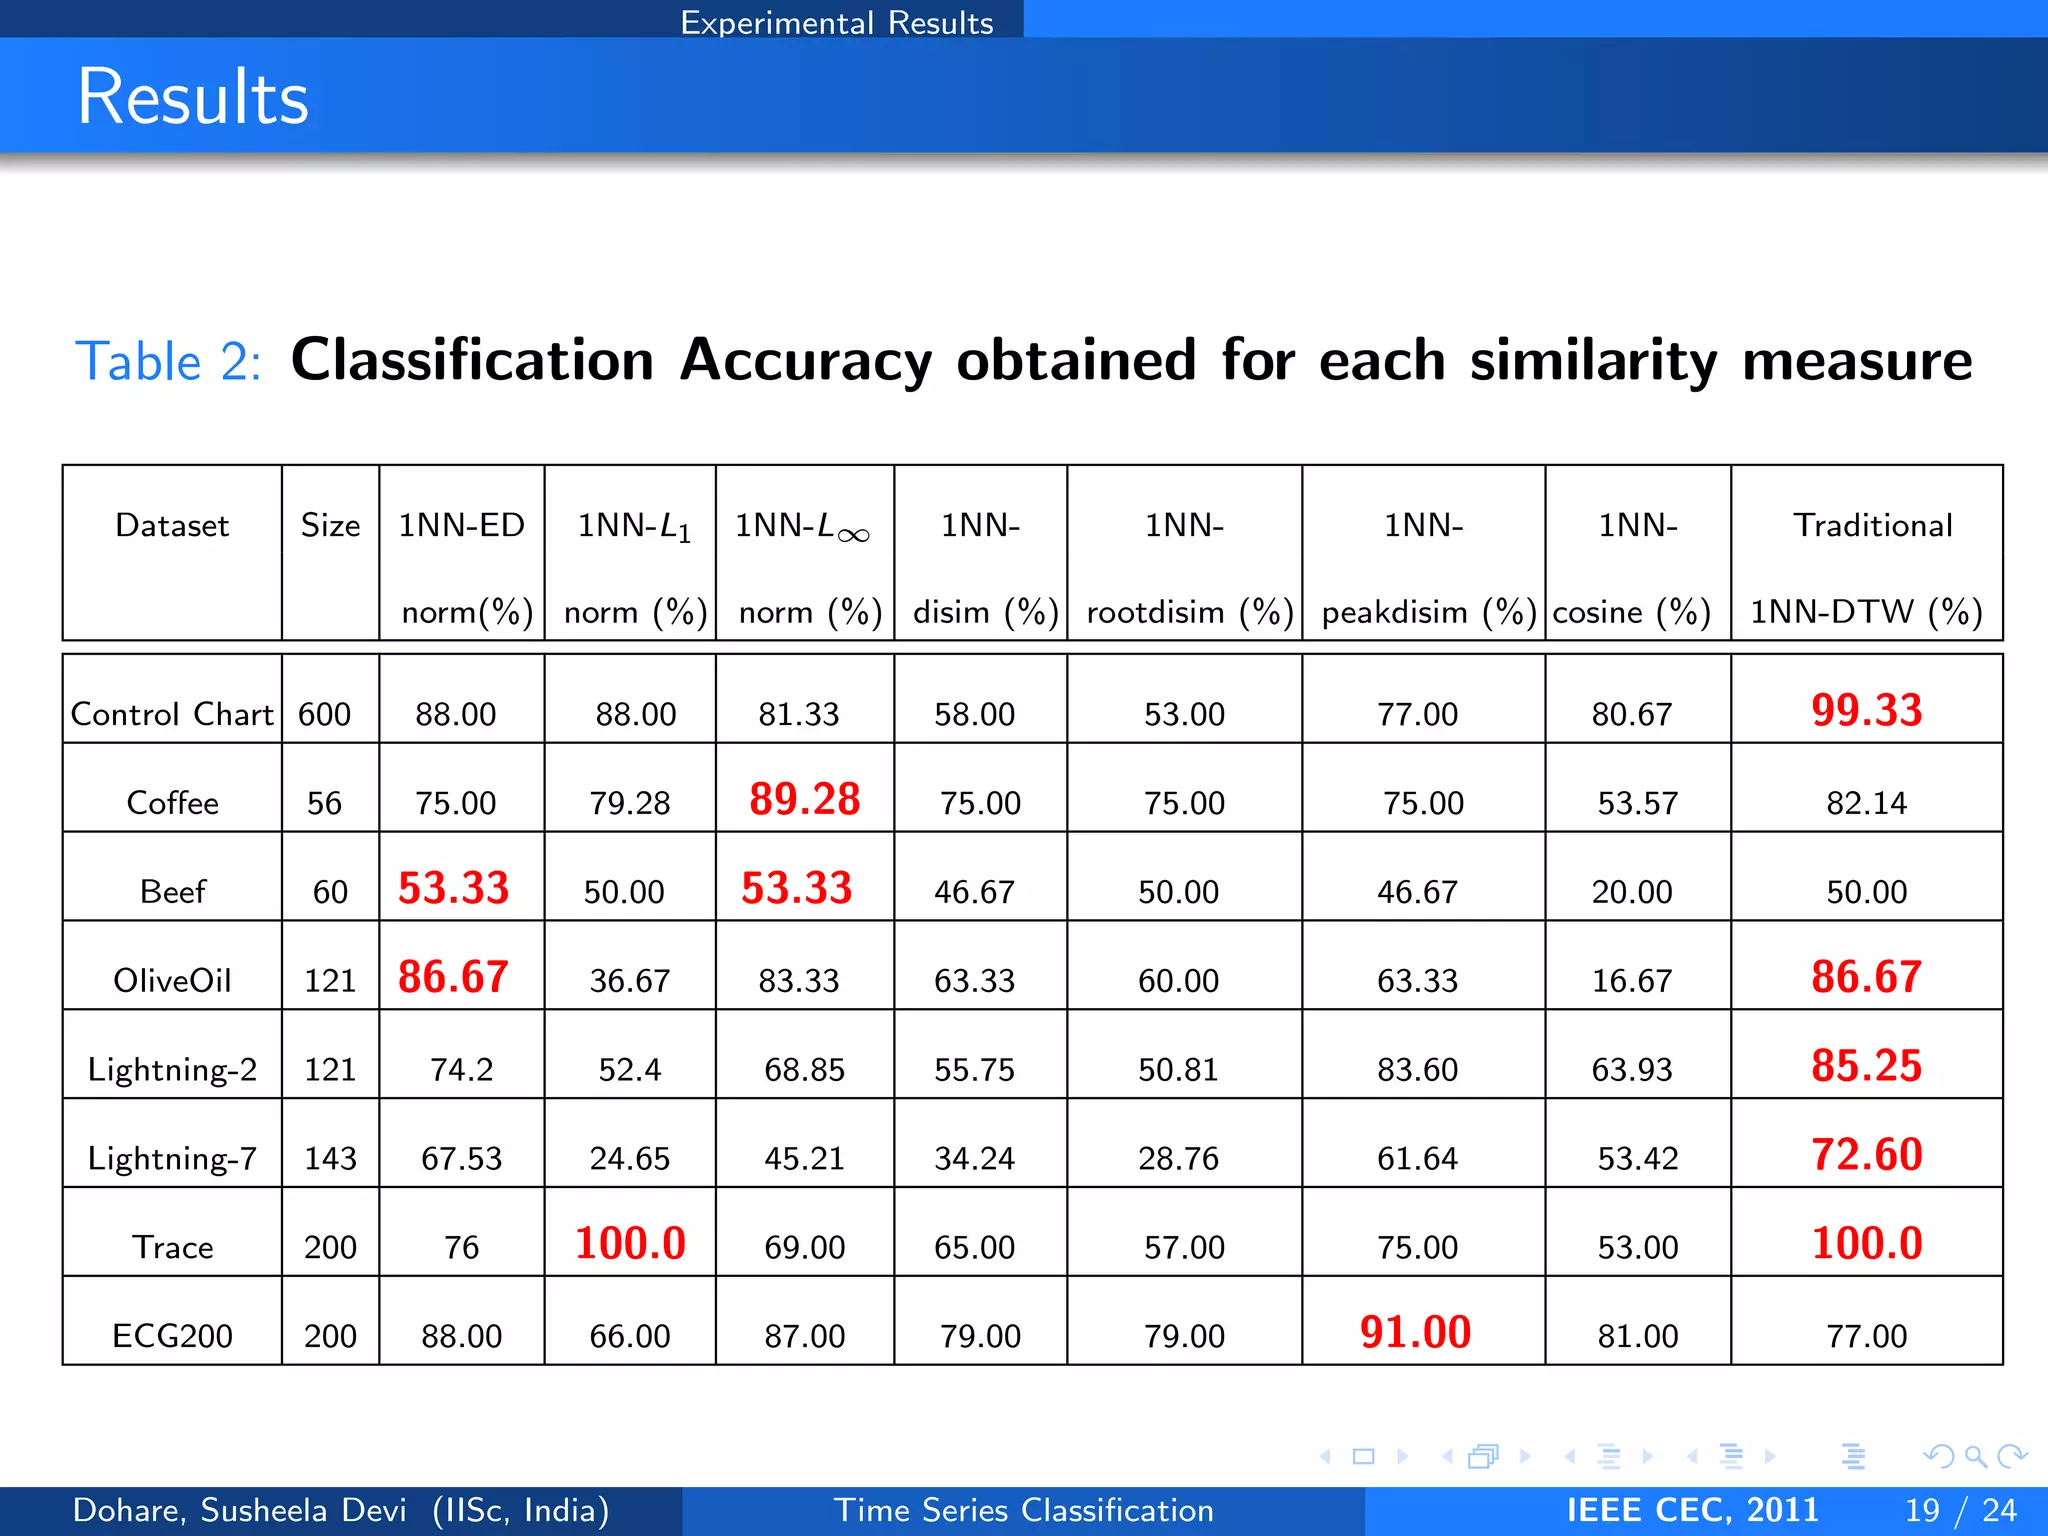
Snew is then used to classify the test data using 1NN
Dohare, Susheela Devi (IISc, India) Time Series Classification IEEE CEC, 2011 12 / 24](https://image.slidesharecdn.com/confpresent-120327013817-phpapp01/75/Combination-of-similarity-measures-for-time-series-classification-using-genetics-algorithms-14-2048.jpg)

![Methodology Genetic algorithms based Approach
CLASSIFIER(Nst)
1: for i ← 1 to m do
2: for j ← 1 to length(Test Class labels) do
3: best so far ← inf
4: for k ← 1 to length(Train Class labels) do
5: x←training pattern
6: y←test pattern
7: Compute s1, s2, ..., sn distance function for x and y
8: S[i] ← s1 ∗ Nst[i][1] + s2 ∗ Nst[i][2] + .... + sn ∗ Nst[i][n]
9: if S[i] < best so far then
10: Predicted class ← Train Class labels[k]
11: end if
12: end for
13: if predicted class is same as the actual class then
14: correct ← correct + 1
15: end if
16: end for
17: CA[i] ← (correct/length(Test Class labels)) ∗ 100
18: end for
19: return CA
Figure 4: Subroutine CLASSIFIER: Computation of CA for one population matrix Nst of
size m × n .
Dohare, Susheela Devi (IISc, India) Time Series Classification IEEE CEC, 2011 15 / 24](https://image.slidesharecdn.com/confpresent-120327013817-phpapp01/75/Combination-of-similarity-measures-for-time-series-classification-using-genetics-algorithms-20-2048.jpg)

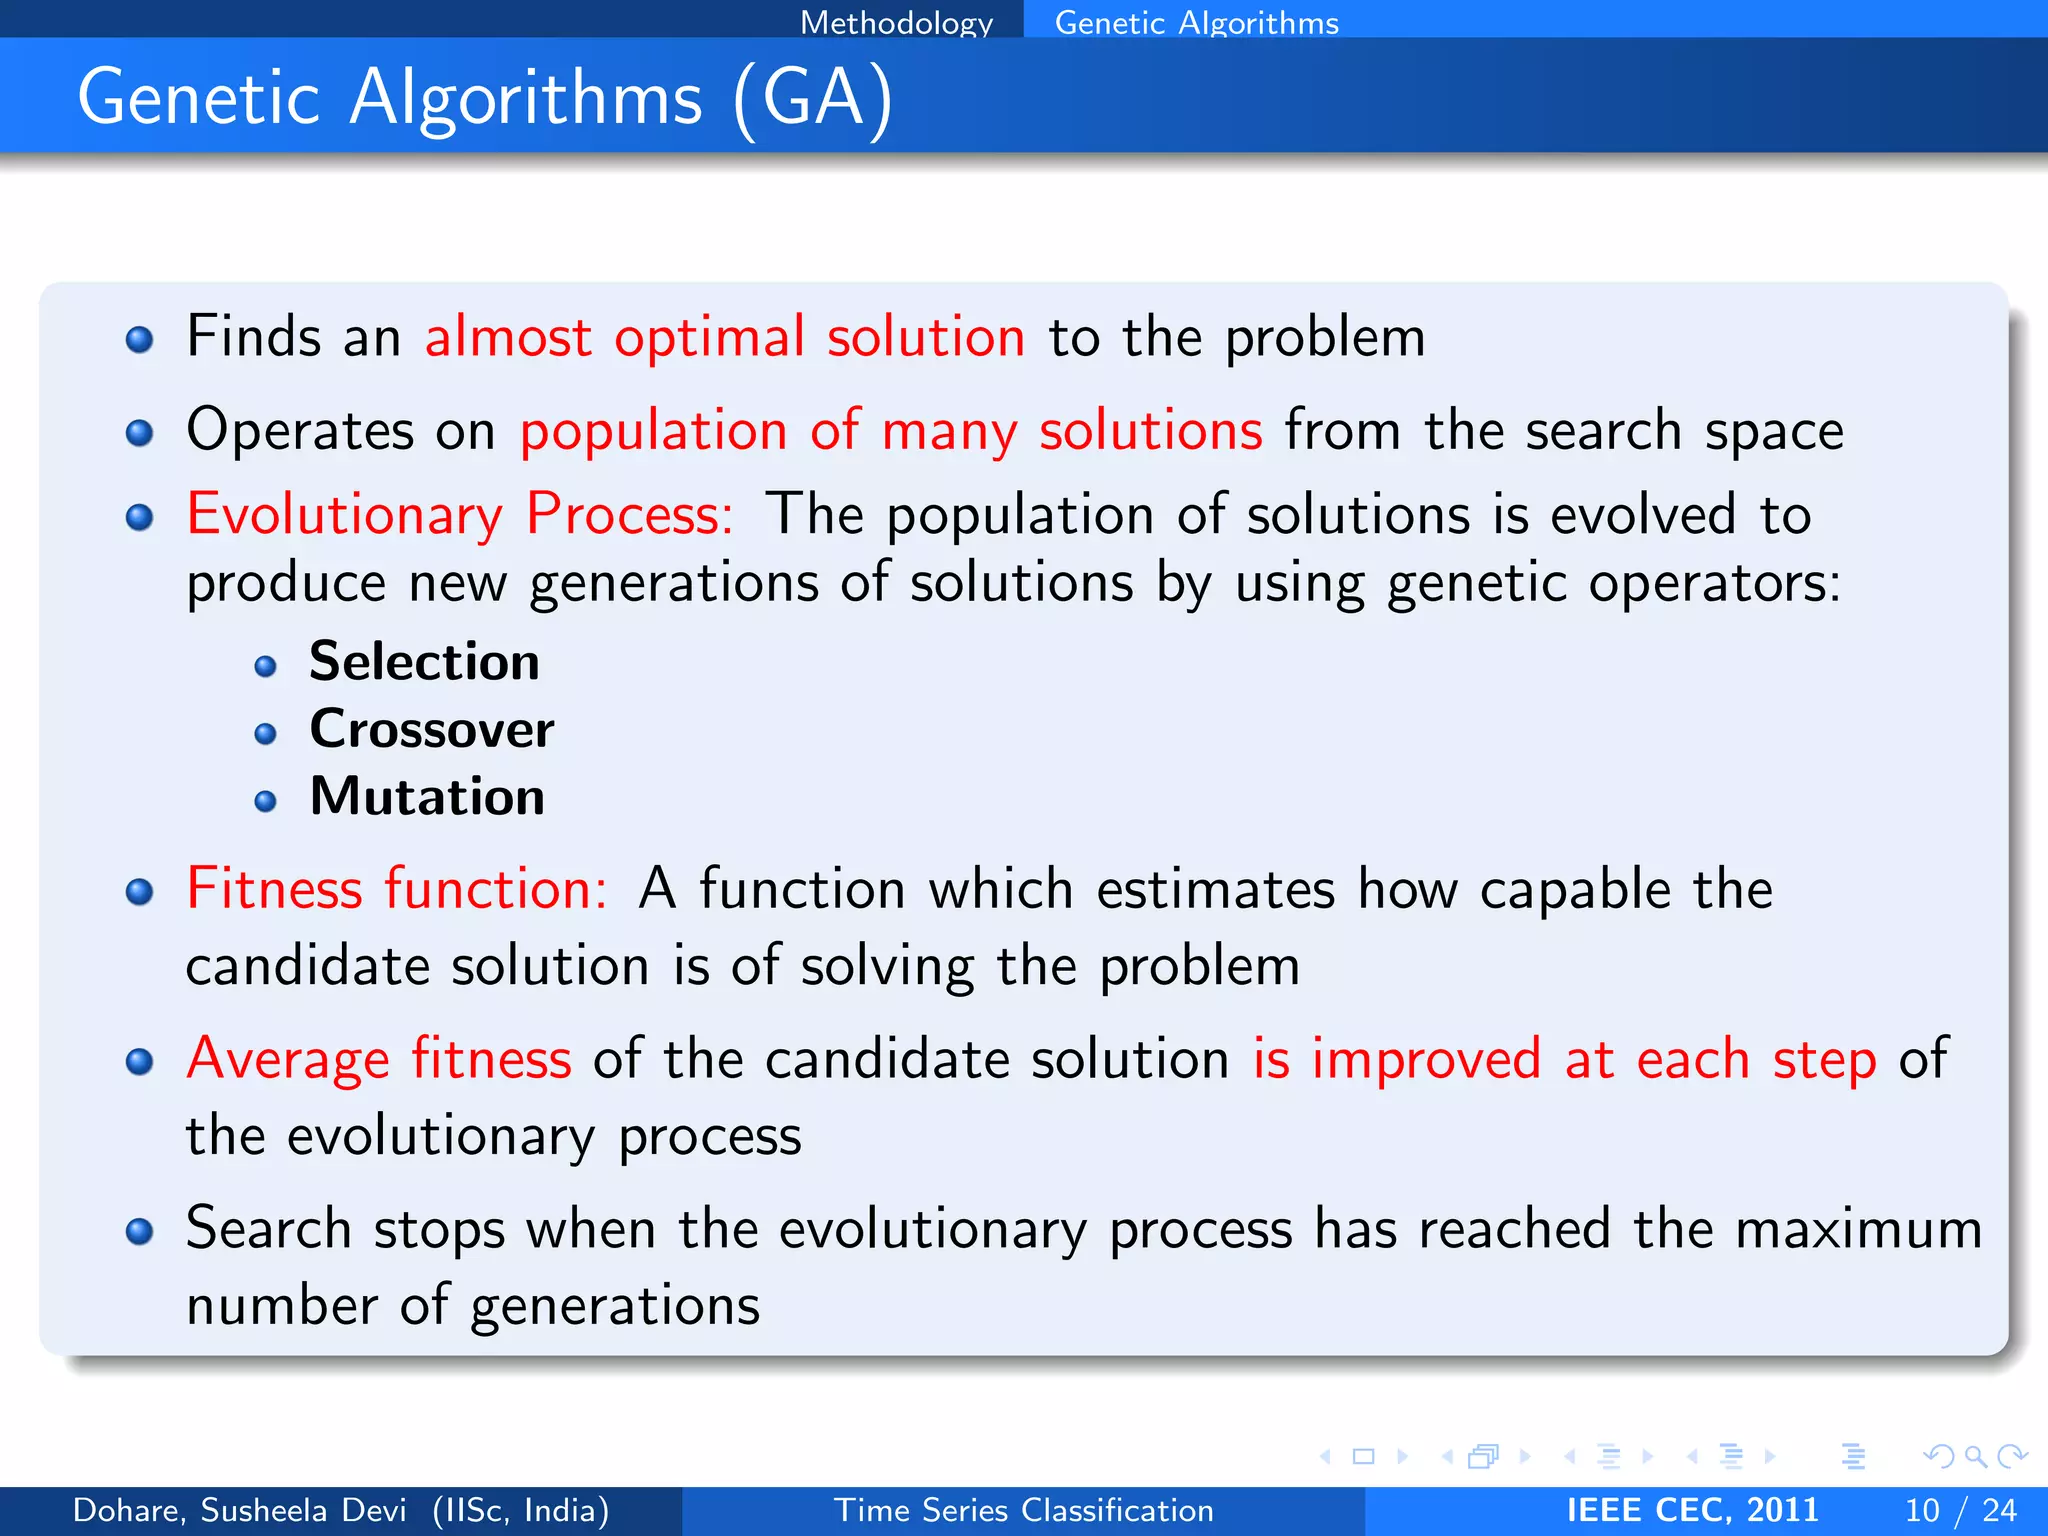
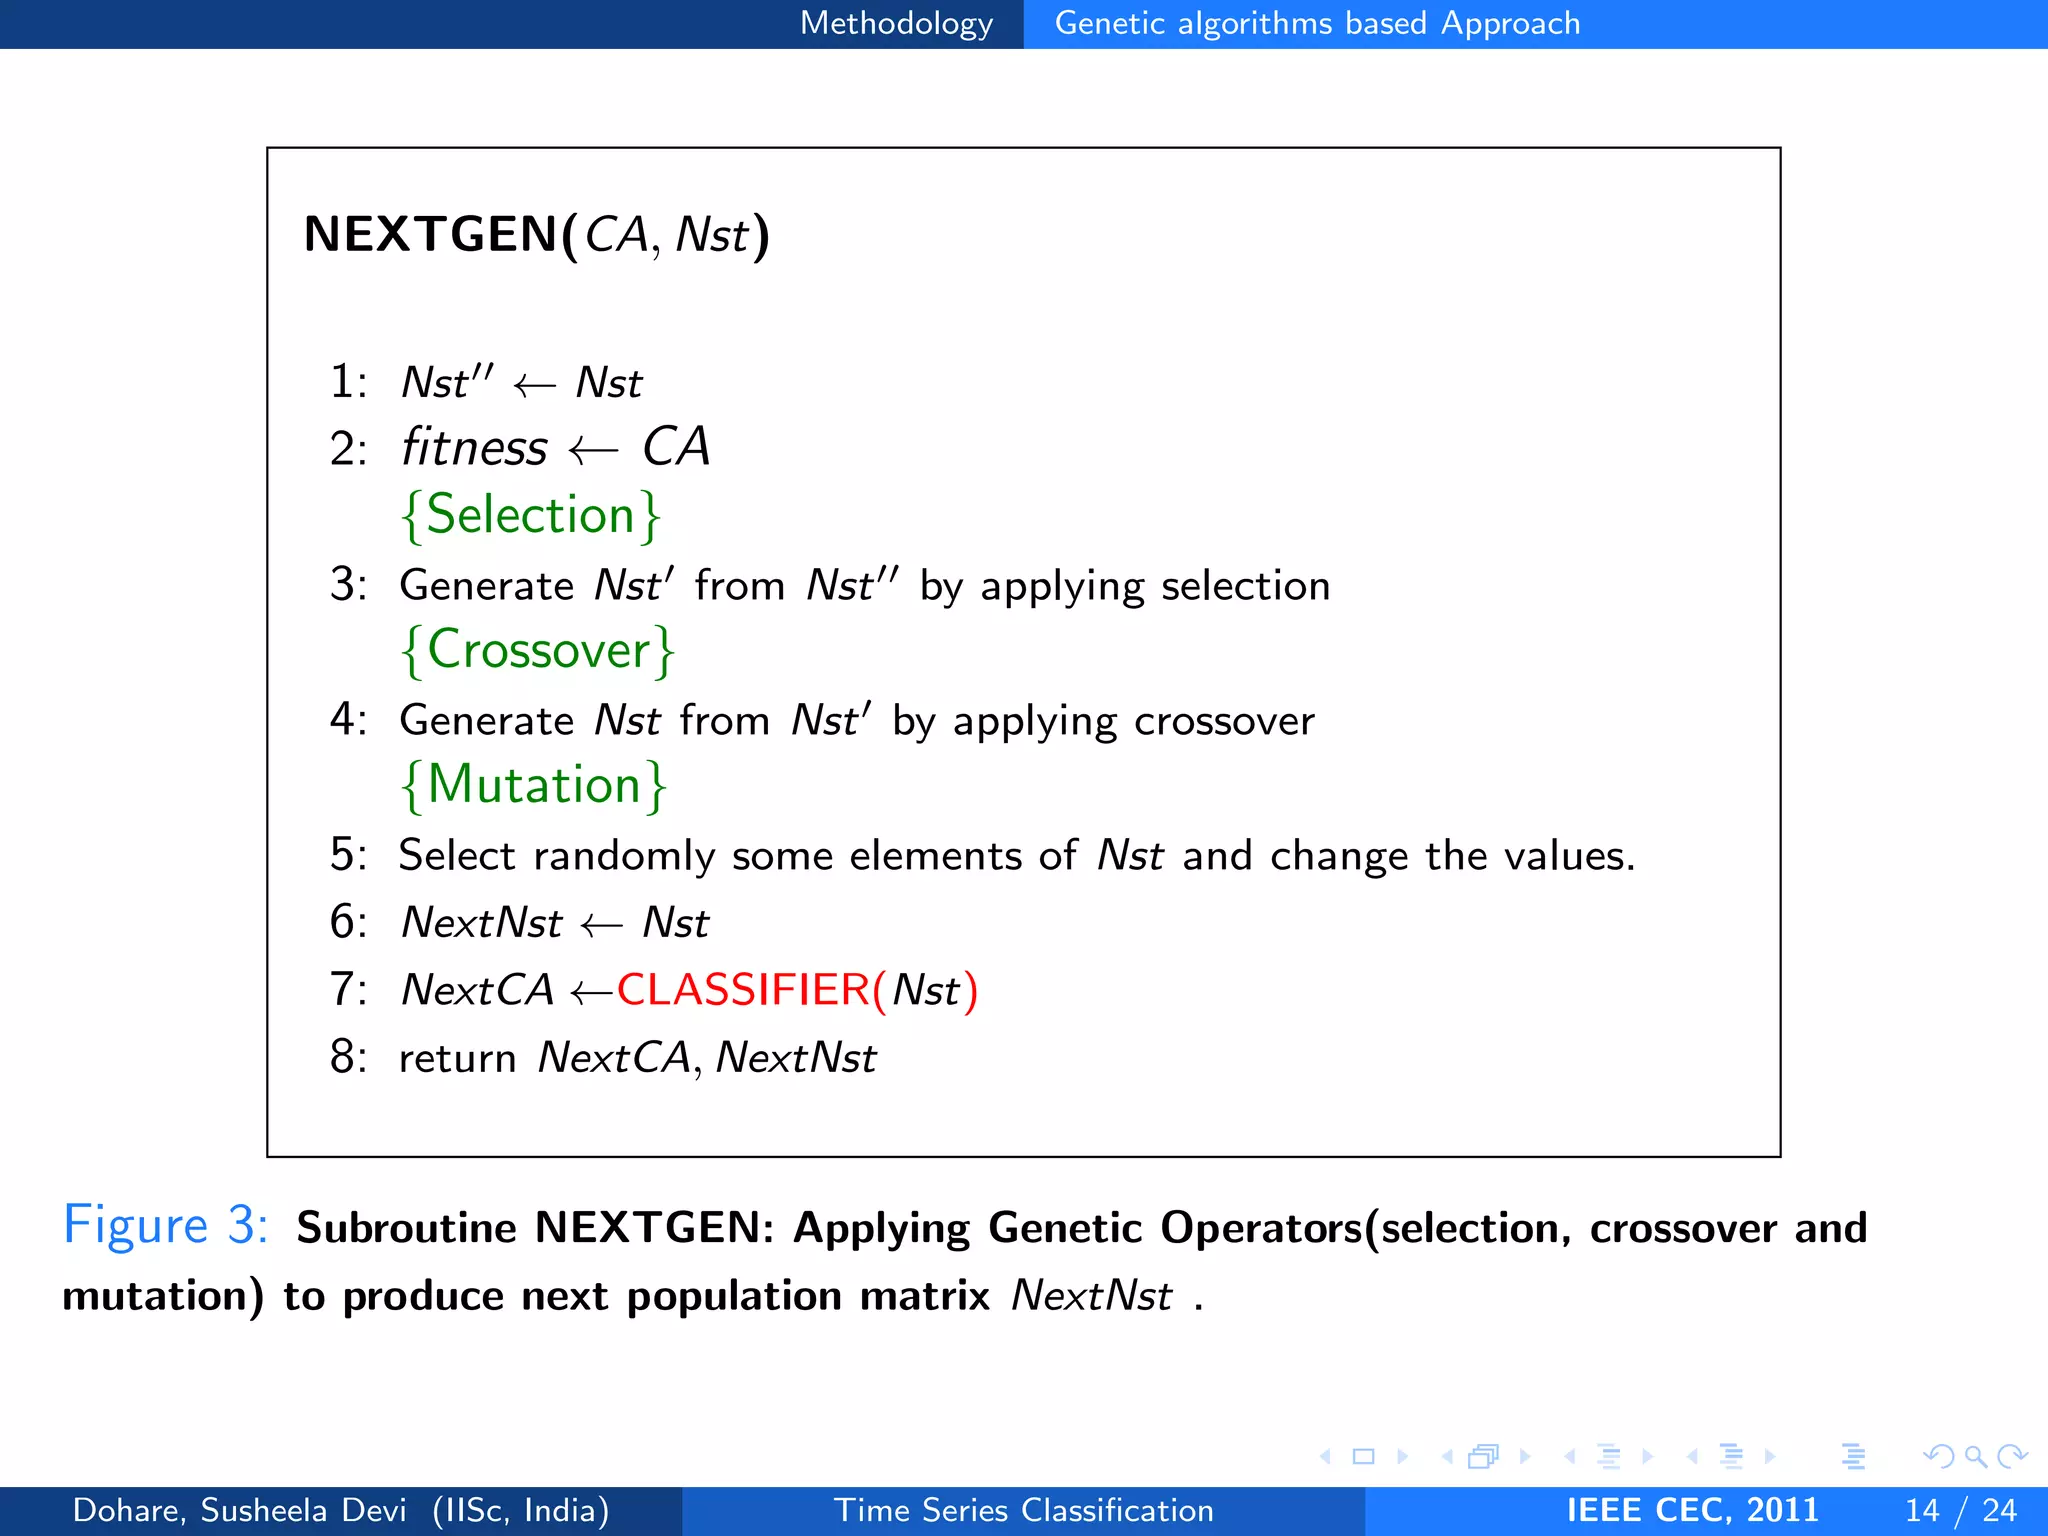
This document describes a genetic algorithm approach for time series classification that combines multiple similarity measures. The algorithm uses genetic operations like selection, crossover and mutation to evolve a population of weight combinations for different similarity measures over generations. The weight combinations represent candidate solutions, and classification accuracy on a validation set is used as the fitness function. The final solution returned is the weight combination that yields the highest classification accuracy.