This document discusses the interrelation between computer vision performance and image quality metrics, focusing on how various image distortions impact algorithms used in object segmentation, tracking, and detection. It highlights the inadequacies of existing image quality metrics in predicting performance in virtual and augmented reality scenarios, suggesting that incorporating computer vision approaches can improve these predictions. A new synthetic image database is introduced to support the analysis, and a reciprocal methodology is proposed to enhance image quality assessment using computer vision techniques.

![28 Computer Science & Information Technology (CS & IT)
errors occur when synthetic objects are algorithmically merged with captured content, and the
synthetic addition is positioned incorrectly, scaled wrongly or not aligned with the captured
environment.
This paper analyzes the impact of classical image errors and novel scene composition errors on
standard computer vision approaches. For this analysis an image database is necessary, which
contains both classical image distortions and scene composition errors, and comes with additional
information like ground truth segmentation data, object information or subjective evaluations.
Section 2 introduces this database.
We analyze the impact of distortions for three very basic computer vision algorithms, which are
object segmentation, object tracking and object detection. In Section 3 we introduce these
computer vision algorithms and the experiments we have set up to analyze the distortion impact.
Knowing the impact of a distortion on computer vision algorithms for a single image is
interesting, yet far more interesting is the ability to predict the impact of distortions. A good
prediction can enable system designers to define robustness levels for computer vision systems.
In Section 4 we correlate the distortion impact to three image quality metrics, which are
subjective opinion scores, scores based on image statistics and scores based on the human visual
system.
Finally, in Section 5, we switch the perspective. After having evaluated how image quality
metrics can be used to predict computer vision performance, we introduce an approach which
employs computer vision algorithms for enhanced image quality assessment. We thus have image
quality metrics to predict computer vision performance and computer vision to enhance image
quality metrics - a reciprocal relation.
2. THE IMAGE DATABASE
In order to conduct experiments according to the above mentioned motivation an image database
is necessary that fulfills several requirements. Most importantly, color images are required which
are distorted by classical errors such as noise and compression artifacts. Second, the images need
to contain synthetic objects which can be modified to model scene composition errors. Third,
ground truth segmentation data needs to be available to conduct object segmentation and tracking
experiments. Last, to allow comparisons to subjective assessments, mean opinion scores (MOS)
need to be available for the distorted images.
Several image databases exist that fulfill one or few of these requirements. The LIVE and
TID2013 database [1], [2] are databases based on real images which are distorted by classical
image errors and subjectively evaluated. Both databases lack the ability to modify scene objects,
and ground truth segmentation data is missing. The BSDS500 database [3] contains images and
segmentation data, yet also lacks the ability to modify objects and has no subjective evaluations
for the images. As - to our knowledge - no suitable database exists, we present the Synthetic
Image Database SSID, which we have created from fully synthetic scenes with the goal to enable
scene composition modifications, image distortions and additional data like depth maps and
segmentation data. This database was evaluated by human assessors, and MOS have been
calculated for all distorted images [4].
Figure 1a shows a set of scenes contained in the database and presents a depth map (Figure 1b)
and a segmentation map (Figure 1c) which can be easily rendered from the synthetic data. In the
database Gaussian blur, white noise, JPEG and JPEG2000 coding artifacts as well as object
scaling, rotation and translation are implemented as distortions. For the distorted images roughly
20.000 opinions have been obtained from 200 assessors in subjective evaluations, and mean](https://image.slidesharecdn.com/csit76304-170107085142/85/COMPUTER-VISION-PERFORMANCE-AND-IMAGE-QUALITY-METRICS-A-RECIPROCAL-RELATION-2-320.jpg)
![Computer Science & Information Technology (CS & IT) 29
opinion scores have been calculated. The database is available online for image quality associated
research [5].
Figure 1.The Synthetic Image Database [4].
3. COMPUTER VISION – ALGORITHMS AND EXPERIMENTS
On the image database presented in Section 2 we test three computer vision algorithms, which are
object segmentation, object tracking and object detection. By measuring the success of the
computer vision algorithm we can derive the impact that a given image distortion has on a
computer vision approach. For these tests we observe a certain object per scene (e.g. the
computer, given in Figure 2 which is segmented, tracked and detected in the experiments
described in the following sections.
3.1. Object Segmentation
A well established and widely used image segmentation approach is presented by Achanta et al.
[6]. SLIC Superpixels are known for their high boundary recall at a low computational
complexity, at the cost of oversegmentation. The low computational complexity makes SLIC
Superpixel segmentation applicable even for real-time requirements. We evaluate experimentally,
how much the boundary recall of SLIC Superpixel segmentation is affected by image distortions.
Boundary recall ܾݎ here is defined as the ratio between correctly recalled boundary pixels in the
test image segmentation ܵ and total number of boundary pixels in the ground truth segmentation
ܶ:
ܾݎሺܵ, ܶሻ =
ሺௌ,்ሻ
ሺ்ሻ
(1)
where ܾሺܵ, ܶሻ are the boundary pixels of ground truth ܶ matching the boundary pixels of test
image segmentation ܵ, and ܾሺܶሻ are the boundary pixels of ܶ only. We compare the boundary
recall of each test image segmentation ܵ to the boundary recall of its reference image
segmentation ܴ, and record the impact on segmentation ܫ௦௧ as the ratio
ܫ௦௧ =
ሺௌ,்ሻ
ሺோ,்ሻ
=
ሺௌ,்ሻ
ሺோ,்ሻ
. (2)](https://image.slidesharecdn.com/csit76304-170107085142/85/COMPUTER-VISION-PERFORMANCE-AND-IMAGE-QUALITY-METRICS-A-RECIPROCAL-RELATION-3-320.jpg)
![30 Computer Science & Information Technology (CS & IT)
3.2. Object Tracking
Optical flow was introduced by Horn and Schunck in 1981 already [7] and presents a common
basis for object tracking between frames. In our experiment we “track” scene objects from a
reference image to the distorted test images. Using the ground truth segmentations we can
evaluate how many object pixels of the distorted image are tracked correctly from the reference
image. For a total number of pixels ݇ and correctly tracked pixels ݐ we calculate the impact on
tracking ܫ௧ as the ratio
ܫ௧ =
௧
. (3)
Figure 2. Exemplary Training Object for Object Detection.
3.3. Object Detection
A common way of detecting objects in images is to compare image features. The Scale-Invariant
Feature Transform (SIFT) was introduced by Lowe in 1999 [8], and in 2006 the faster Speeded-
Up Robust Features (SURF) were made public by Hay et al. [9]. SURFs can be learned on a
reference object, and then be used to detect the same object in a scene. For our experiment we
create renderings of objects outside of their scene and train SURFs on this image. We than
compare the matched SURFs between training object and reference image ݉ to the matched
SURFs between training object and test image ݊. The distortion impact on object detection ܫௗ௧௧
is than
ܫௗ௧௧ =
. (4)
For all impact measures I it is I = 1 if segmentation, tracking and detection remains as good in the
test image as in the reference, and I < 1 if the computer vision results are deteriorated in the test
cases compared to the reference.
4. IMAGE QUALITY – METRICS AND RESULTS
Image quality is usually assessed using image statistics or methods modeling the human visual
system. To predict the impact of image distortions on computer vision algorithms we calculate
two algorithmic image quality metrics and compare to subjective quality scores as well. Mean
Opinion Scores ()ܱܵܯ are already available through subjective tests for the database described in
Section 2.](https://image.slidesharecdn.com/csit76304-170107085142/85/COMPUTER-VISION-PERFORMANCE-AND-IMAGE-QUALITY-METRICS-A-RECIPROCAL-RELATION-4-320.jpg)
![Computer Science & Information Technology (CS & IT) 31
For a reference image ܴ and a test image ܶ with dimensions ݔ × ݕ an average value expressing
the overall statistical image error is the Mean Squared Error ()ܧܵܯ calculated as
ܧܵܯሺܶ, ܴሻ =
ଵ
௫∙௬
∑ ∑ ൫ܴሺ݅, ݆ሻ − ܶሺ݅, ݆ሻ൯
ଶ௬
ୀ
௫
ୀ . (5)
In the Peak Signal to Noise Ratio (ܴܲܵܰ) the ܧܵܯ is related to the amplitude of the original
signal:
ܴܲܵܰሺܶ, ܴሻ =
௫∈ሾబ,ೣሿቀ௫ೕ∈ሾబ,ሿ൫ோሺ,ሻమ൯ቁ
ெௌா
. (6)
Table 1. Table of Spearman Rank Correlations between Distortion Impact and Quality Measures.
The ܴܲܵܰ is still a very common metric for image quality analysis. It can be easily implemented
and has a very low computational complexity, which is an important criterion for real-time
applications. For image quality assessment ܴܲܵܰ has been shown to relate poorly to subjective
image quality findings [10]. Therefore metrics based on the human visual system have been
developed, of which the Structural Similarity (ܵܵ)ܯܫ is a widely established one [11]. The
Structural Similarity index (ܵܵ)ܯܫ compares three different image components: luminance,
contrast and structure. Structural similarity ܵܵܯܫ between a test image ܶ and a reference image ܴ
is calculated as the weighted product of luminance ݈, contrast ܿ and structure :ݏ
ܵܵܯܫሺܶ, ܴሻ = ݈ሺܶ, ܴሻఈ
· ܿሺܶ, ܴሻఉ
· ݏሺܴ, ܶሻఊ
(7)
with 0 < ߙ, ߚ, ߛ.
A fourth measure for image quality which we analyze in the context of this work is the parameter
which was used to distort the image. As the scene composition errors are assigned with error
parameters for 3 dimensions, we map the three parameters to one error parameter ܲܣܴܣ by
calculating the absolute rotation angle, absolute size deviation and vector sum of transitions.
We than calculate the Spearman rank correlation [12] between the distortion impact on
segmentation ܫ௦௧, tracking ܫ௧ and detection ܫௗ௧௧ and the quality measures ,ܱܵܯ
ܴܲܵܰ, ܵܵܯܫ and ܲ.ܣܴܣ Table 1 presents the correlation values for different image distortion
classes. These distortion classes are noise (including white noise and Gaussian blur), compression
artifacts (including JPEG and JPEG2000 compression artifacts), transformation errors (including
object rotation, scaling and translation errors) and all (superclass of all previous classes). A bold
font indicates the best correlation in each error class for one computer vision approach.](https://image.slidesharecdn.com/csit76304-170107085142/85/COMPUTER-VISION-PERFORMANCE-AND-IMAGE-QUALITY-METRICS-A-RECIPROCAL-RELATION-5-320.jpg)
![32 Computer Science & Information Technology (CS & IT)
Table 1 indicates that ܴܲܵܰ and ܵܵܯܫ are good measures to predict the success of computer
vision algorithms. Especially object tracking is very well correlated to ܵܵܯܫ and ܴܲܵܰ. Only for
the noise error class the error parameter (if obtainable) is suggested as a success indicator, while
ܵܵܯܫ has almost no correlation to the impact of noise on object detection. At the same time,
when correlating the presented quality metrics ܴܲܵܰ, ܵܵܯܫ and ܲܣܴܣ to the subjective ,ܱܵܯ it
becomes clear that neither those presented metrics (nor any other metrics known to us) present
suitable predictors for image distortions resulting from scene composition errors. This
observation is confirmed by Caviedes at al. who note that subjective quality is more aesthetically-
oriented whereas computer vision may have different quality requirements [13].
Figure 3. Structure of our proposed SC-VQM.
5. A RECIPROCAL RELATION
In [14] we approach this problem of predicting subjective image quality and develop a Visual
Quality Metric for Synthetic Content (SC-VQM) that employs computer vision algorithms to
better predict subjective image quality in virtual worlds or augmented reality scenarios. The
approach to achieve this goal is straight forward: We detect object changes and correct those
before calculating a residual error. This idea is outlined in the block diagram in Figure 3 and
described by the following six steps:
1. Erroneous object detection: Distorted objects in a scene composition are detected
2. Erroneous object matching: Objects in test image are matched with objects in reference
image
3. Object size calculation: The portion of the image affected by the distorted object is
calculated
4. Environment structure analysis: The environment of the distorted objects is analyzed for
the amount of structures contained
5. Object correction: The object in the test image is corrected according to the reference
object, transformation parameters are recorded
6. Residual error calculation: The residual error between corrected object and reference
image is calculated
7. Approximate ܱܵܯ by detected parameters: All parameters from the previous analysis
steps are combined in an error model to predict a ܱܵܯ
5.1. Implementation
From a computer vision perspective the following three steps are most interesting: object
detection, object matching and object correction. They closely relate to the above mentioned
computer vision approaches of object segmentation, object detection and object tracking. To
illustrate these three steps we employ a sample image, which is introduced in Figure 4.
a) Erroneous Object Detection: A characteristic of erroneous objects is that image errors
accumulate in the areas of these objects. We use this characteristic and in a first step compute the](https://image.slidesharecdn.com/csit76304-170107085142/85/COMPUTER-VISION-PERFORMANCE-AND-IMAGE-QUALITY-METRICS-A-RECIPROCAL-RELATION-6-320.jpg)
![Computer Science & Information Technology (CS & IT) 33
average image error as the Mean Square Error. If objects are misplaced the image error in these
areas is above the average image error, while the error is below in other areas. By filtering the
error areas with a disk-shaped stencil, object areas can be distinguished. Two things are important
to note: First, the object outline is only rough, but covers the whole area in which an object is
misplaced with respect to the original. Second, the averaging disk size depends on image size and
viewing conditions, to differentiate between noise and relevant objects.
Figure 4. Example Image Set illustrating the implementation
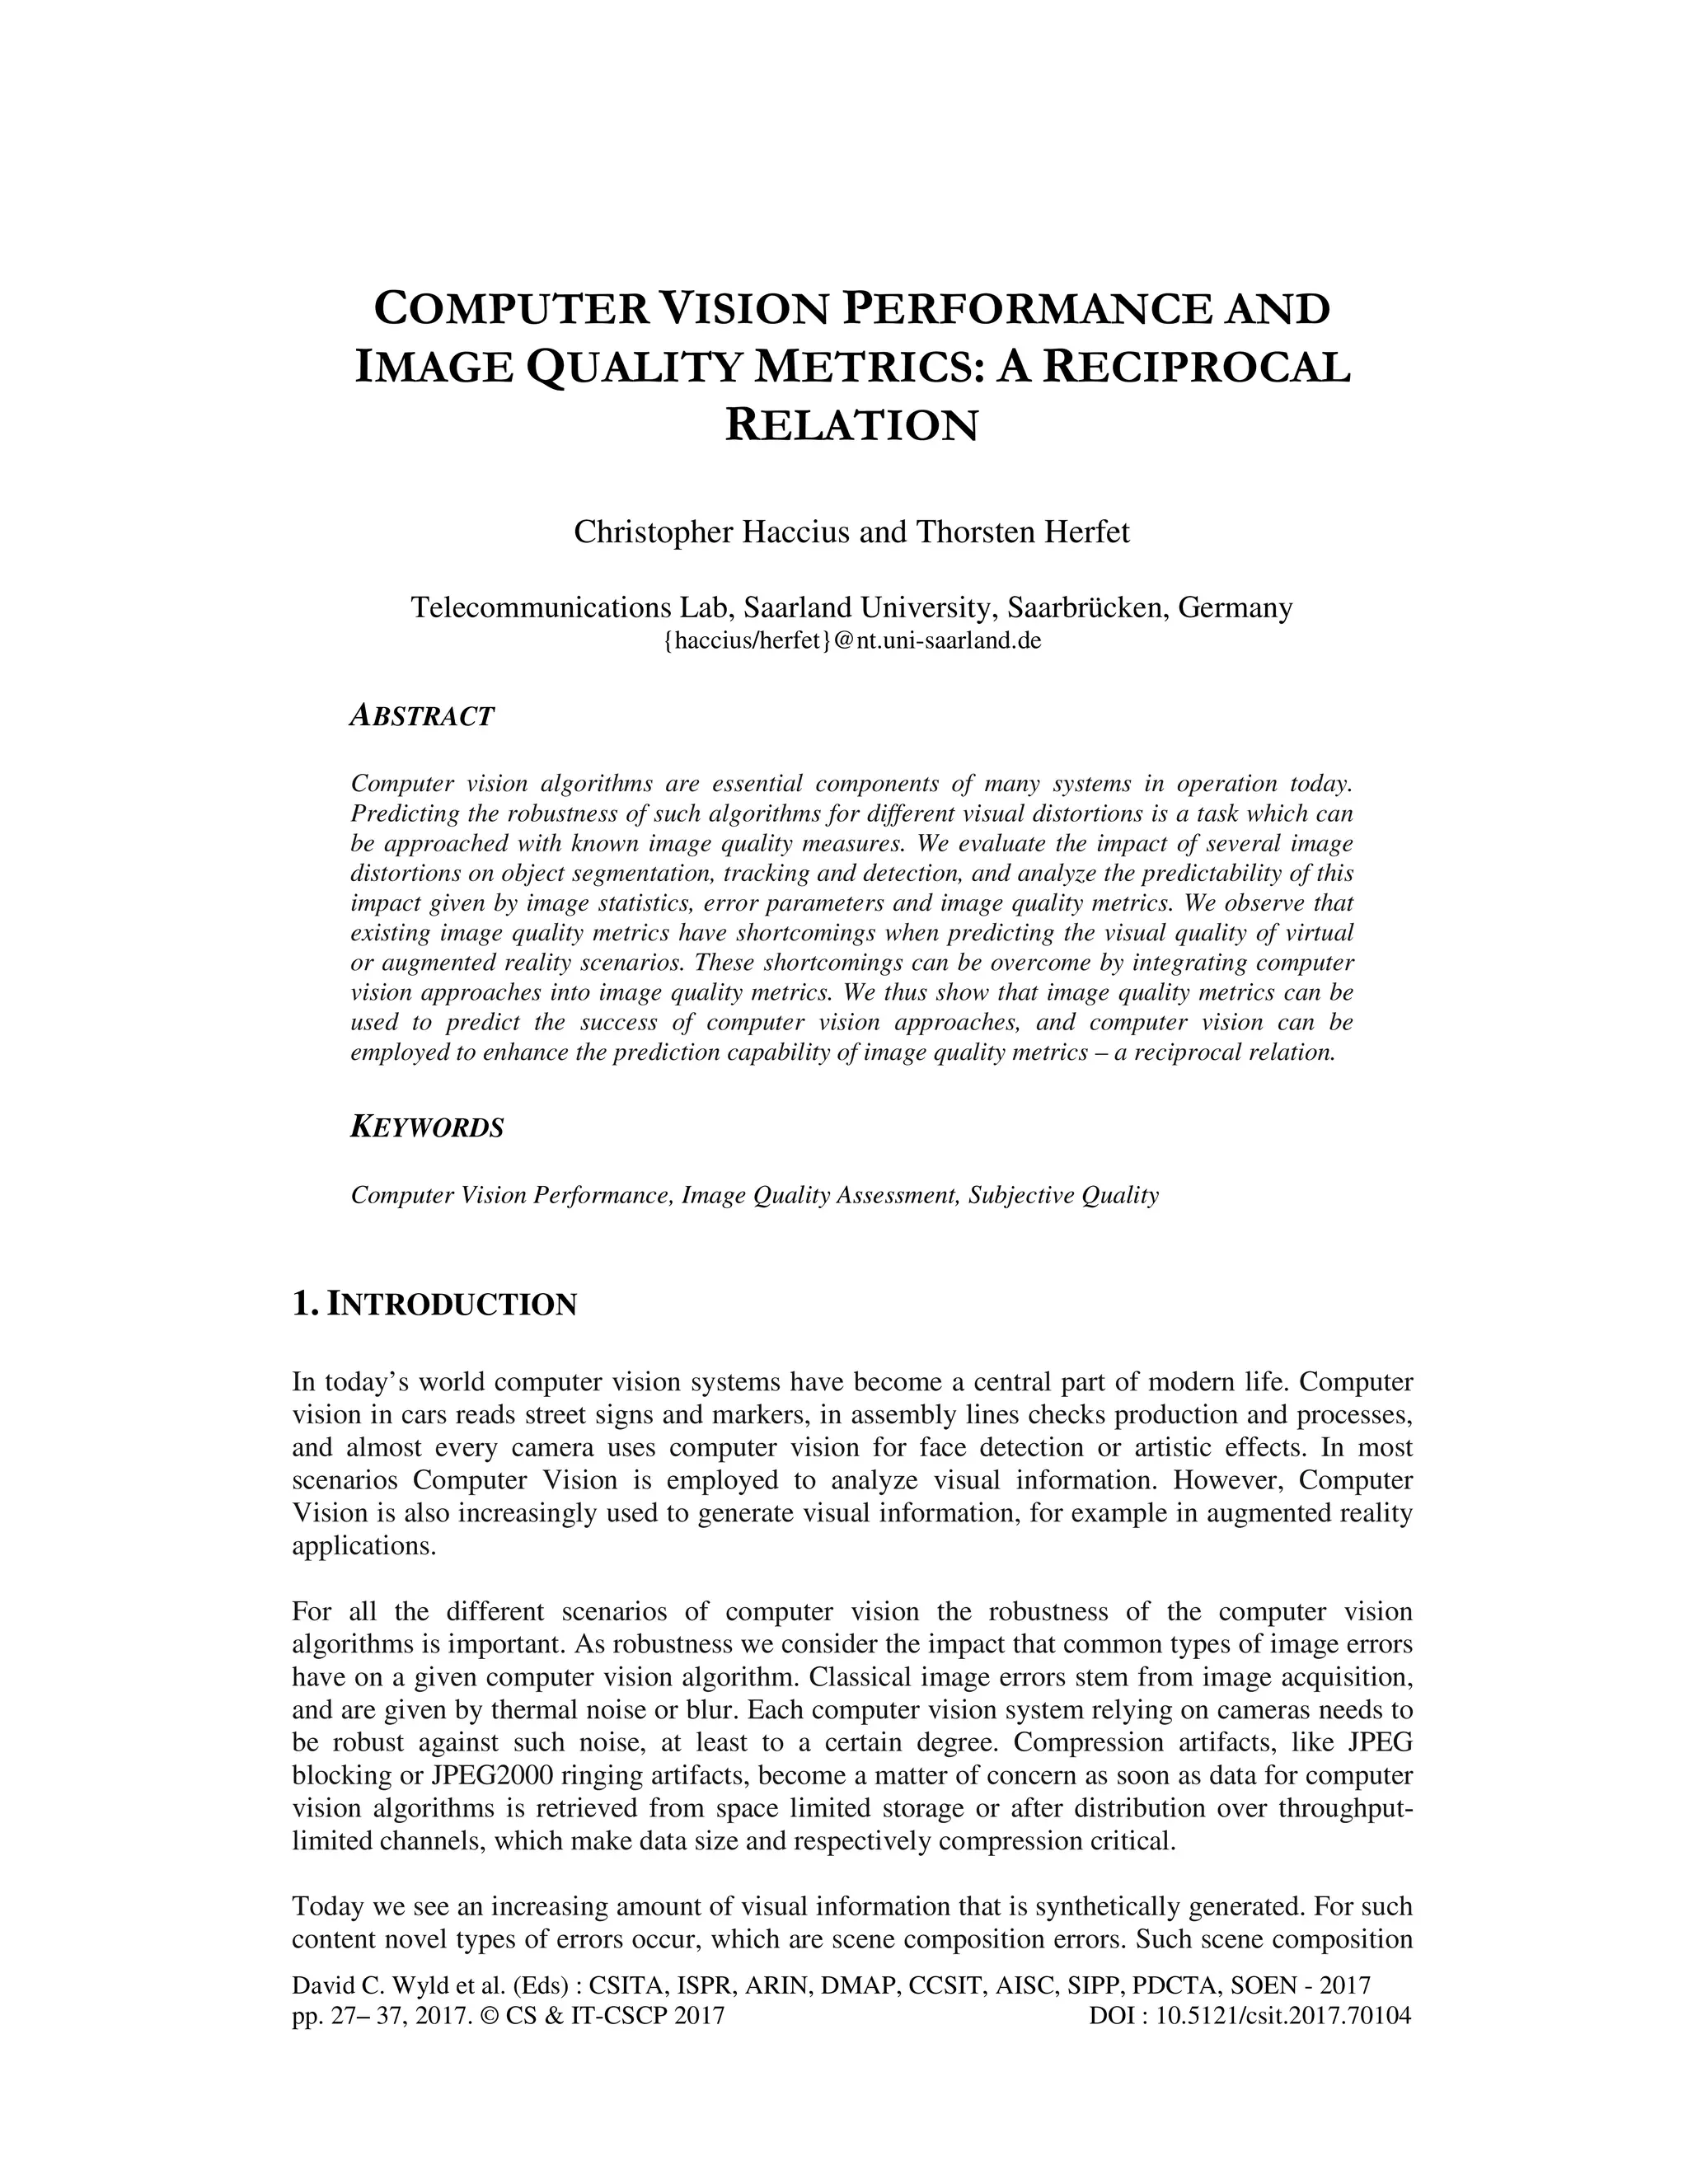
The result of this detection step is a mask with outlined areas. If multiple objects in an image are
moved, all of these areas are marked and noted. For the sample images shown in Figure 4 the
object detection mask is given in Figure 5.
b) Erroneous Object Matching: To match objects between test and reference images there are two
possible cases: a transformed object may be overlapping in reference and test image (only one
erroneous region detected) or they may be spatially distinct (two erroneous regions). With the
additional possibility to have several wrong objects in an image, we need to match each region
with itself and with all other error regions. For region matching we employ Scale Invariant
Features (SIFT) as proposed by Lowe [8]. For each area detected in the previous step we record
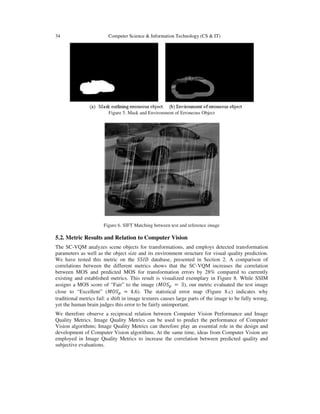
the closest match between reference and test image. Figure 6 shows detected features between
reference (top) and test image (bottom). The translation of the car between test and reference
image can already clearly be seen by the feature lines (white) running slightly tilted between both
images.
c) Object Correction: Reallocating the distorted object from the test image to its original position
in the reference image is an important task to calculate the visual disturbance of the picture
irrespective of any transformations. Initially, we remove the misplaced object from the test image
and fill the created hole with an inpainting algorithm. Second, we use the SIFT feature
correspondences to get a rough registration of the object in the test image [8]. As SIFT feature
matching leaves inaccuracies in the order of single pixels we employ a Levenberg-Marquardt
least-square optimization with a Fourier-Mellin transform module to achieve an image
registration with sub-pixel precision for exact object placement [15]. The order of applying the
SIFT registration before the Fourier-Mellin transform based registration is advantageous, as the
SIFT registration works robustly, but with a certain inaccuracy, while the Fourier-Mellin
transform becomes unstable for images that are too different from each other but works with a
high precision when images are closely aligned already. Our implemented concatenation is both
robust and precise. Finally, the registered object is fitted onto the filled background image. Filled
background image and test image after object registration are shown in Figure 7. Next to the
registered image this step retrieves the scaling, translation and rotation values between reference
and test object.](https://image.slidesharecdn.com/csit76304-170107085142/85/COMPUTER-VISION-PERFORMANCE-AND-IMAGE-QUALITY-METRICS-A-RECIPROCAL-RELATION-7-320.jpg)
![Computer Science & Information Technology (CS & IT) 35
Figure 7. Filled Background and Registered Object for Example Image Set.
Figure 8. Perceived quality does not always correspond to statistics.
6. CONCLUSION
In the previous sections we have shown that there exists a reciprocal relationship between image
quality and computer vision. As a basis for research connecting both domains we have developed
an image database, SSID, which contains synthetic images with classical image distortions and
scene composition errors. This database is subjectively evaluated and contains additional data
such as depth and segmentation maps, as well as the raw data to produce further information.
We have introduced three basic computer vision algorithms and four quality measures for visual
information and have analyzed the image quality measures concerning their suitability for
computer vision success prediction. Especially ܴܲܵܰ and ܵܵܯܫ were found to predict the impact
of image distortions on computer vision algorithms well.
On the other hand we have observed that image quality metrics fail for visual content produced
with computer vision approaches. Therefore a novel visual quality metric, SC-VQM, was
developed, which is especially designed to analyze synthetic contents in virtual worlds or
augmented reality scenarios. This metric can increase the quality prediction by 28% compared to
current standard quality metrics.
Thus image quality metrics can be used to predict the success of computer vision approaches and
computer vision can be employed to enhance the prediction capability of image quality metrics - a
reciprocal relation.
REFERENCES
[1] Hamid R Sheikh, Zhou Wang, Lawrence Cormack, and Alan C Bovik, “Live image quality
assessment database release 2,” 2005.](https://image.slidesharecdn.com/csit76304-170107085142/85/COMPUTER-VISION-PERFORMANCE-AND-IMAGE-QUALITY-METRICS-A-RECIPROCAL-RELATION-9-320.jpg)
![36 Computer Science & Information Technology (CS & IT)
[2] Nikolay Ponomarenko, Oleg Ieremeiev, Vladimir Lukin, Karen Egiazarian, Lukui Jin, Jaakko Astola,
Benoit Vozel, Kacem Chehdi, Marco Carli, Federica Battisti, et al., “Color image database tid2013:
Peculiarities and preliminary results,” in Visual Information Processing (EUVIP), 2013 4th European
Workshop on. IEEE, 2013, pp. 106–111.
[3] D. Martin, C. Fowlkes, D. Tal, and J. Malik, “A database of human segmented natural images and its
application to evaluating segmentation algorithms and measuring ecological statistics,” in Proc. 8th
Int’l Conf. Computer Vision, July 2001, vol. 2, pp. 416–423.
[4] Christopher Haccius and Thorsten Herfet, “An image database for design and evaluation of visual
quality metrics in synthetic scenarios,” in International Conference on Image Analysis and
Recognition, ICIAR, Póvoa de Varzim, Portugal. IEEE, July 2016.
[5] Christopher Haccius, “SSID - saarbru¨cken synthetic image database,” http://ssid.nt.uni-saarland.de/,
Apr. 2016, Accessed: 2016-06-14.
[6] Radhakrishna Achanta, Appu Shaji, Kevin Smith, Aurelien Lucchi, Pascal Fua, and Sabine Susstrunk,
“Slic superpixels compared to state-of-the-art superpixel methods,” Pattern Analysis and Machine
Intelligence, IEEE Transactions on, vol. 34, no. 11, pp. 2274–2282, 2012.
[7] Berthold K Horn and Brian G Schunck, “Determining optical flow,” in 1981 Technical symposium
east. International Society for Optics and Photonics, 1981, pp. 319–331.
[8] David G Lowe, “Object recognition from local scale-invariant features,” in Computer vision, 1999.
The proceedings of the seventh IEEE international conference on. Ieee, 1999, vol. 2, pp. 1150–1157.
[9] Herbert Bay, Tinne Tuytelaars, and Luc Van Gool, “Surf: Speeded up robust features,” in Computer
vision–ECCV 2006, pp. 404–417. Springer, 2006.
[10] Zhou Wang, Hamid R Sheikh, and Alan C Bovik, “No-reference perceptual quality assessment of
JPEG compressed images,” in Image Processing. 2002. Proceedings. 2002 International Conference
on. IEEE, 2002, vol. 1, pp. I–477.
[11] Zhou Wang, Alan C Bovik, Hamid R Sheikh, and Eero P Simoncelli, “Image quality assessment:
from error visibility to structural similarity,” Image Processing, IEEE Transactions on, vol. 13, pp.
600–612, 2004.
[12] Charles Spearman, “The proof and measurement of association between two things,” The American
journal of psychology, vol. 15, no. 1, pp. 72–101, 1904.
[13] Kalpana Seshadrinathan, Jorge E Caviedes, Audrey C Younkin, and Philip J Corriveau, “Visual
quality management in consumer video r&d,” in International Workshop on Video Processing and
Quality Metrics (VPQM), 2010.
[14] Christopher Haccius and Thorsten Herfet, “SC-VQM - a visual quality metric for synthetic contents,”
in Picture Coding Symposium, PCS, Nuremberg, Germany (submitted to). IEEE, Dec. 2016.
[15] George Wolberg and Siavash Zokai, “Robust image registration using log-polar transform,” in Image
Processing, 2000. Proceedings. 2000 International Conference on. IEEE, 2000, vol. 1, pp. 493–496.](https://image.slidesharecdn.com/csit76304-170107085142/85/COMPUTER-VISION-PERFORMANCE-AND-IMAGE-QUALITY-METRICS-A-RECIPROCAL-RELATION-10-320.jpg)