Downloaded 170 times
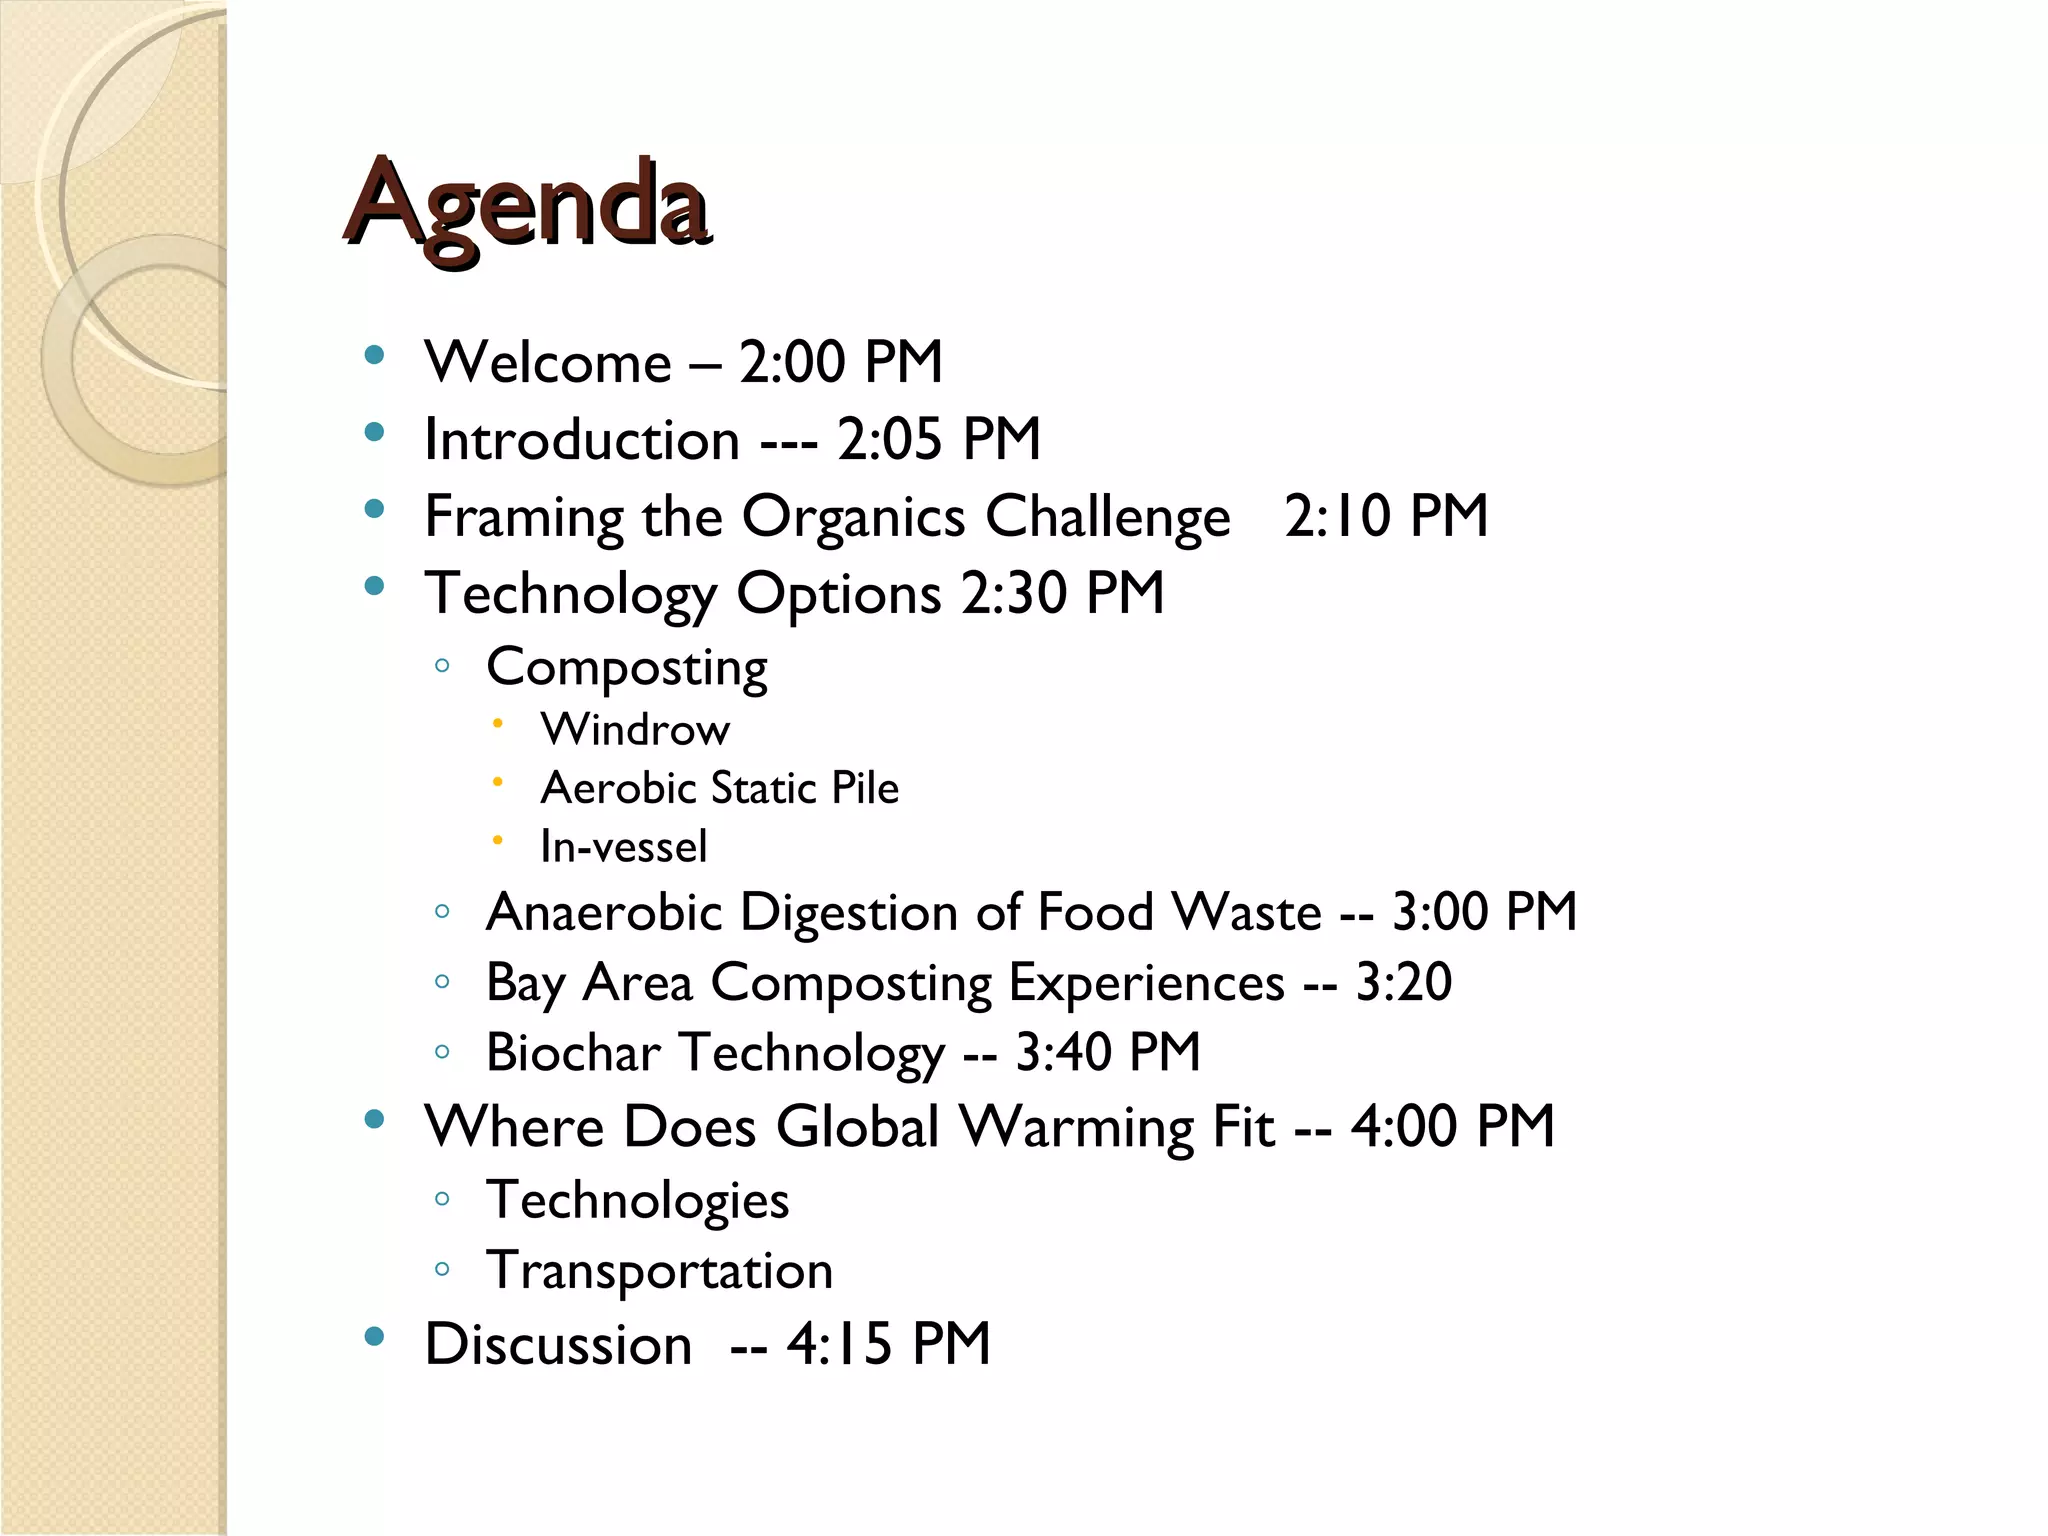
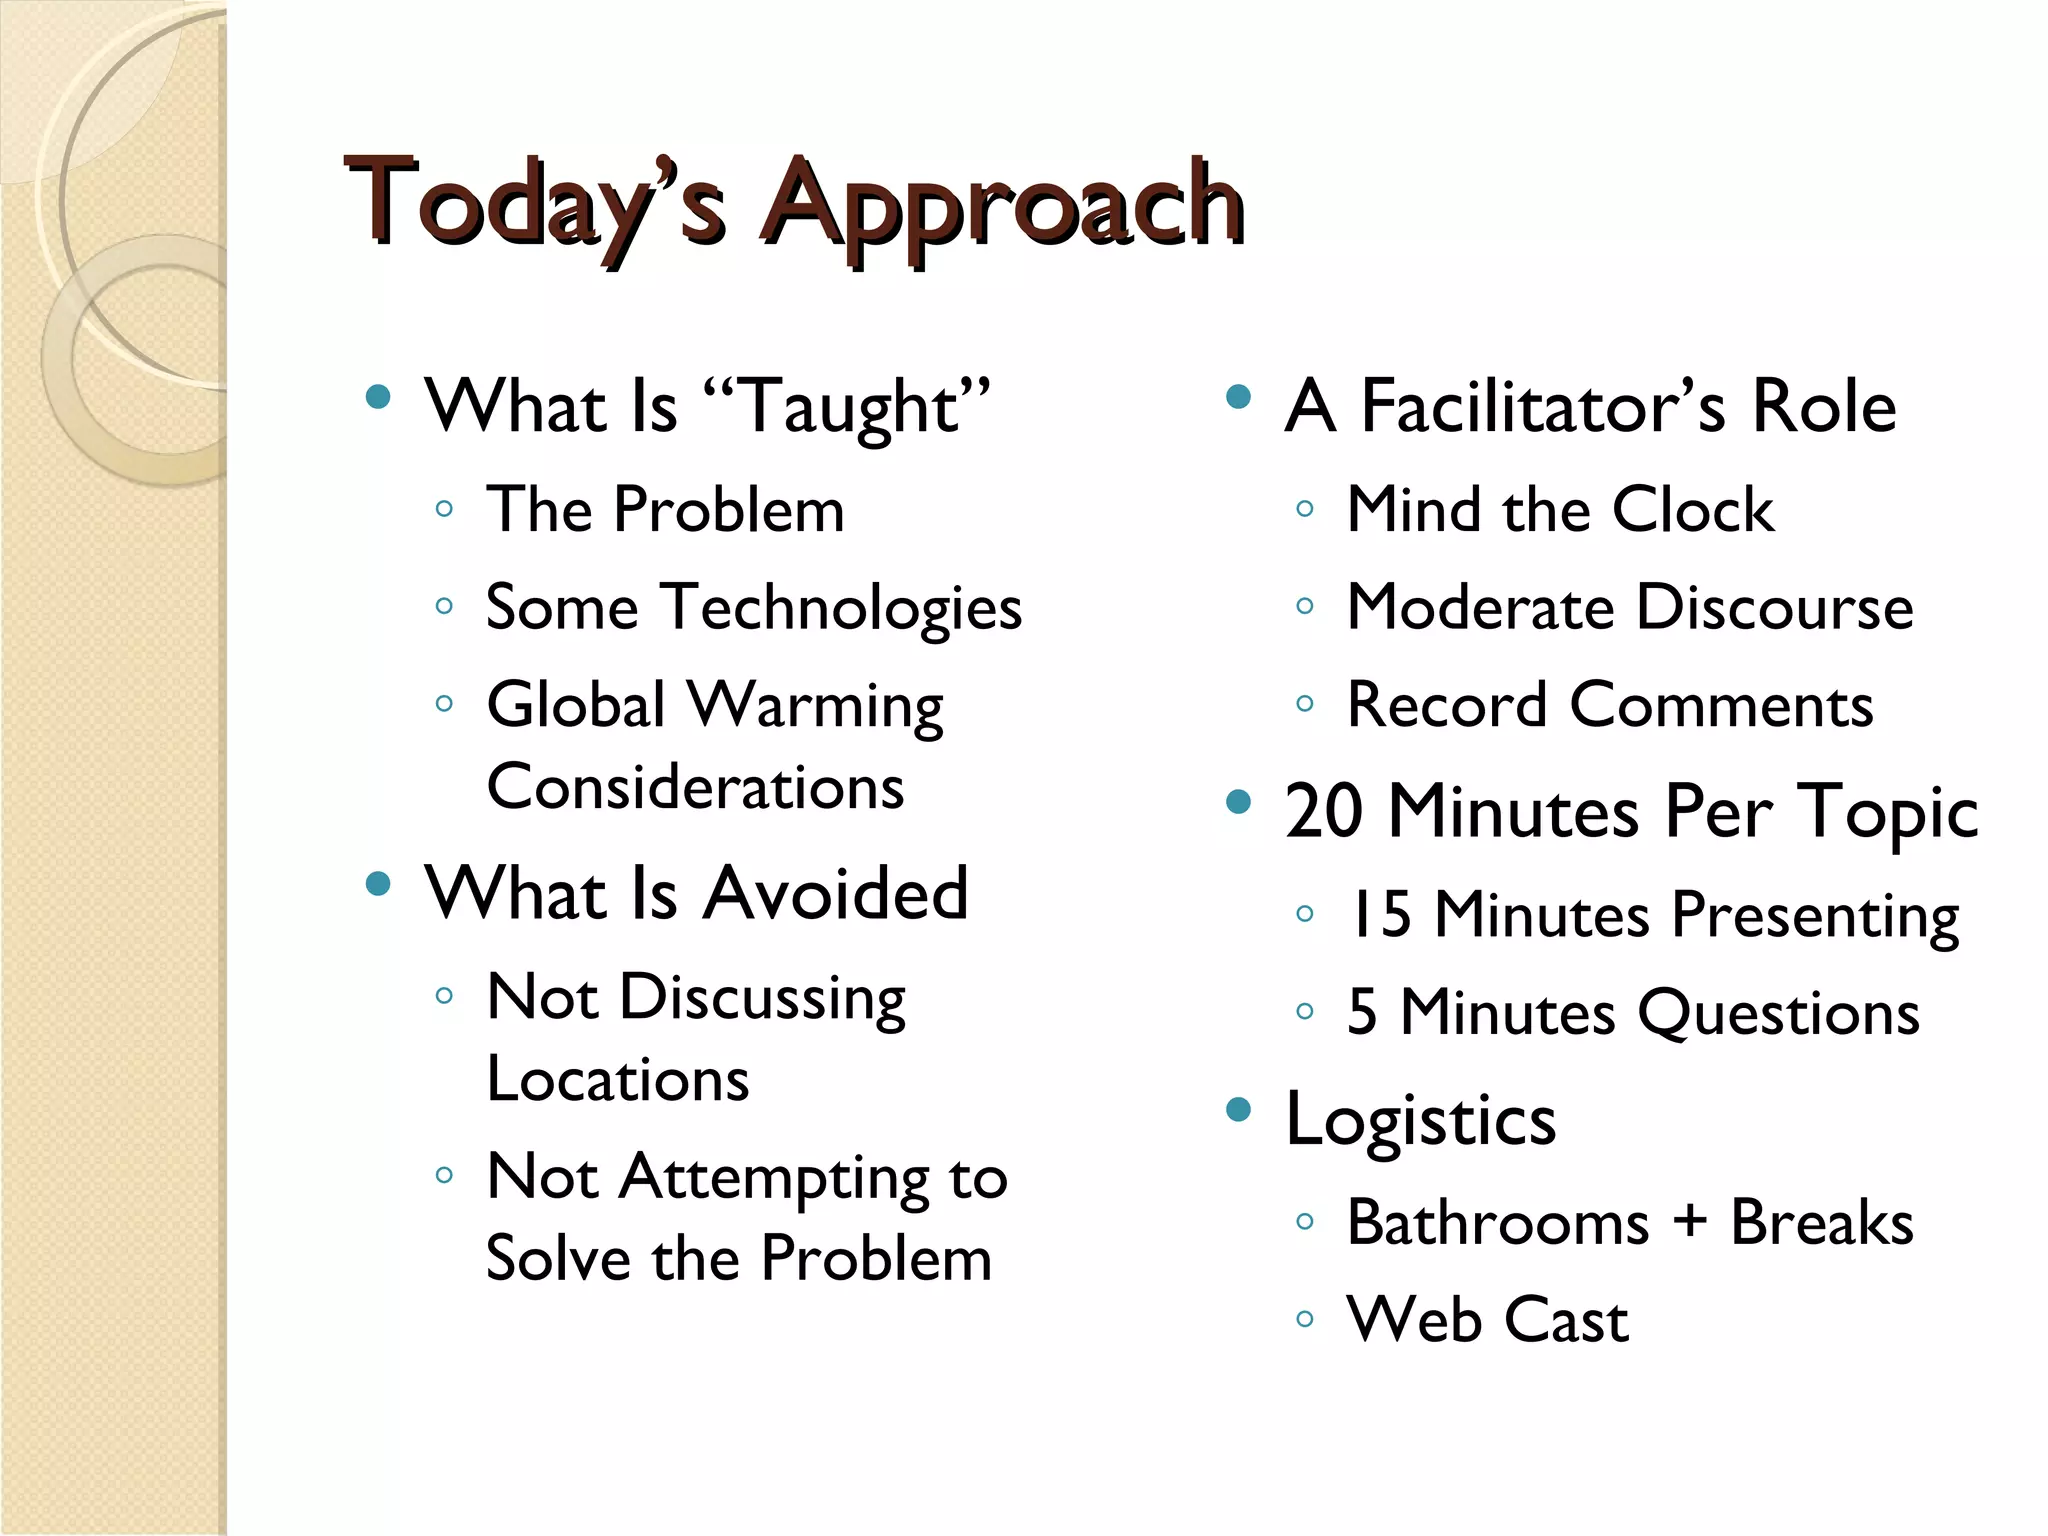

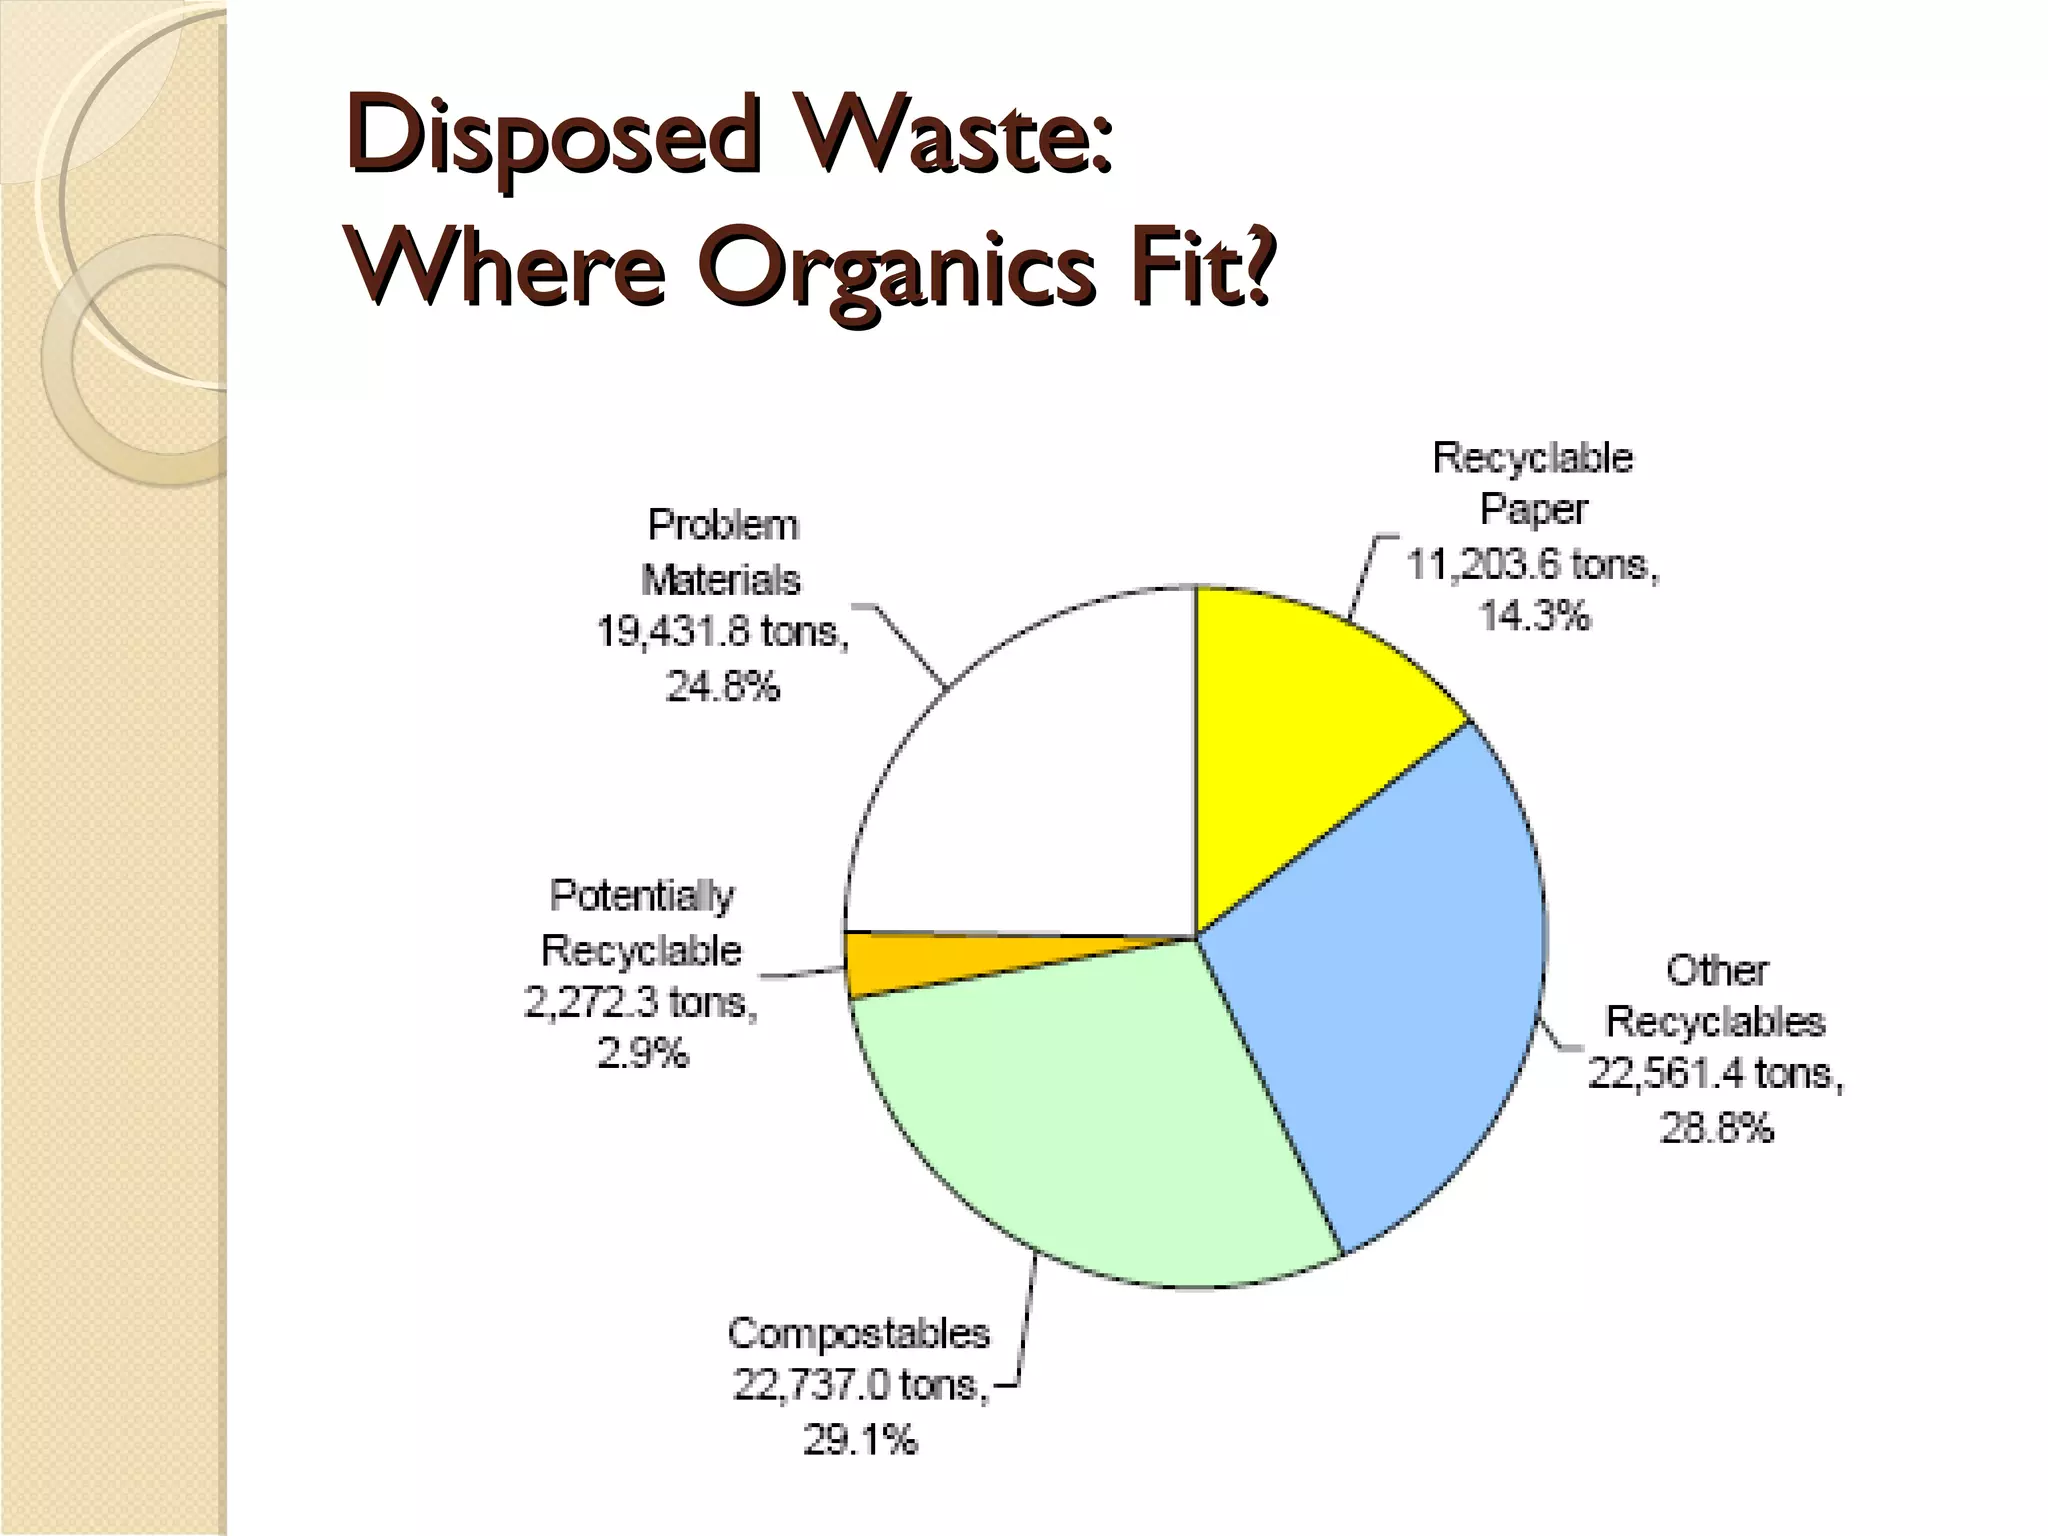
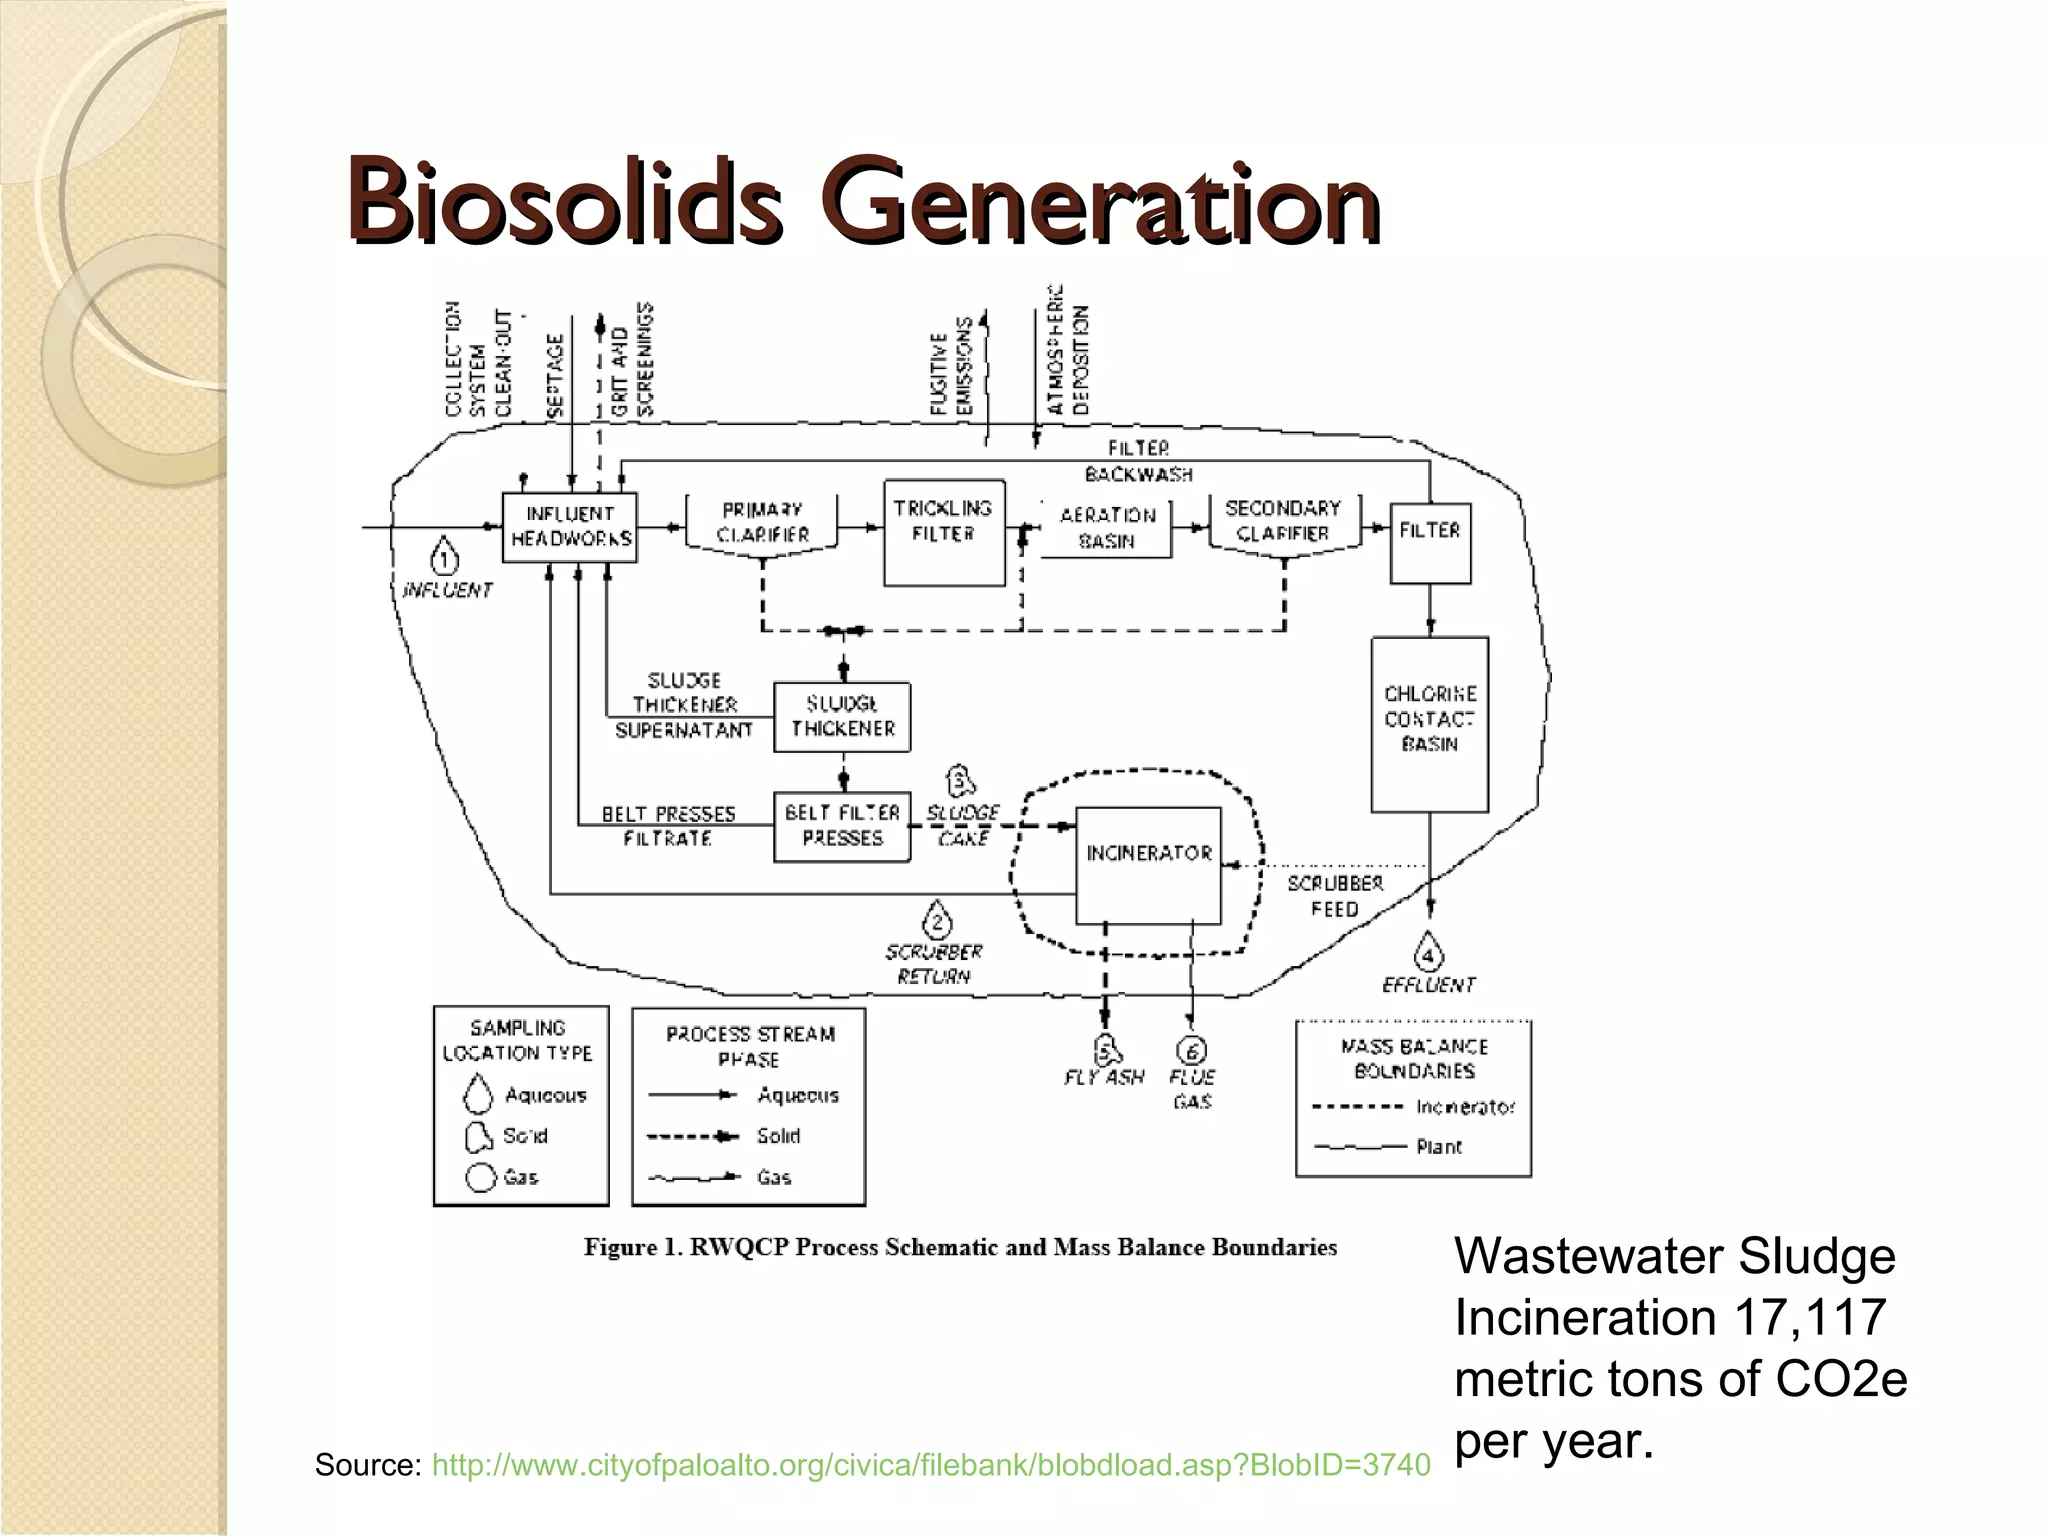
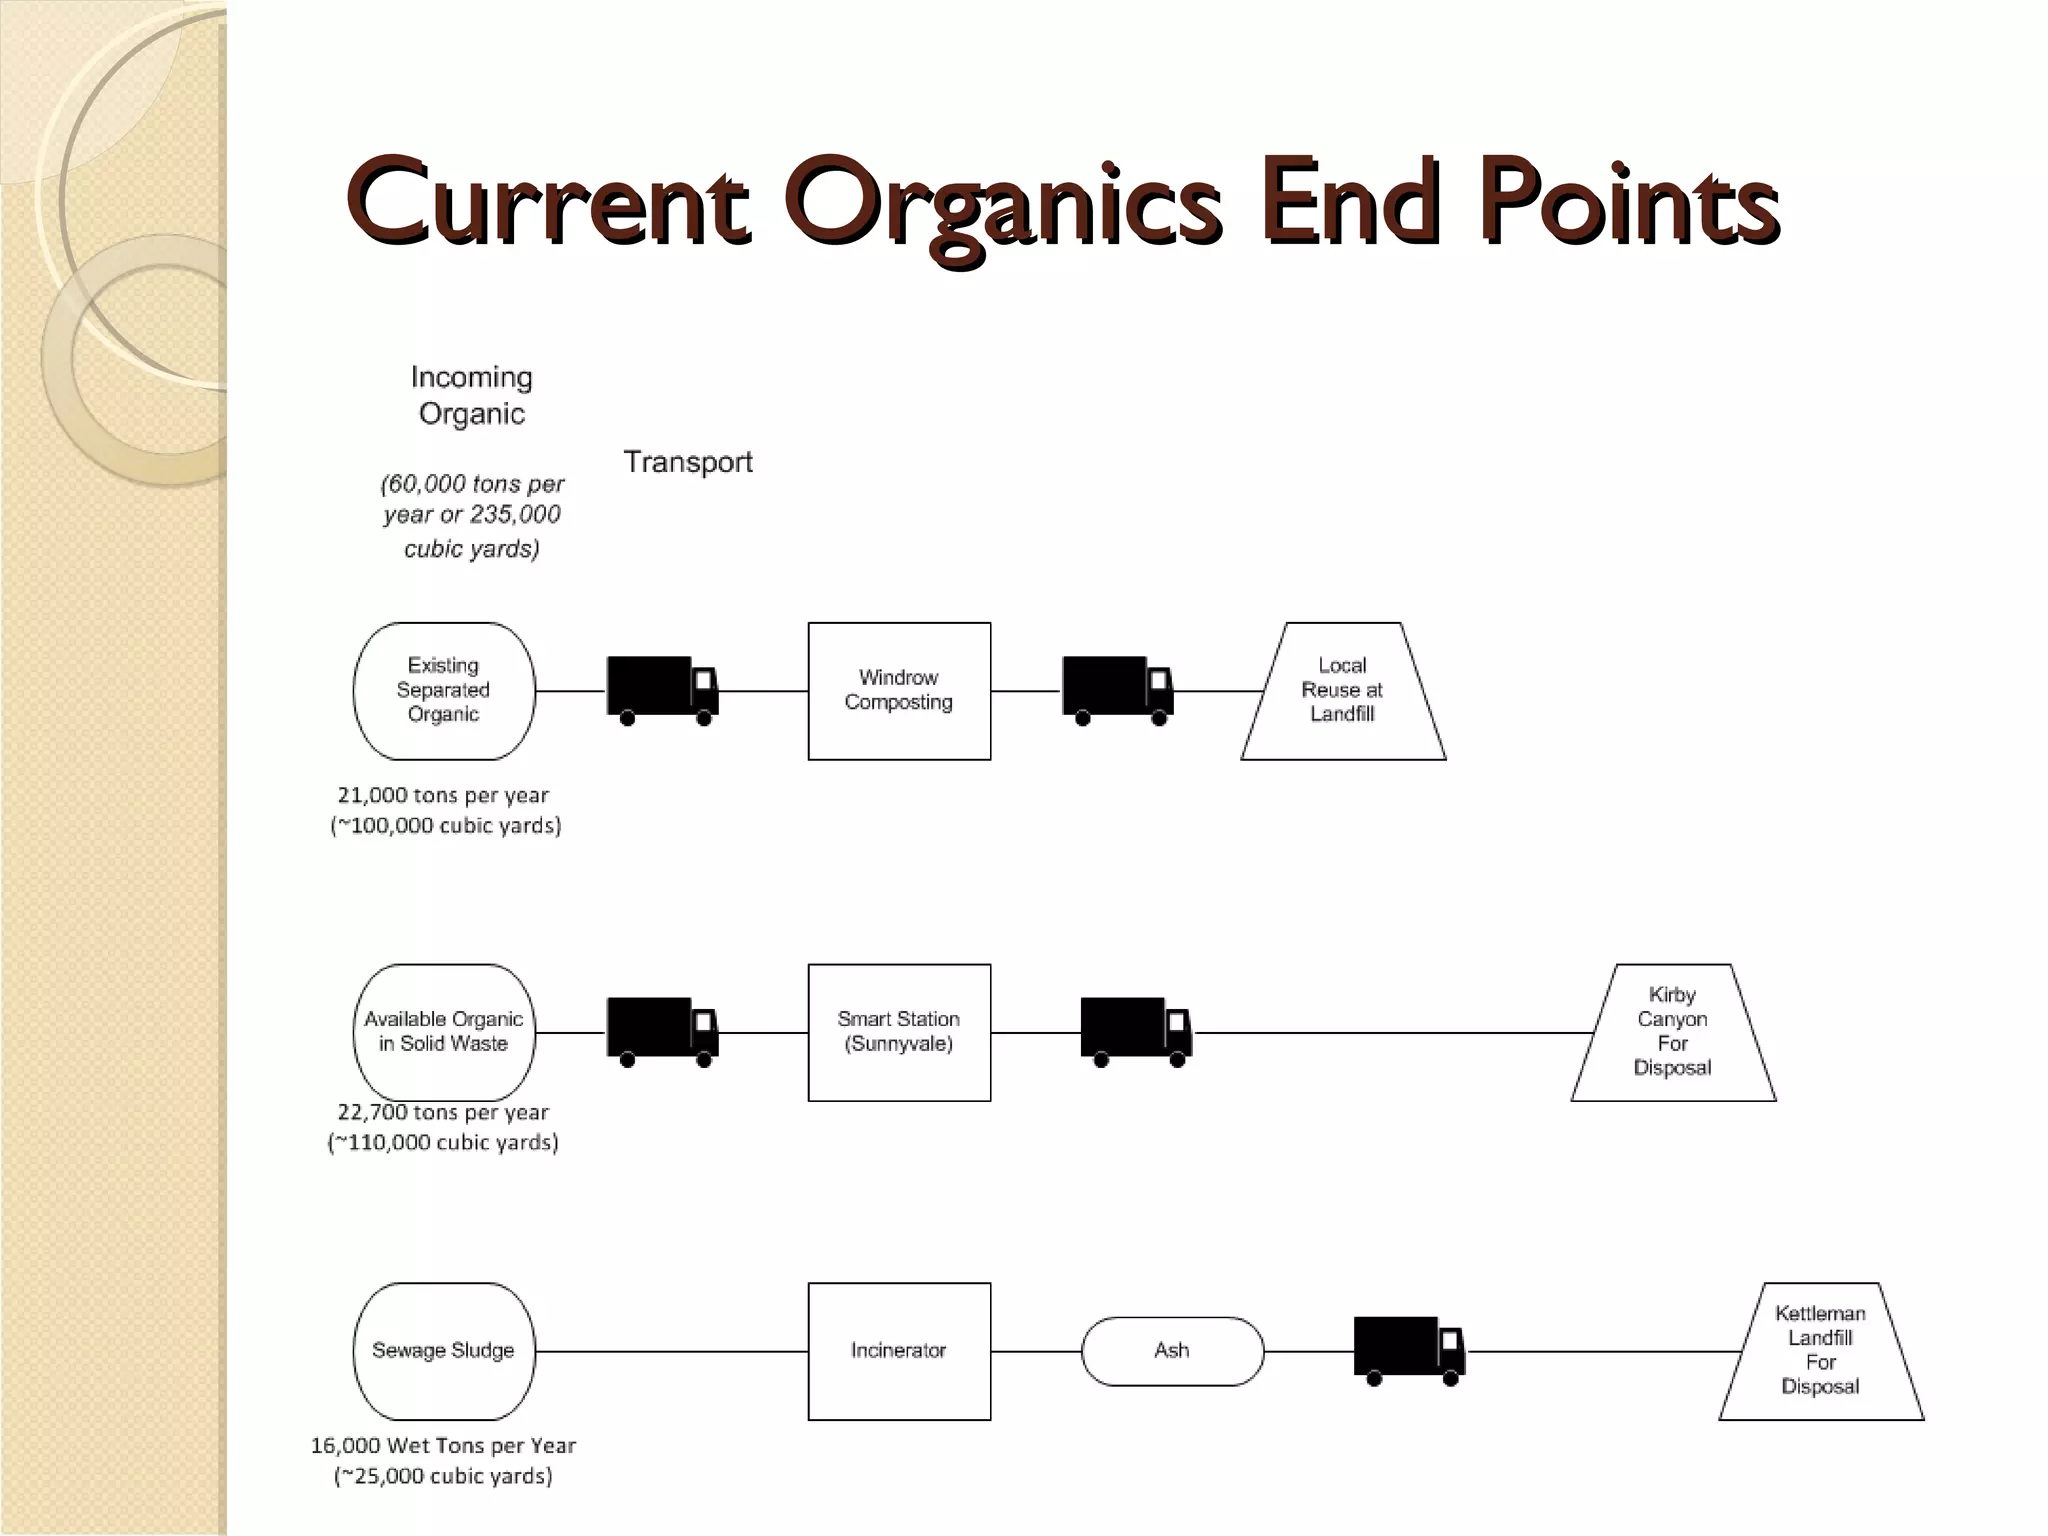
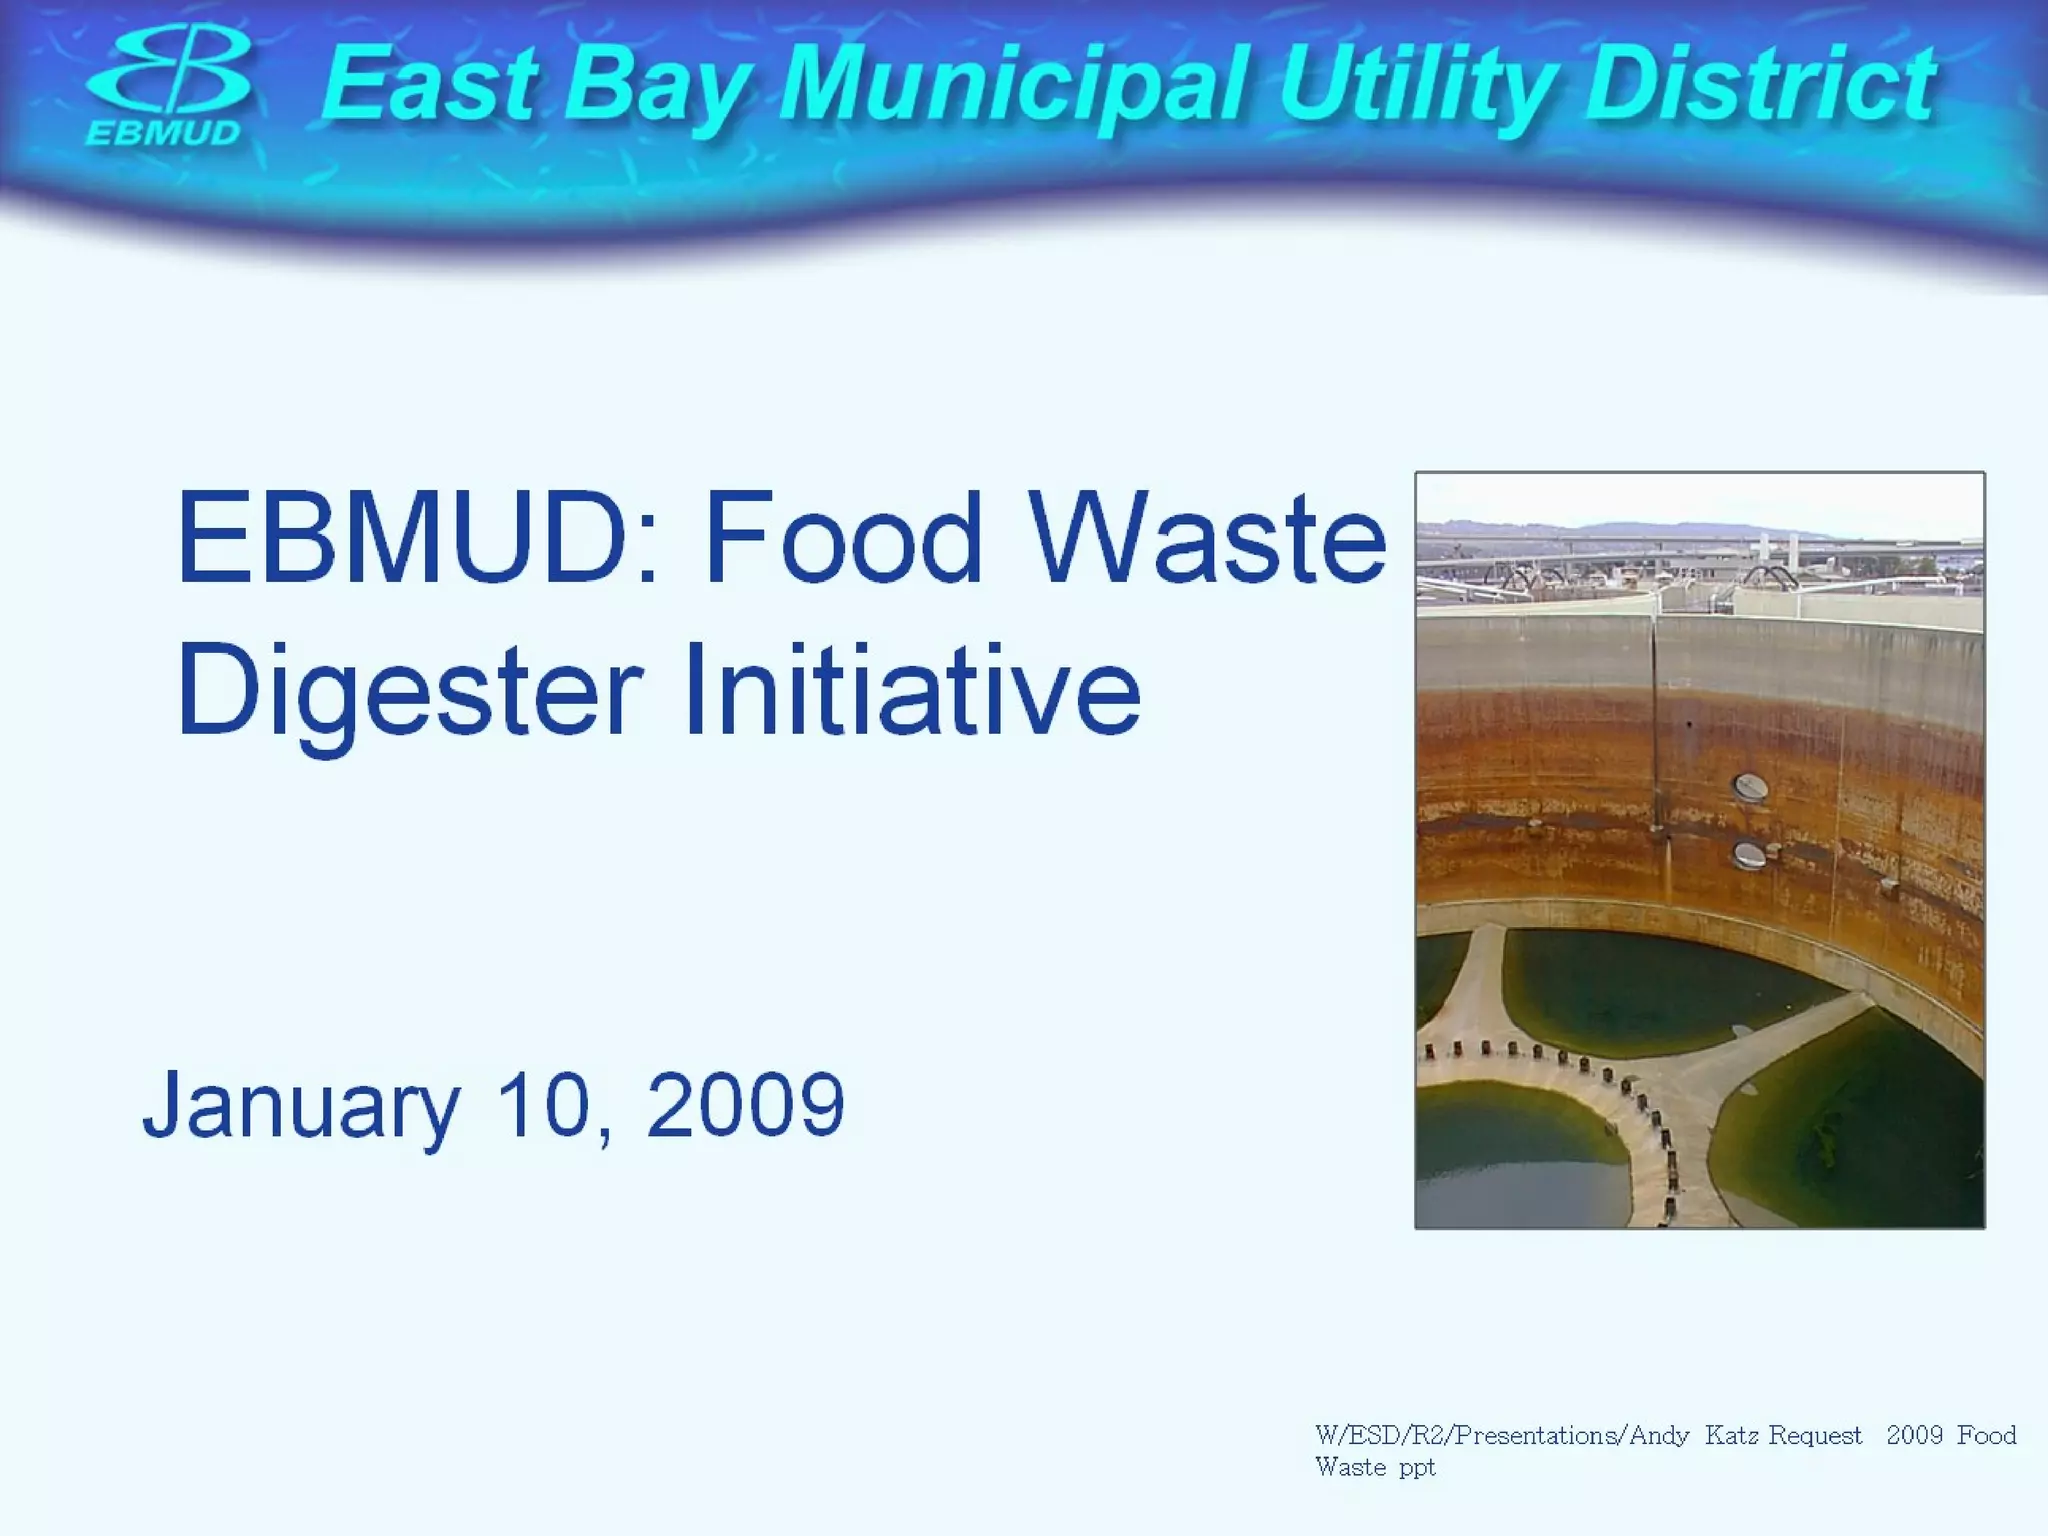
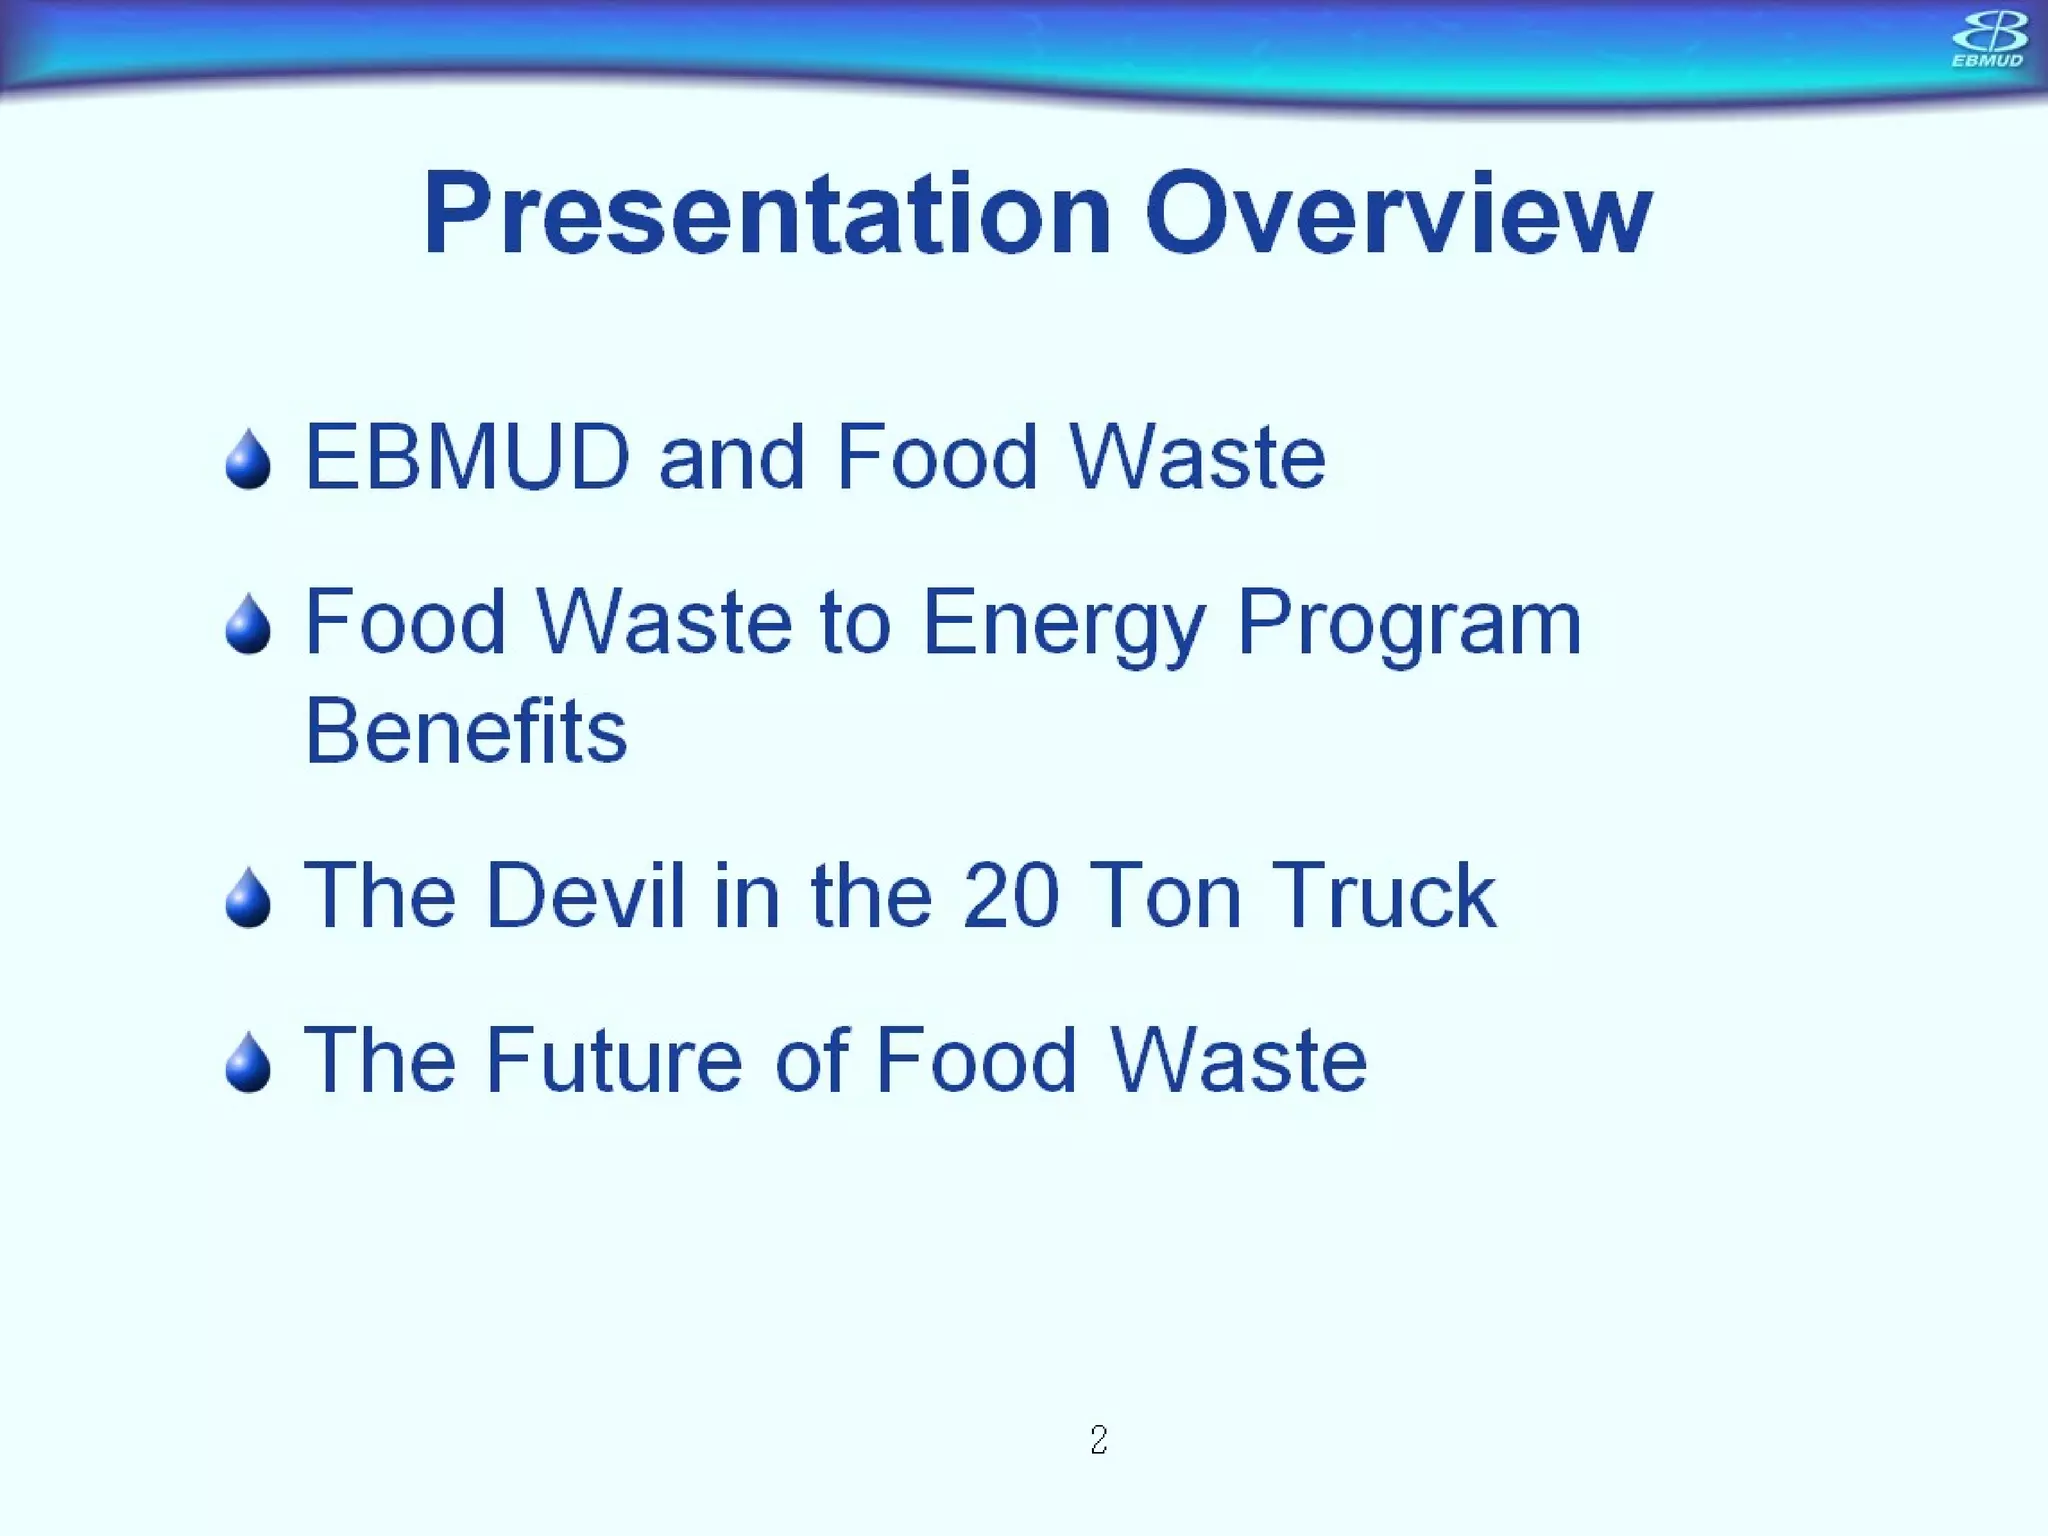
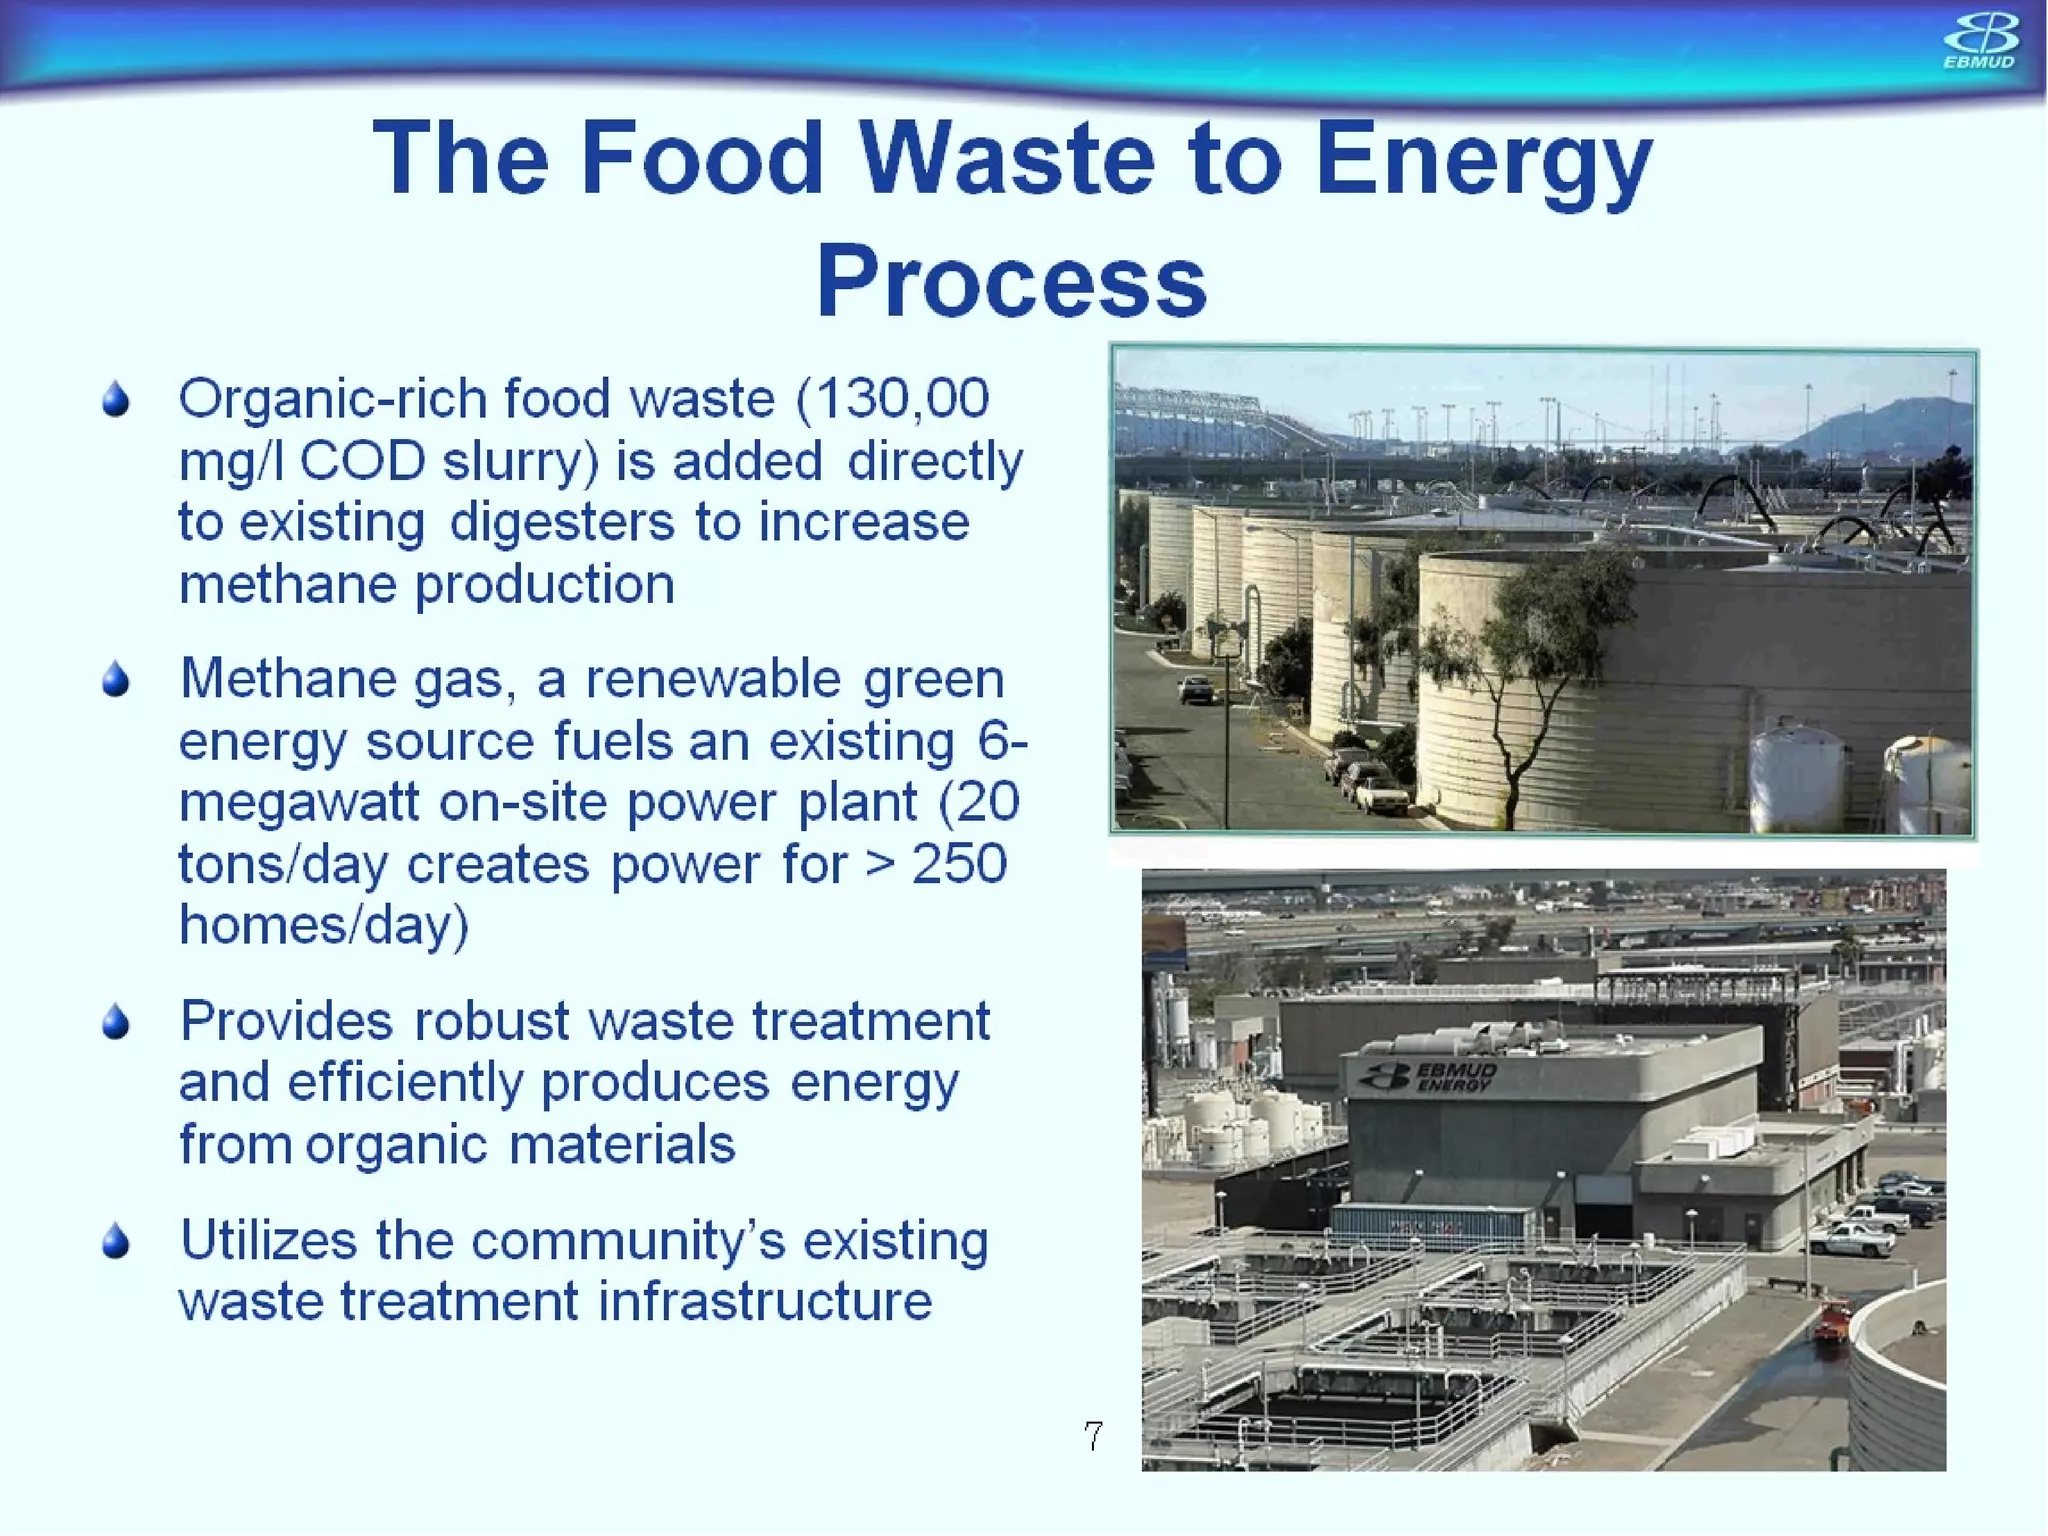
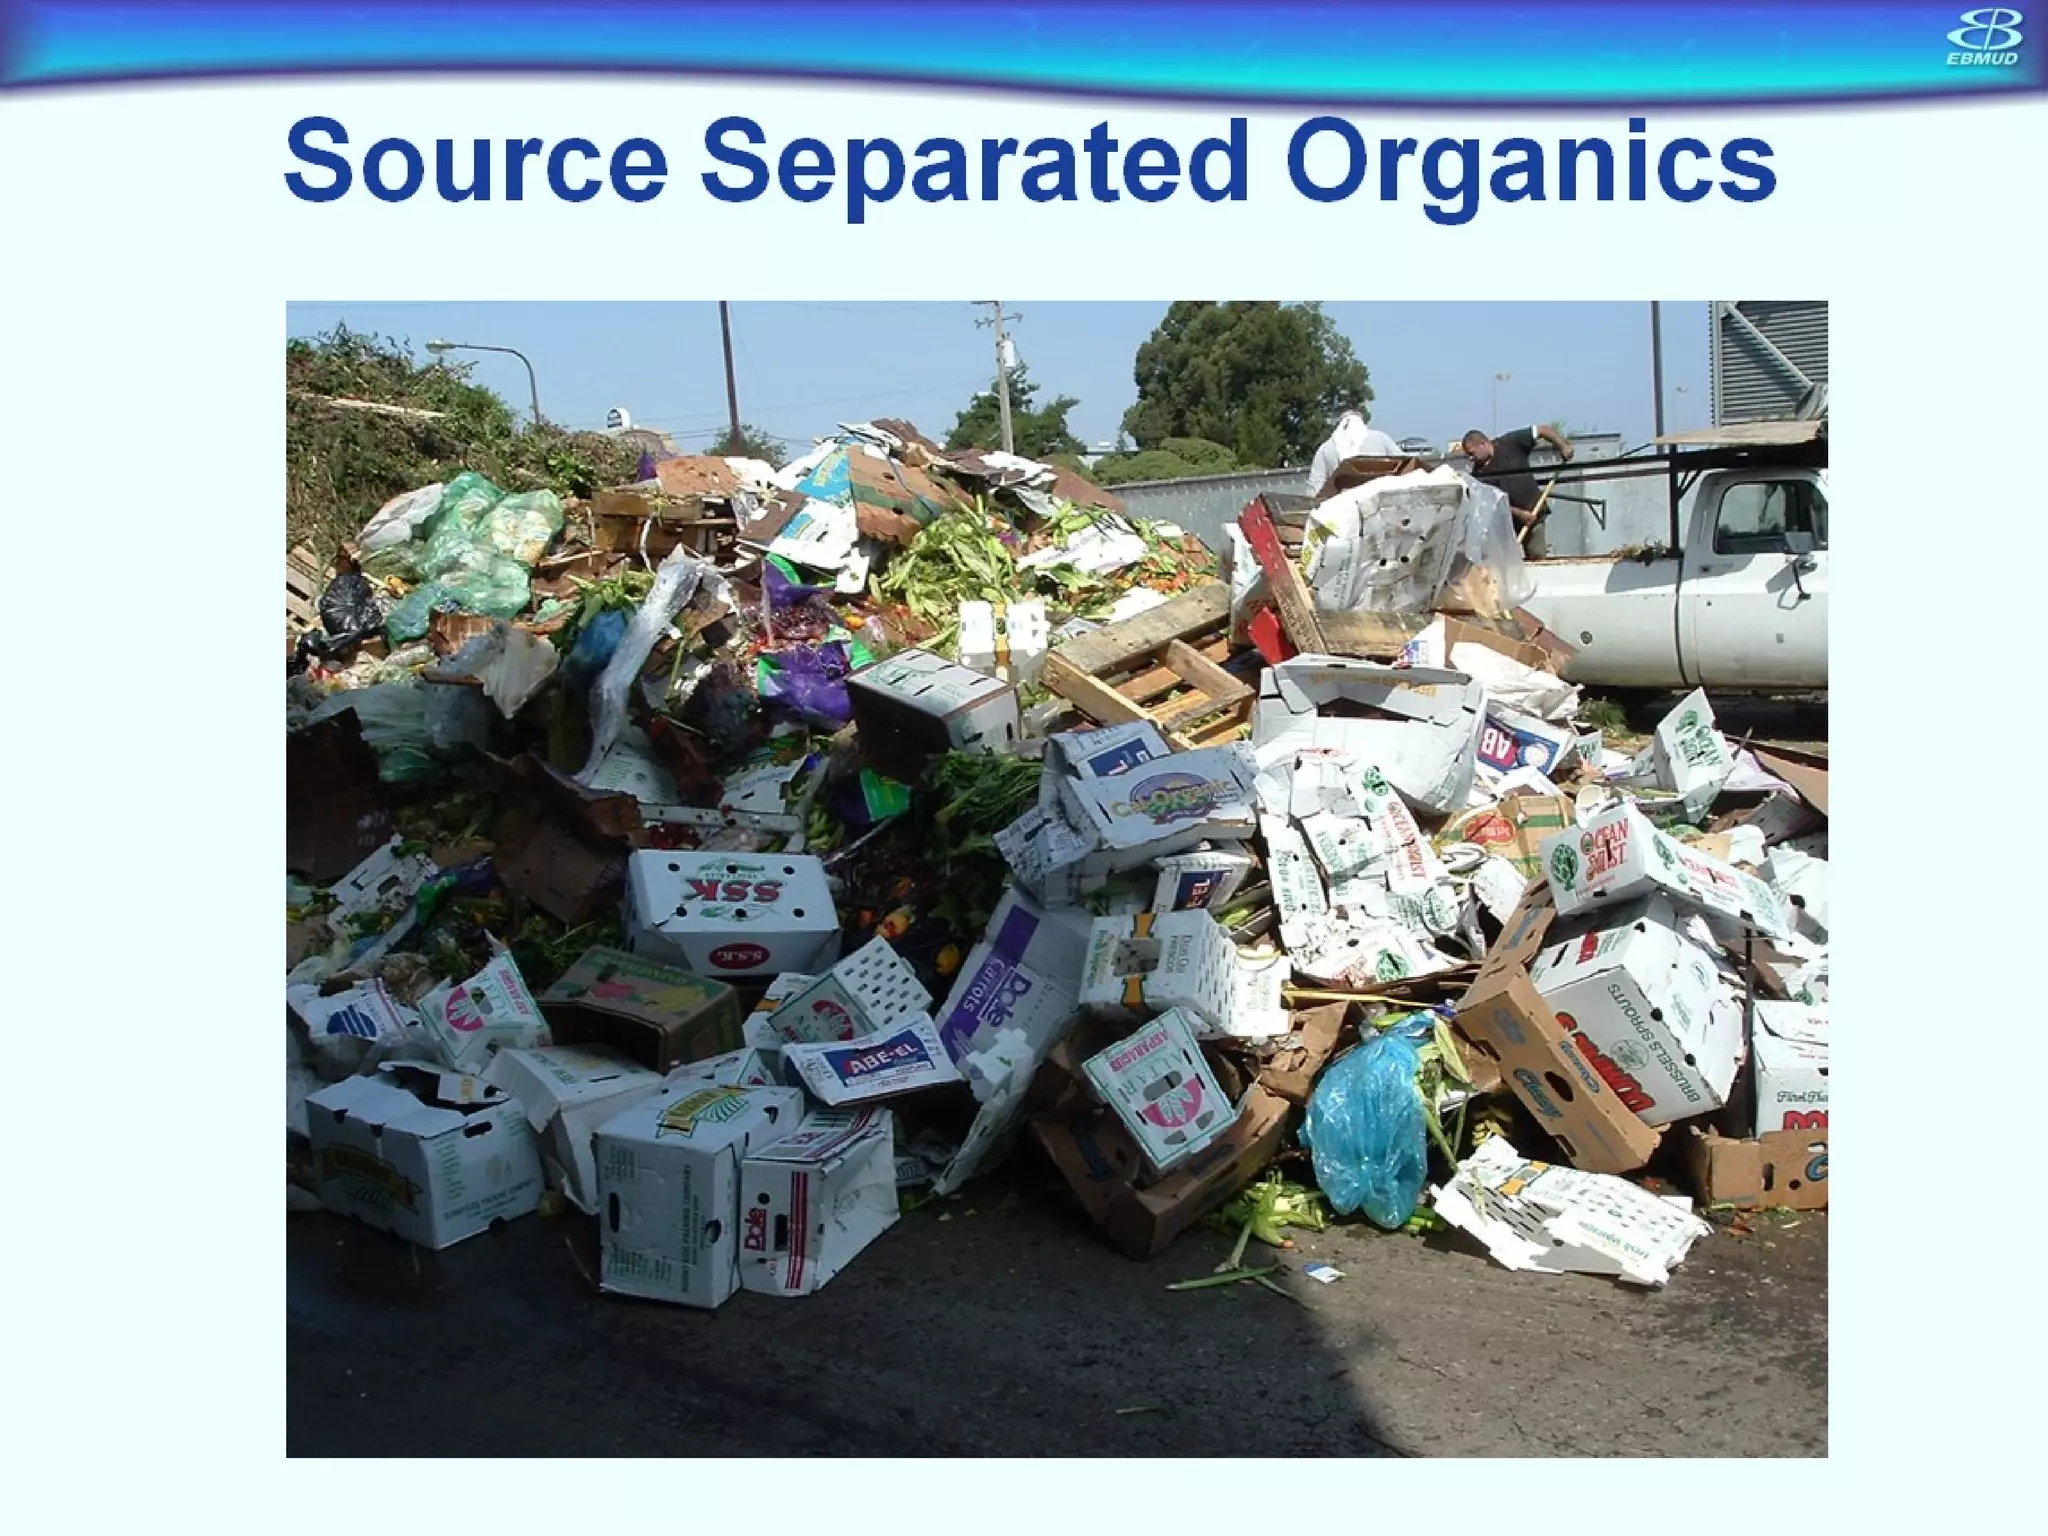
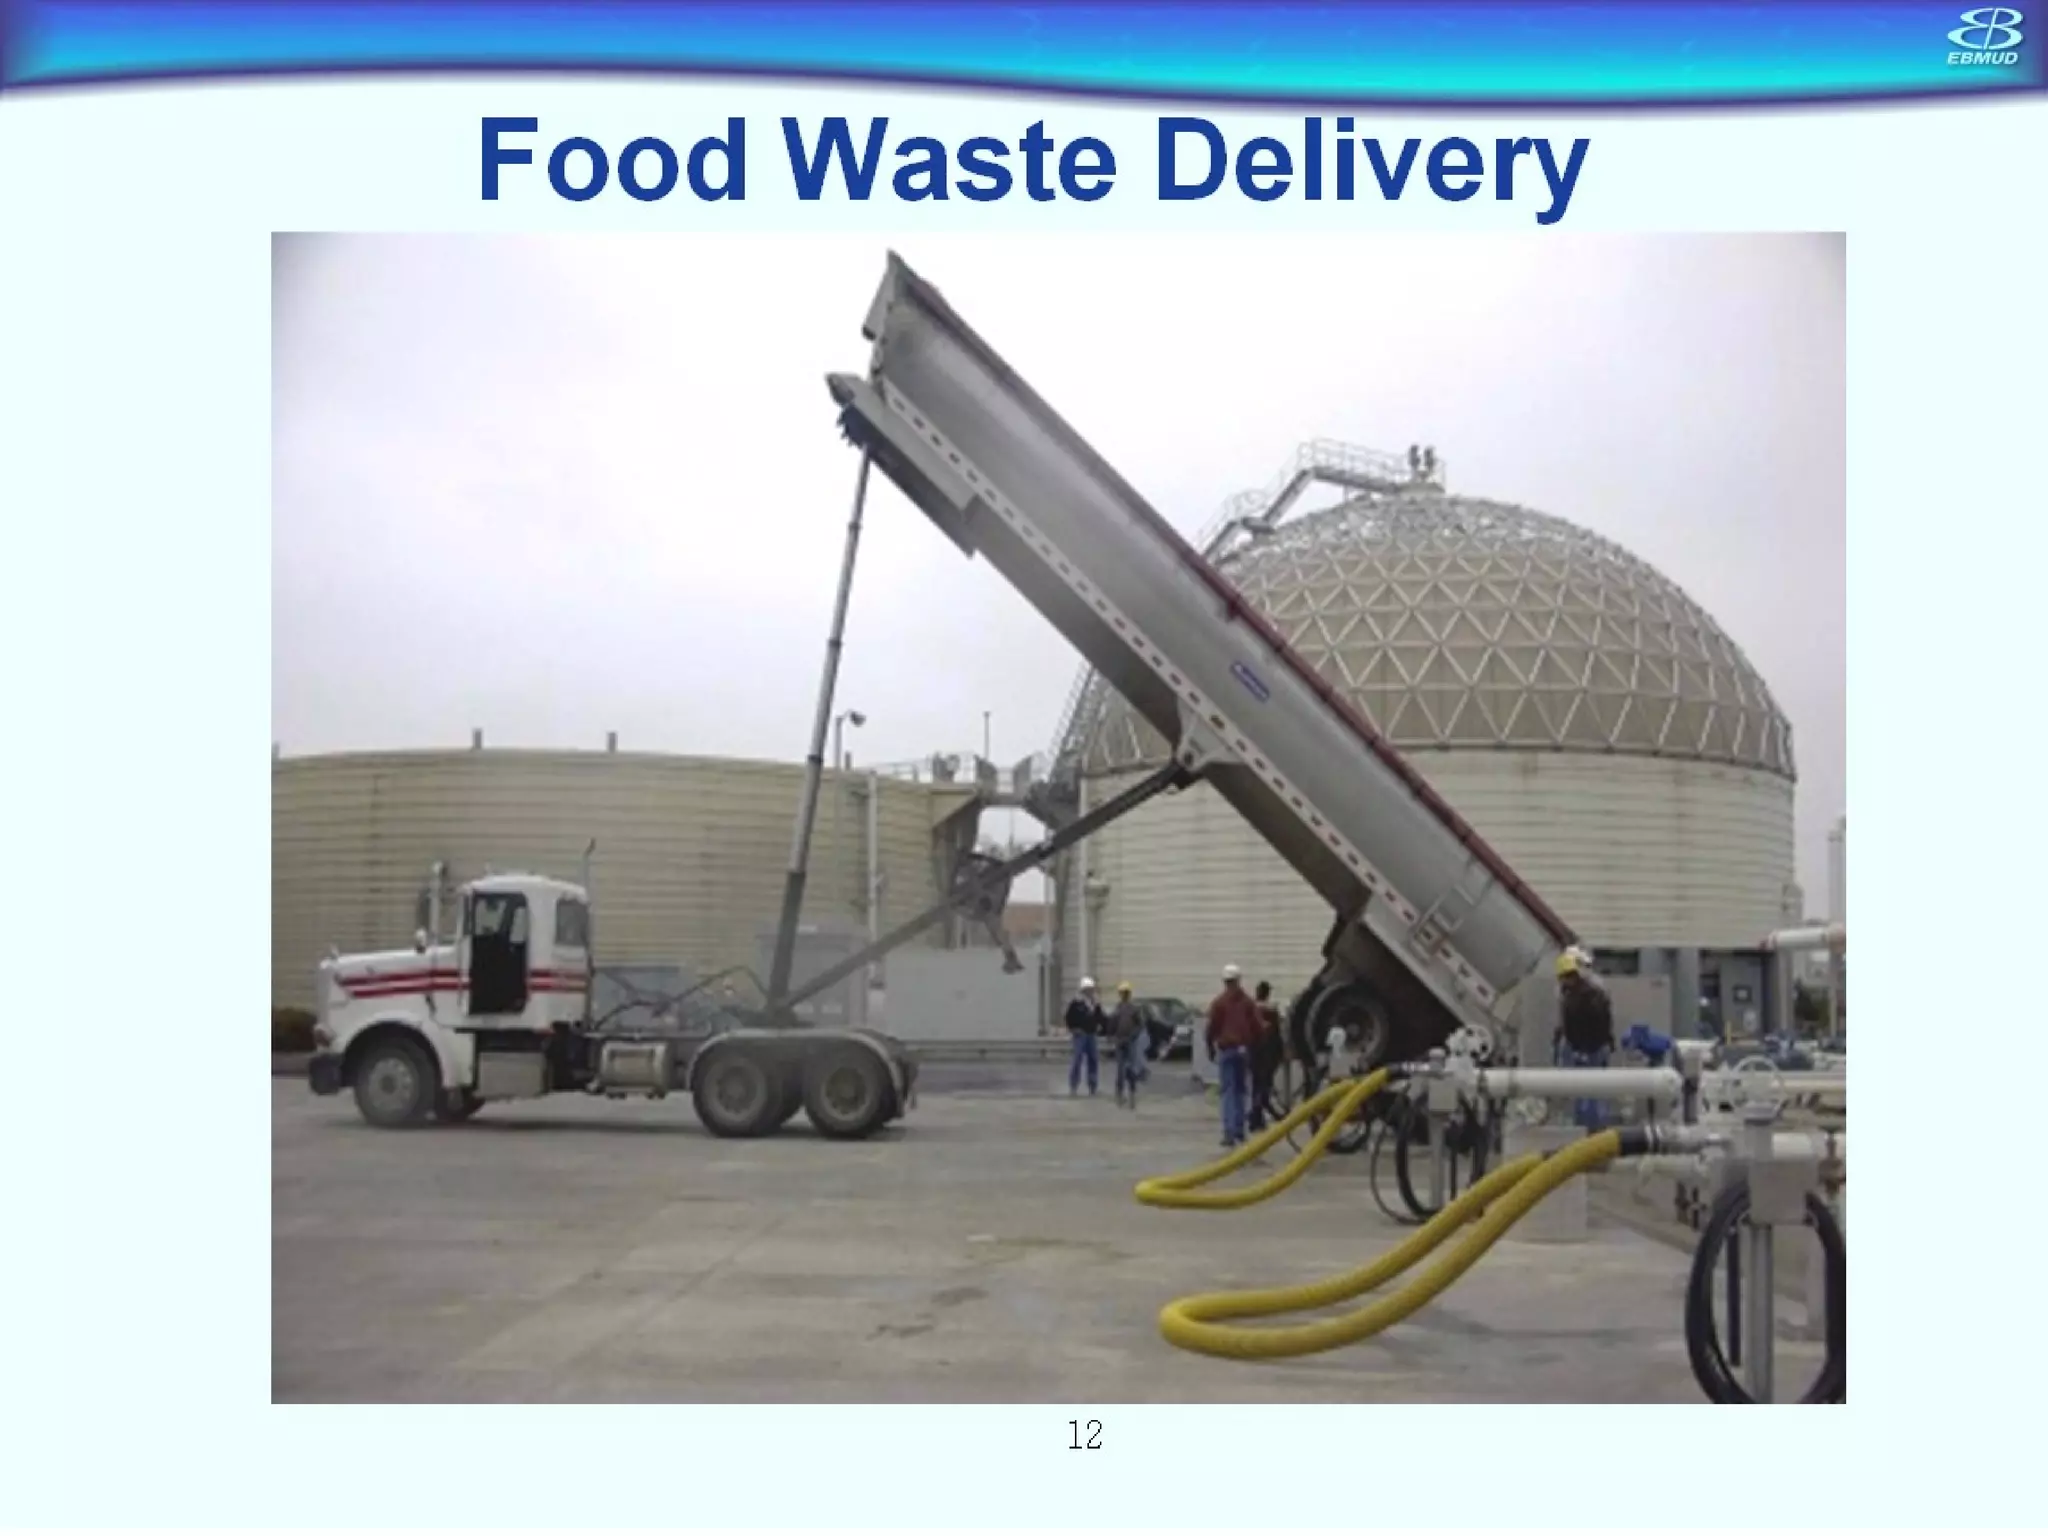
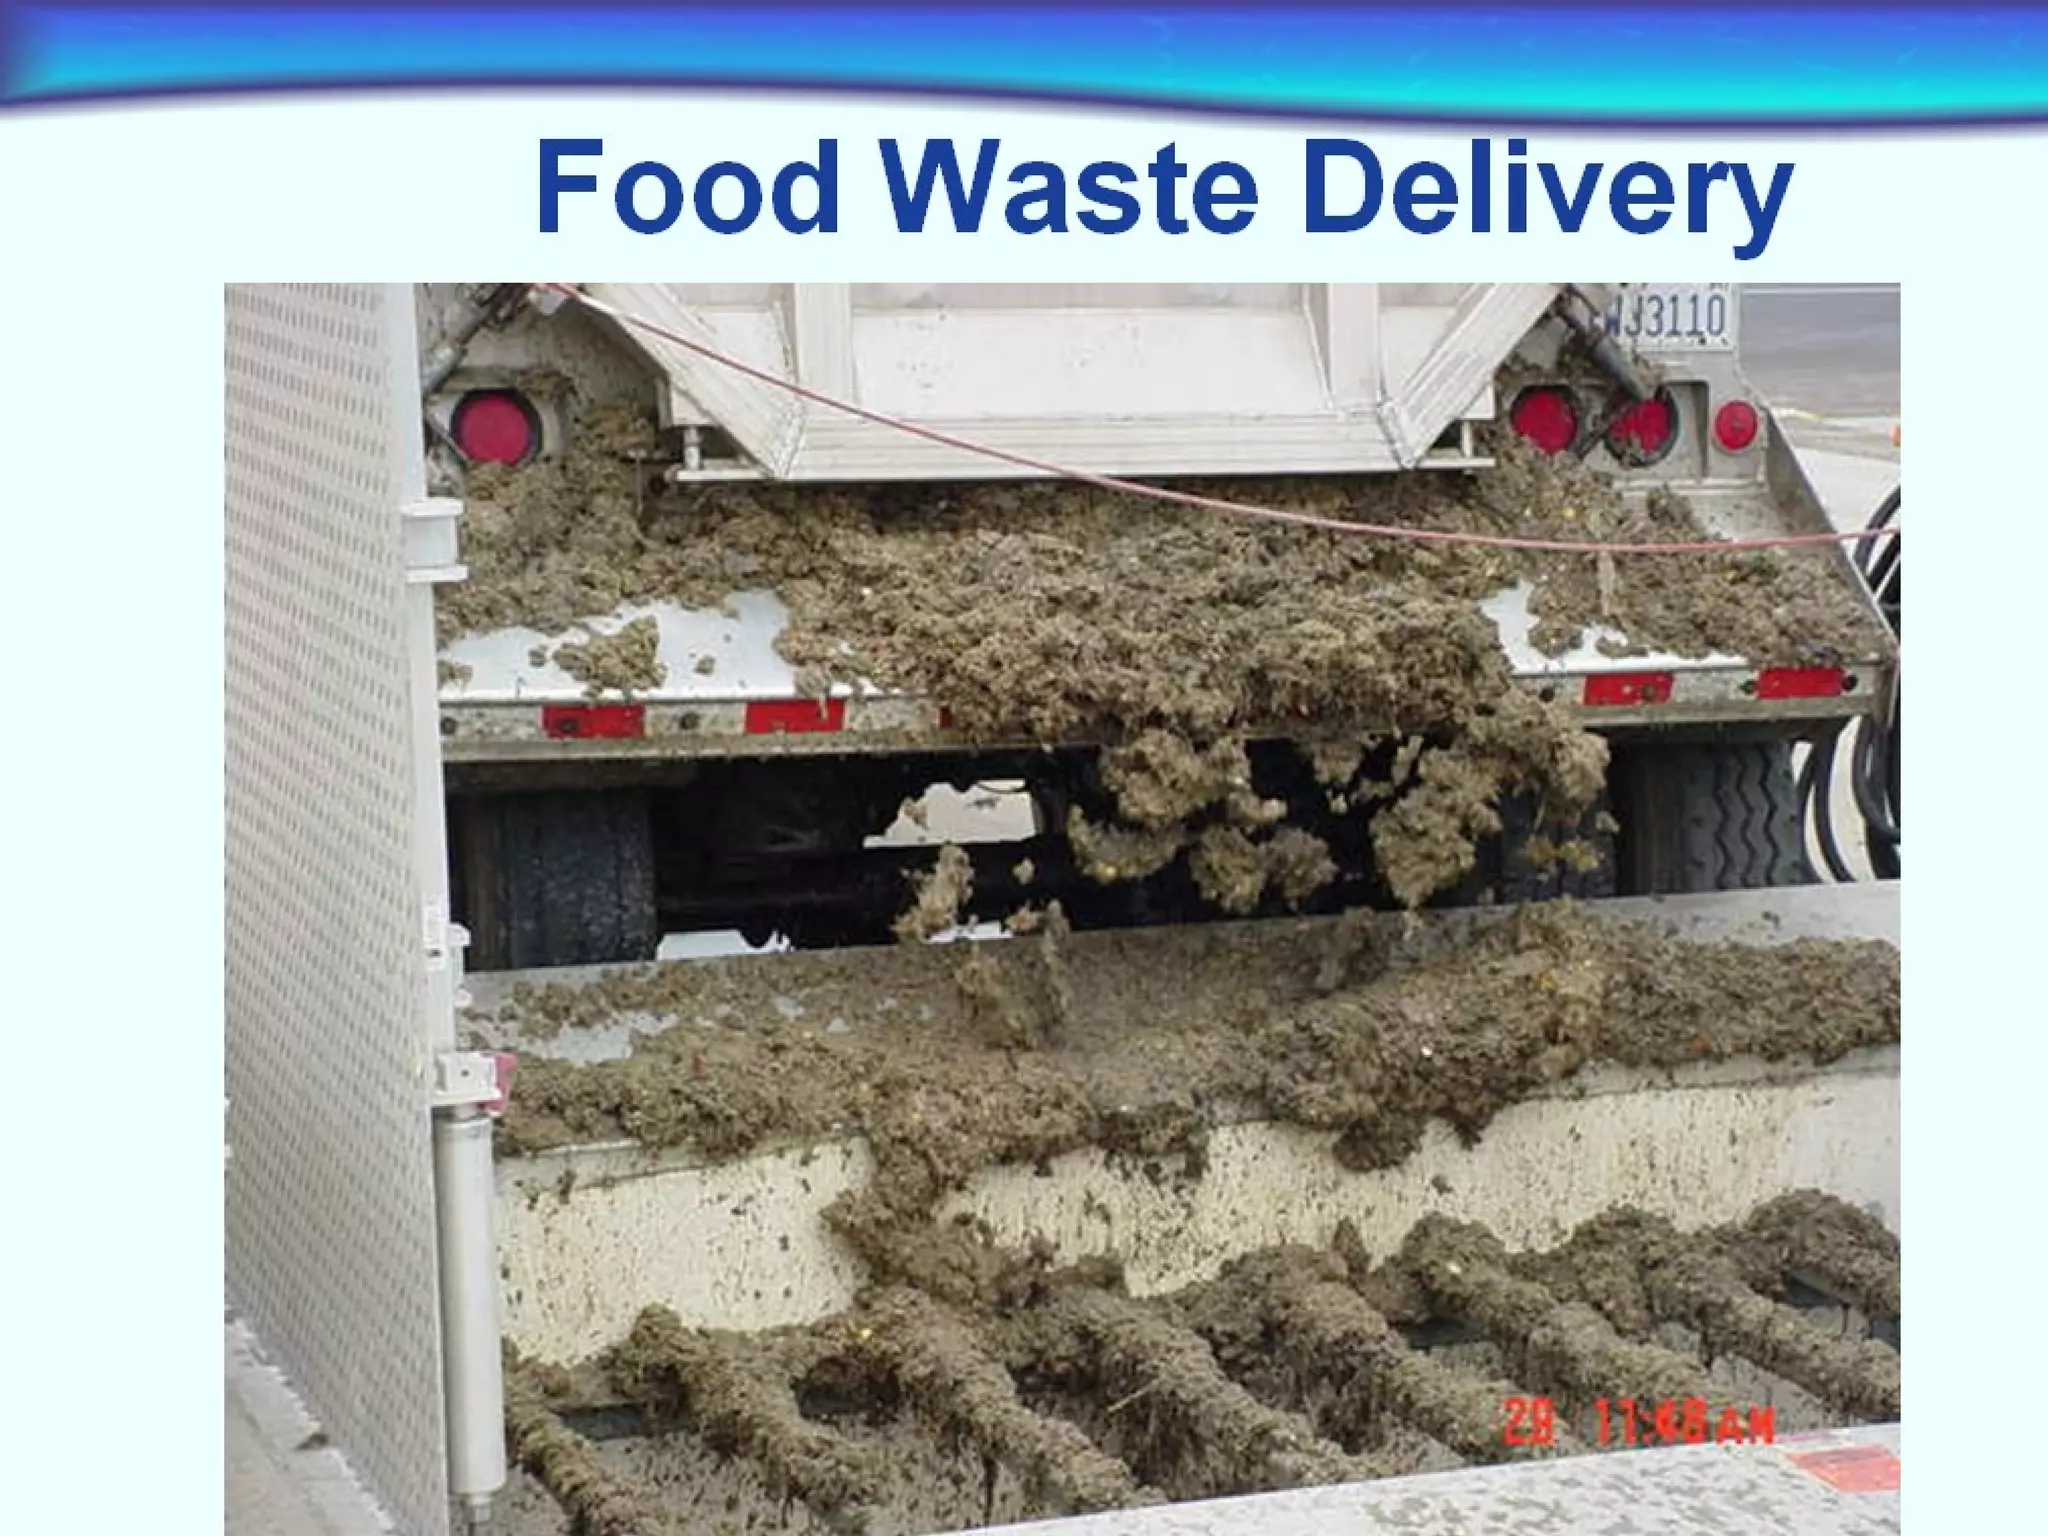
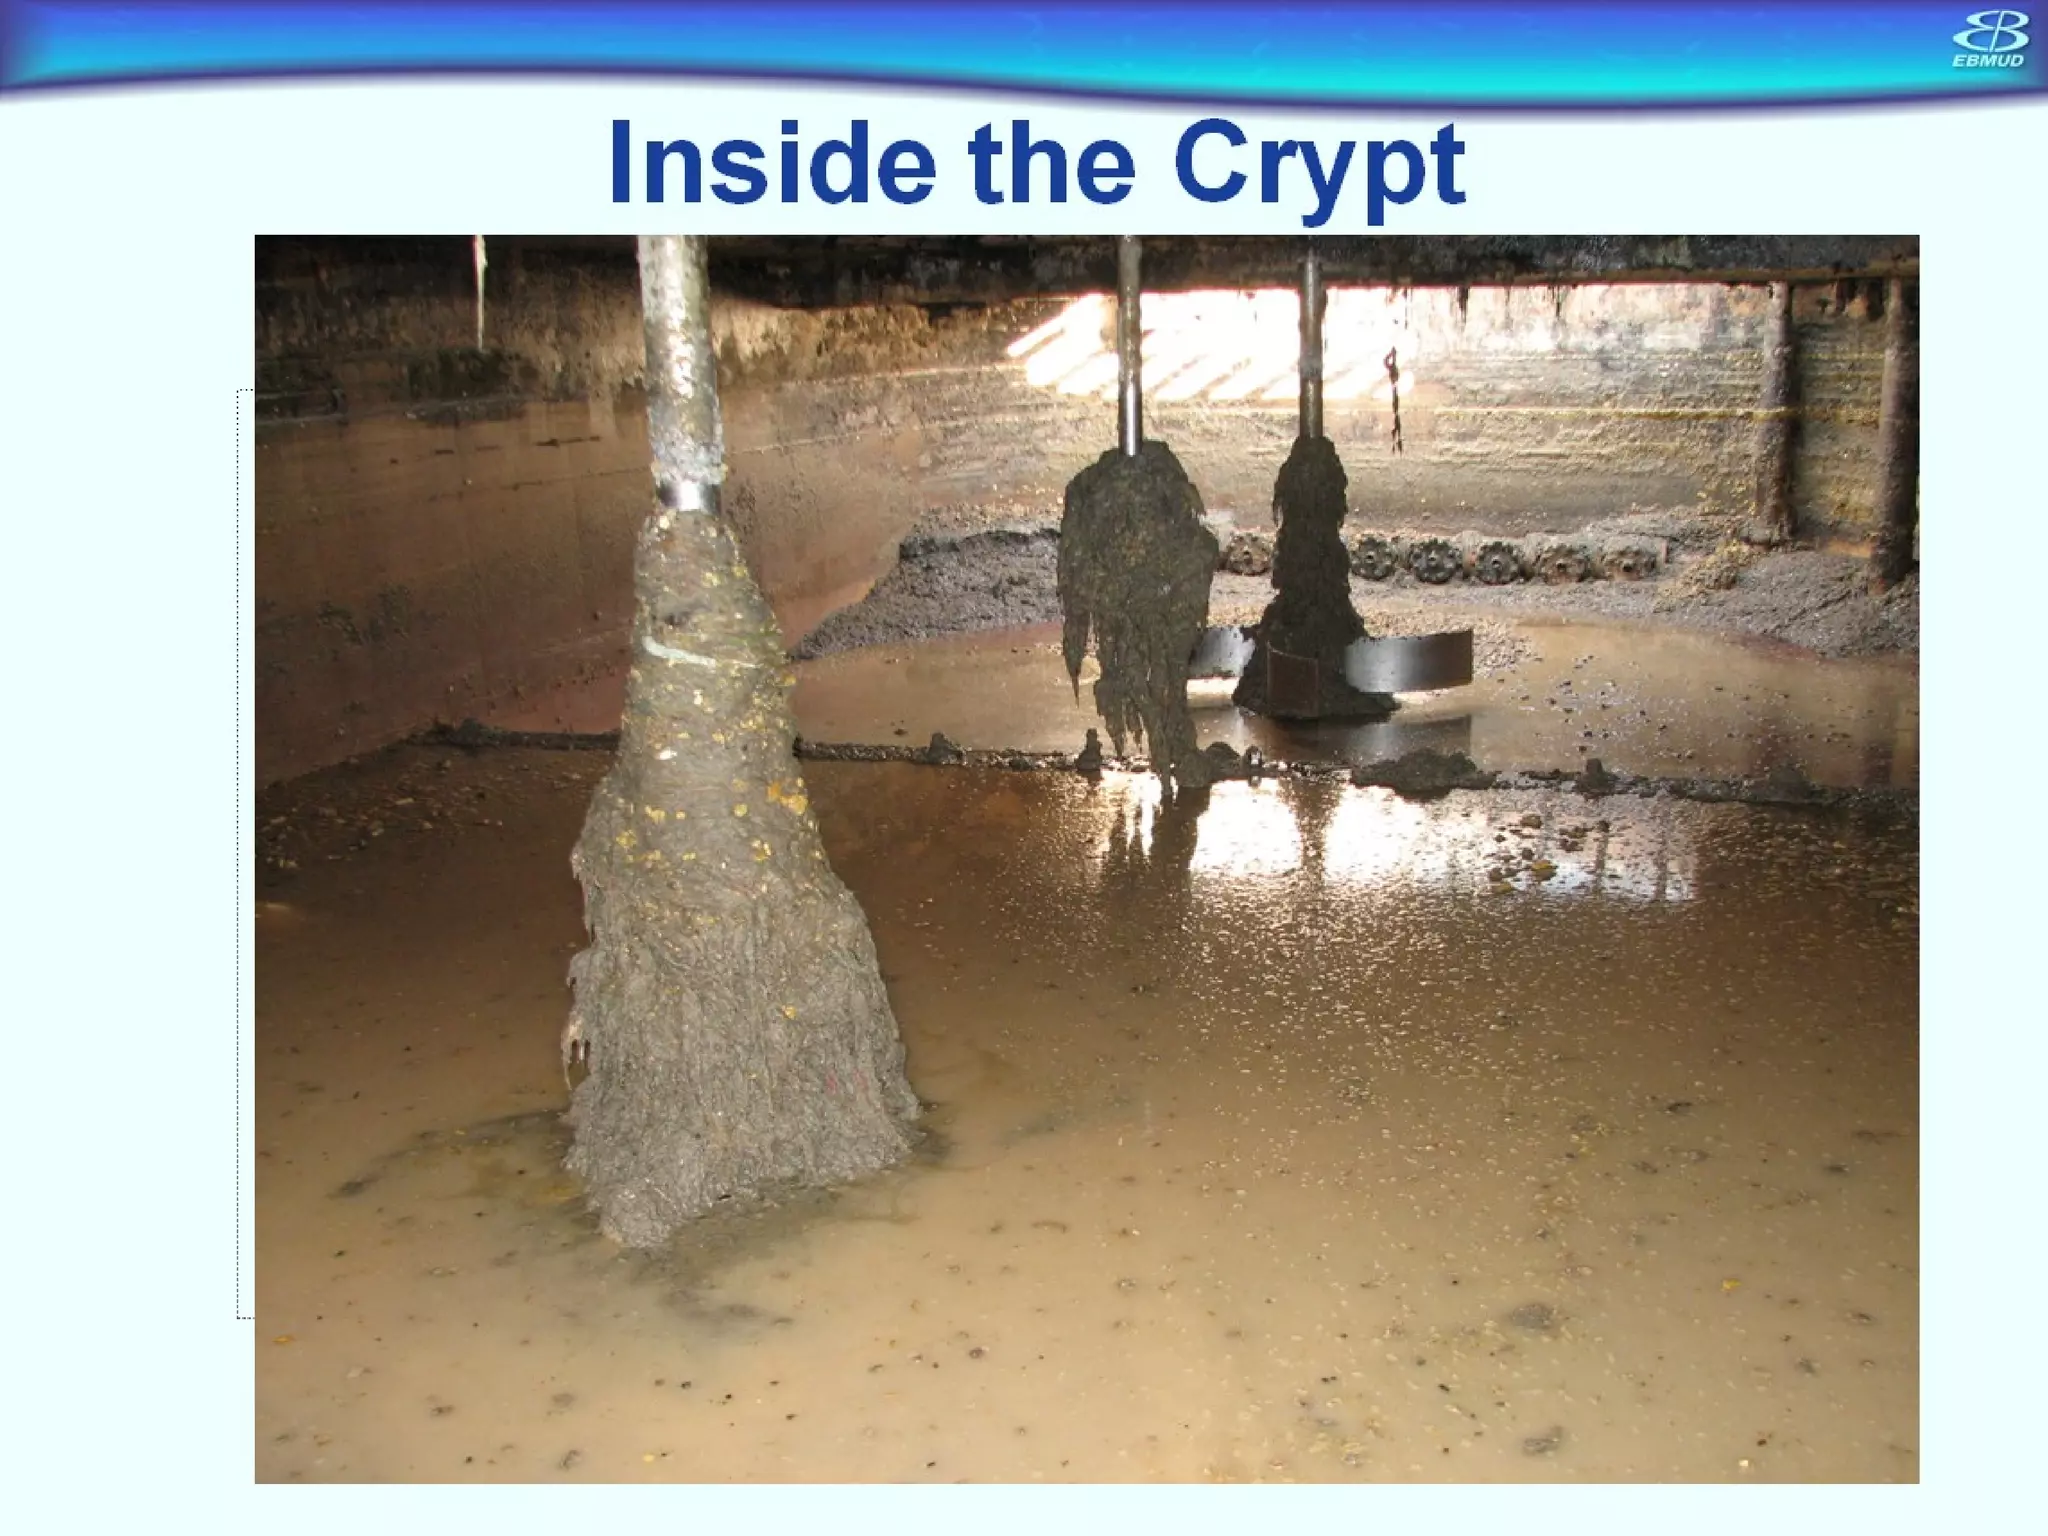
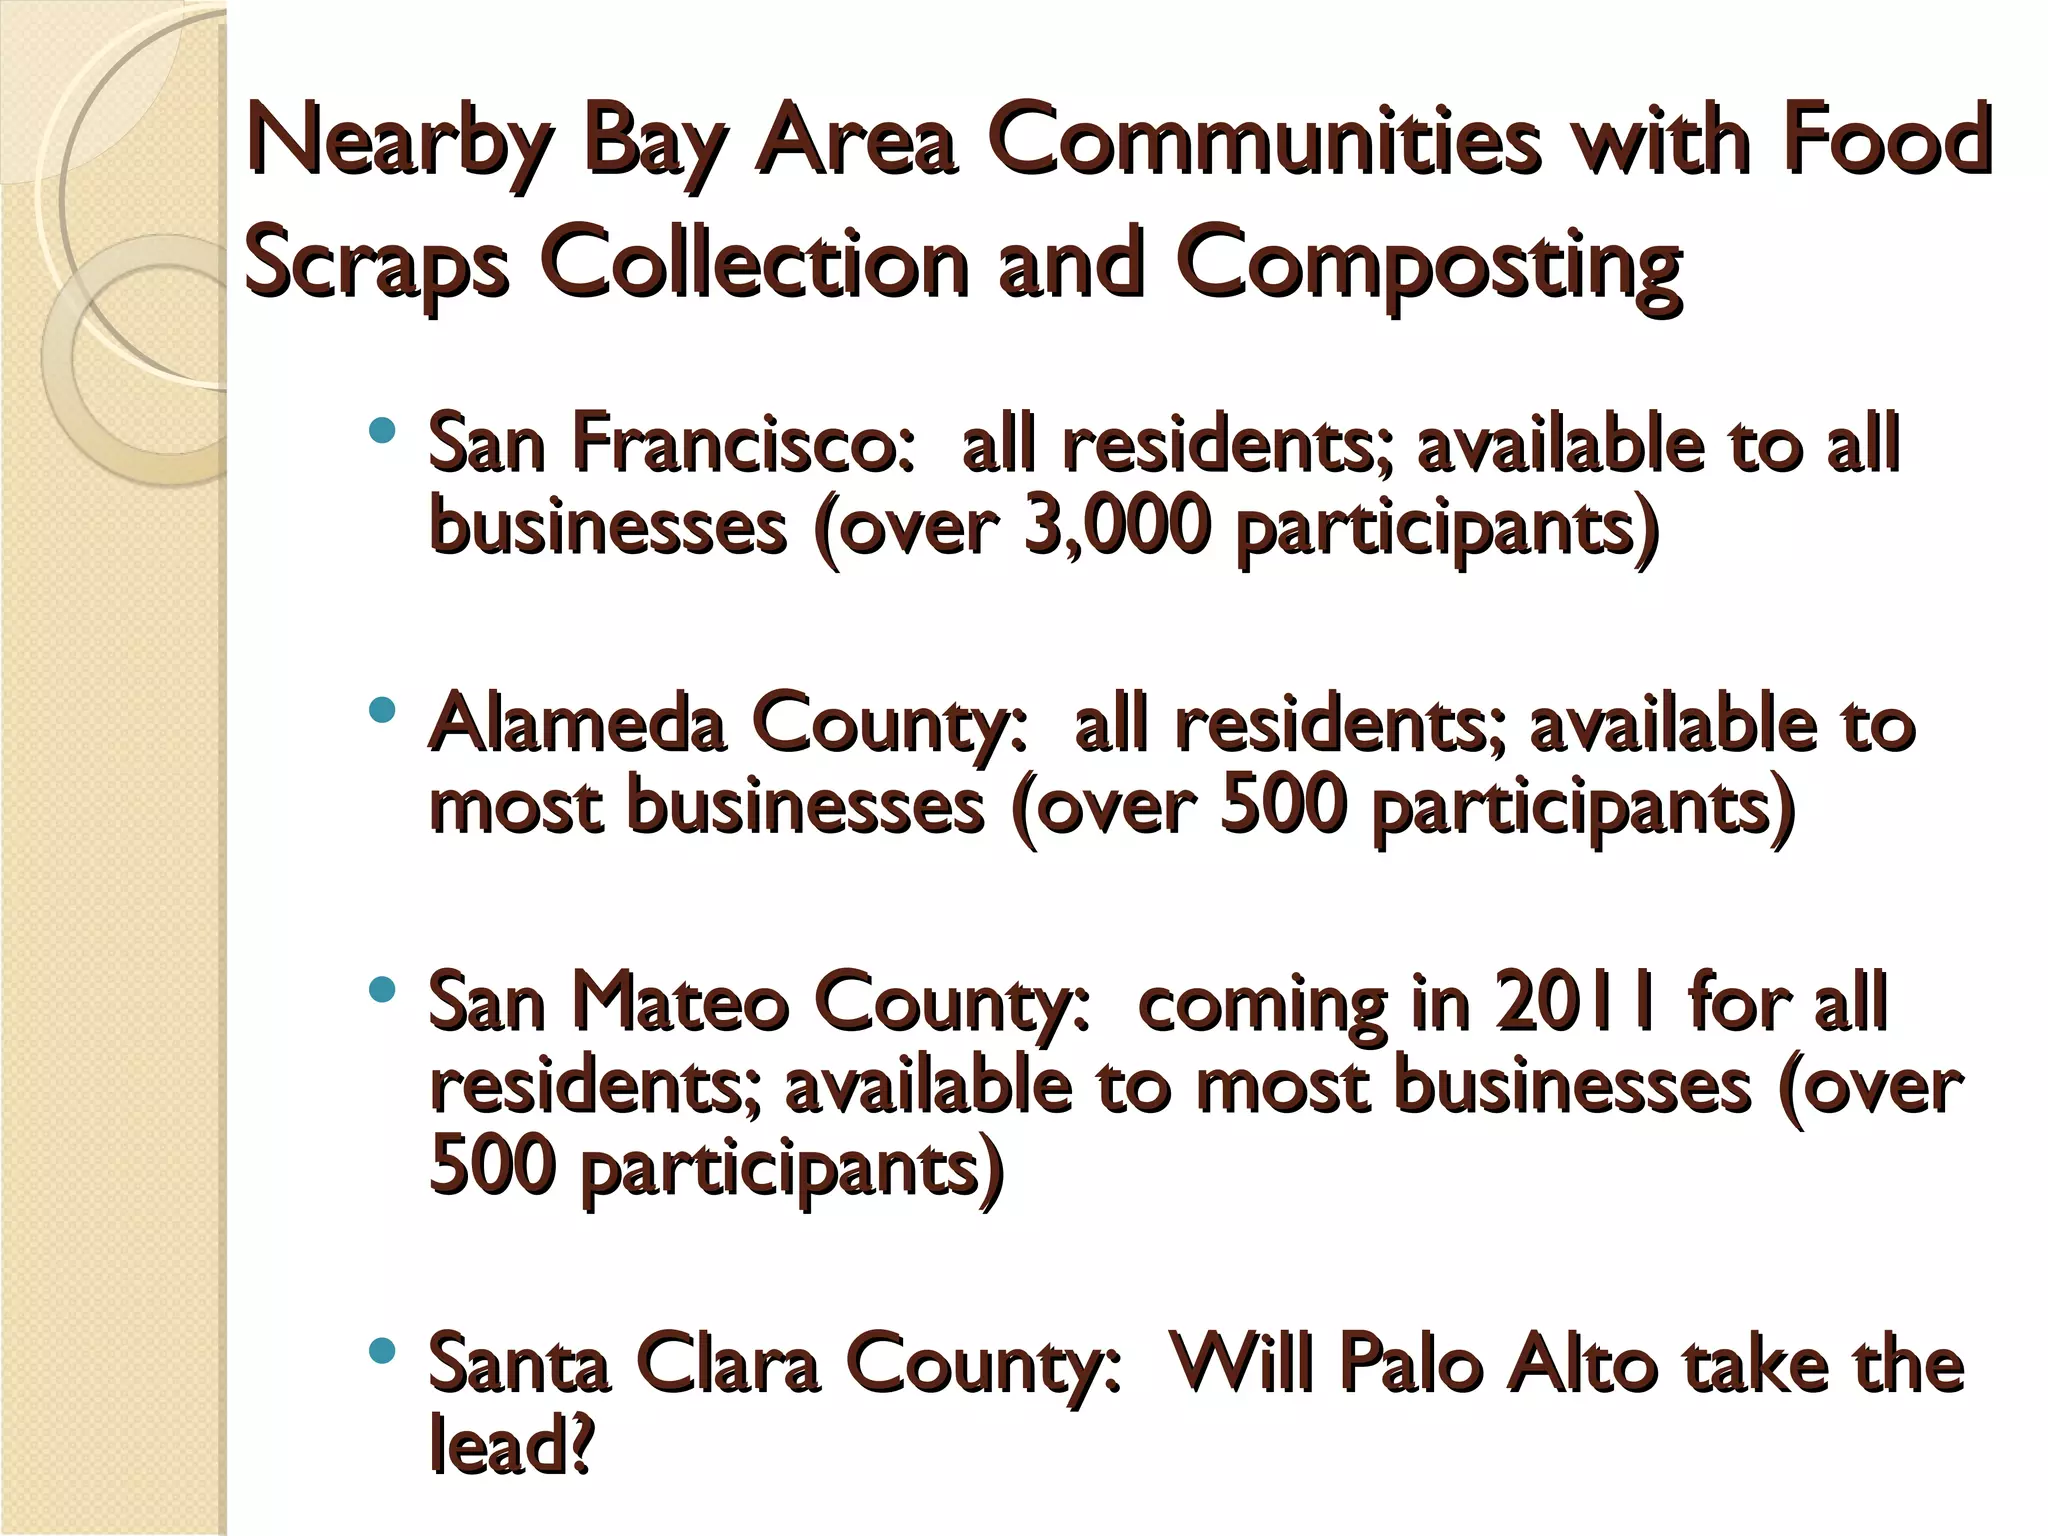
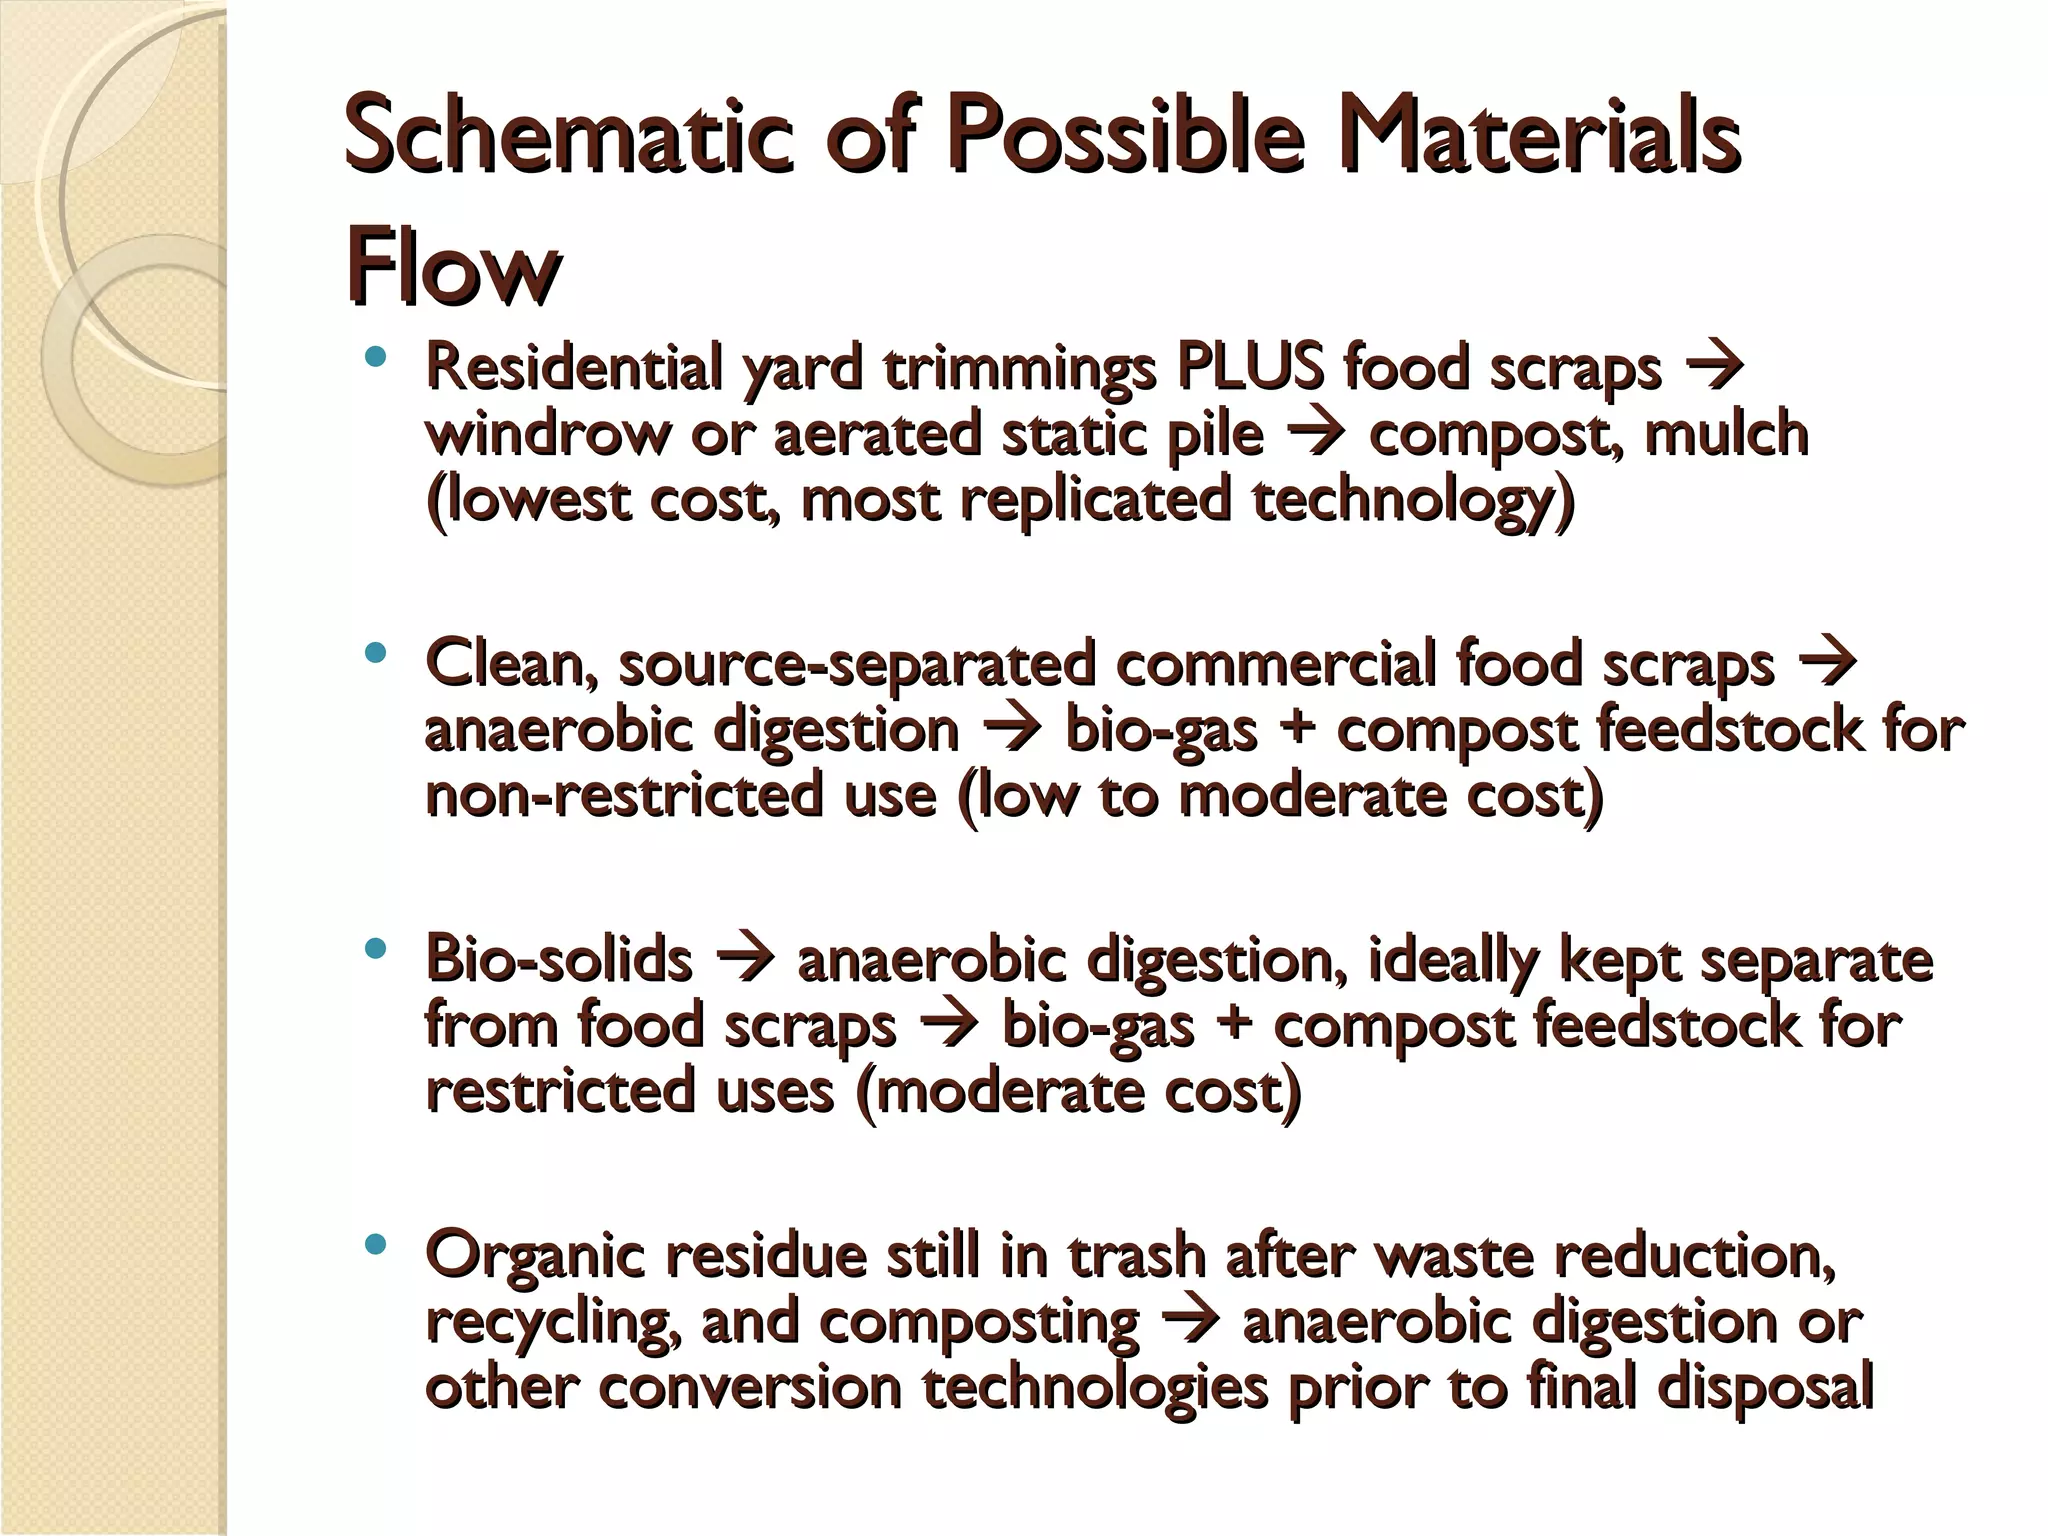
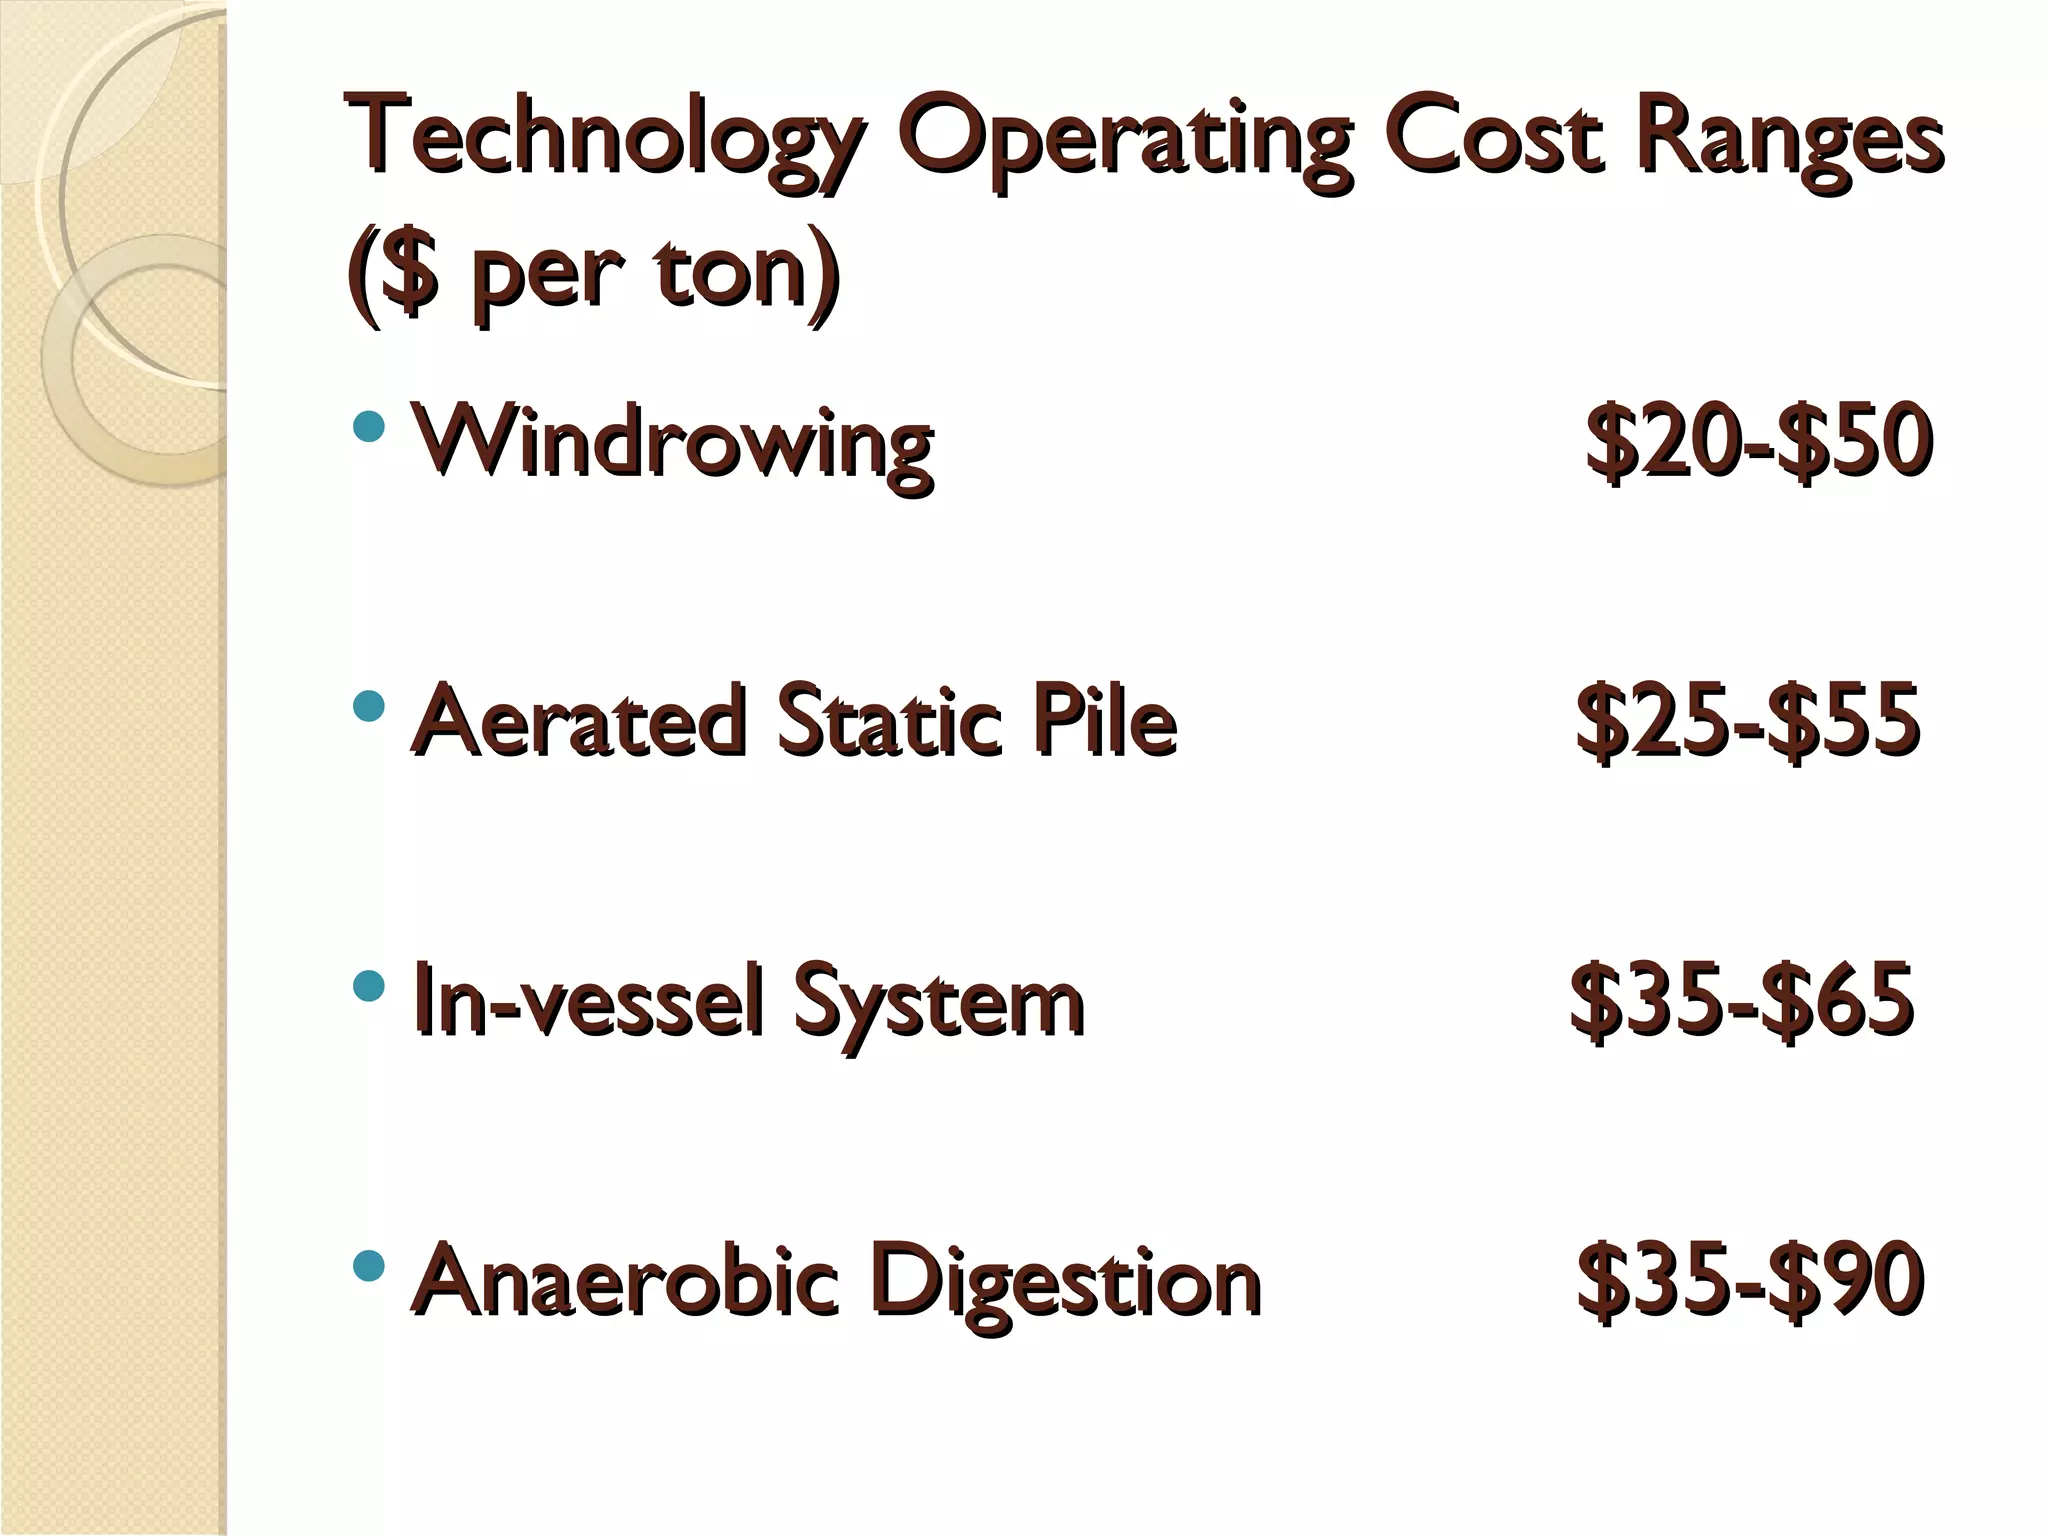
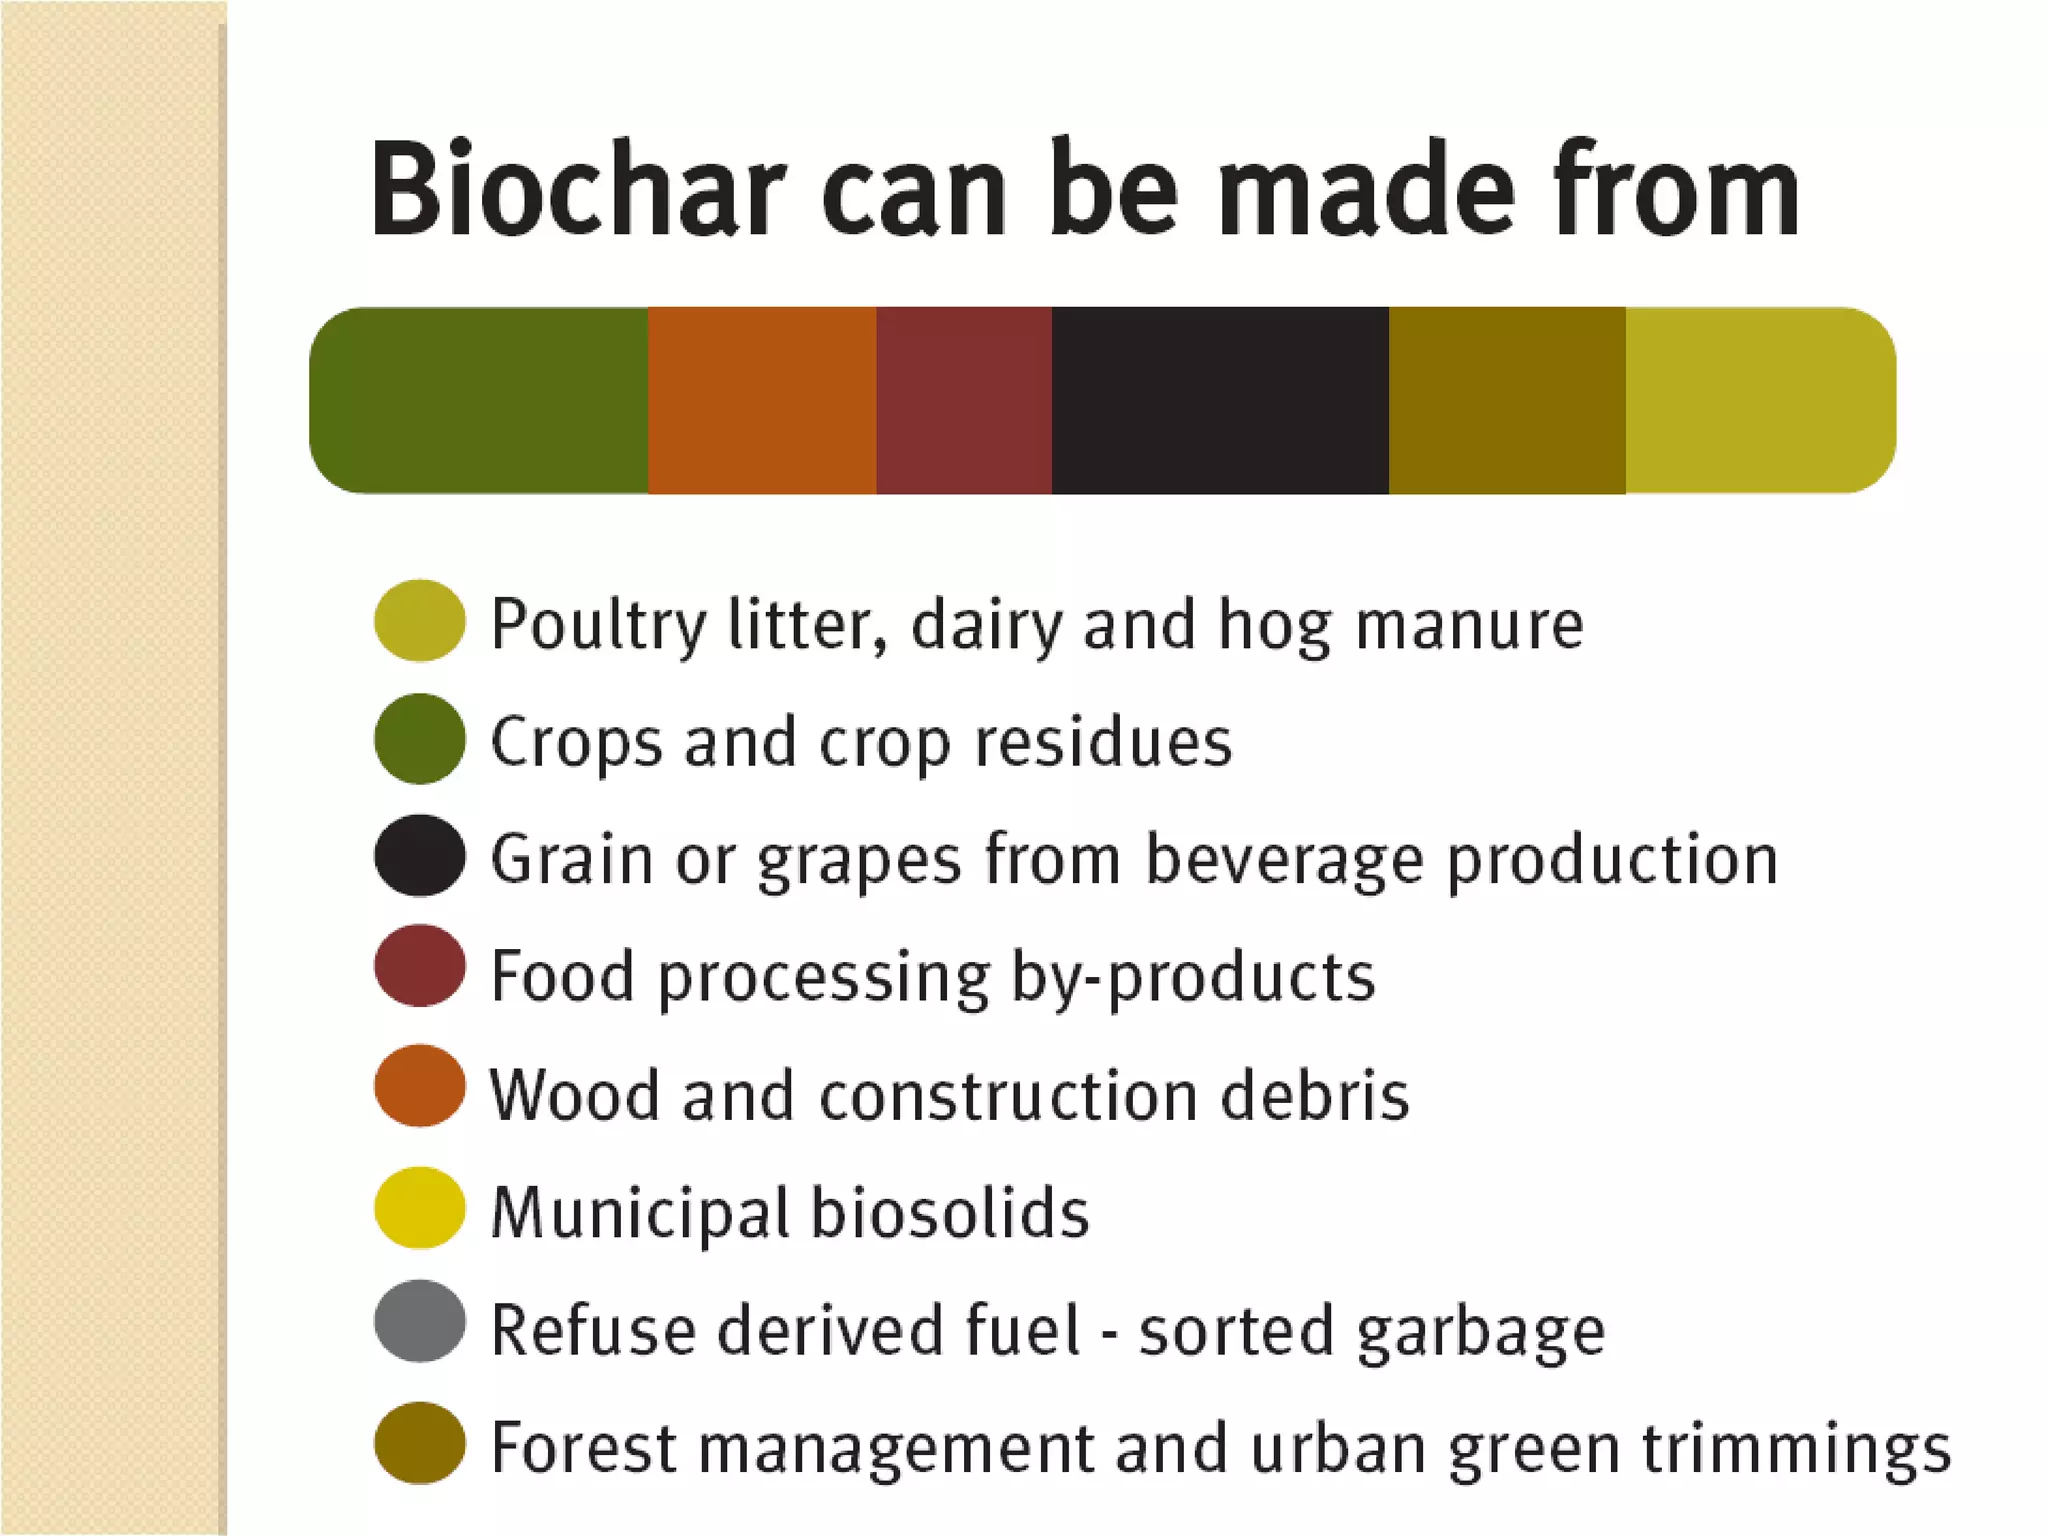
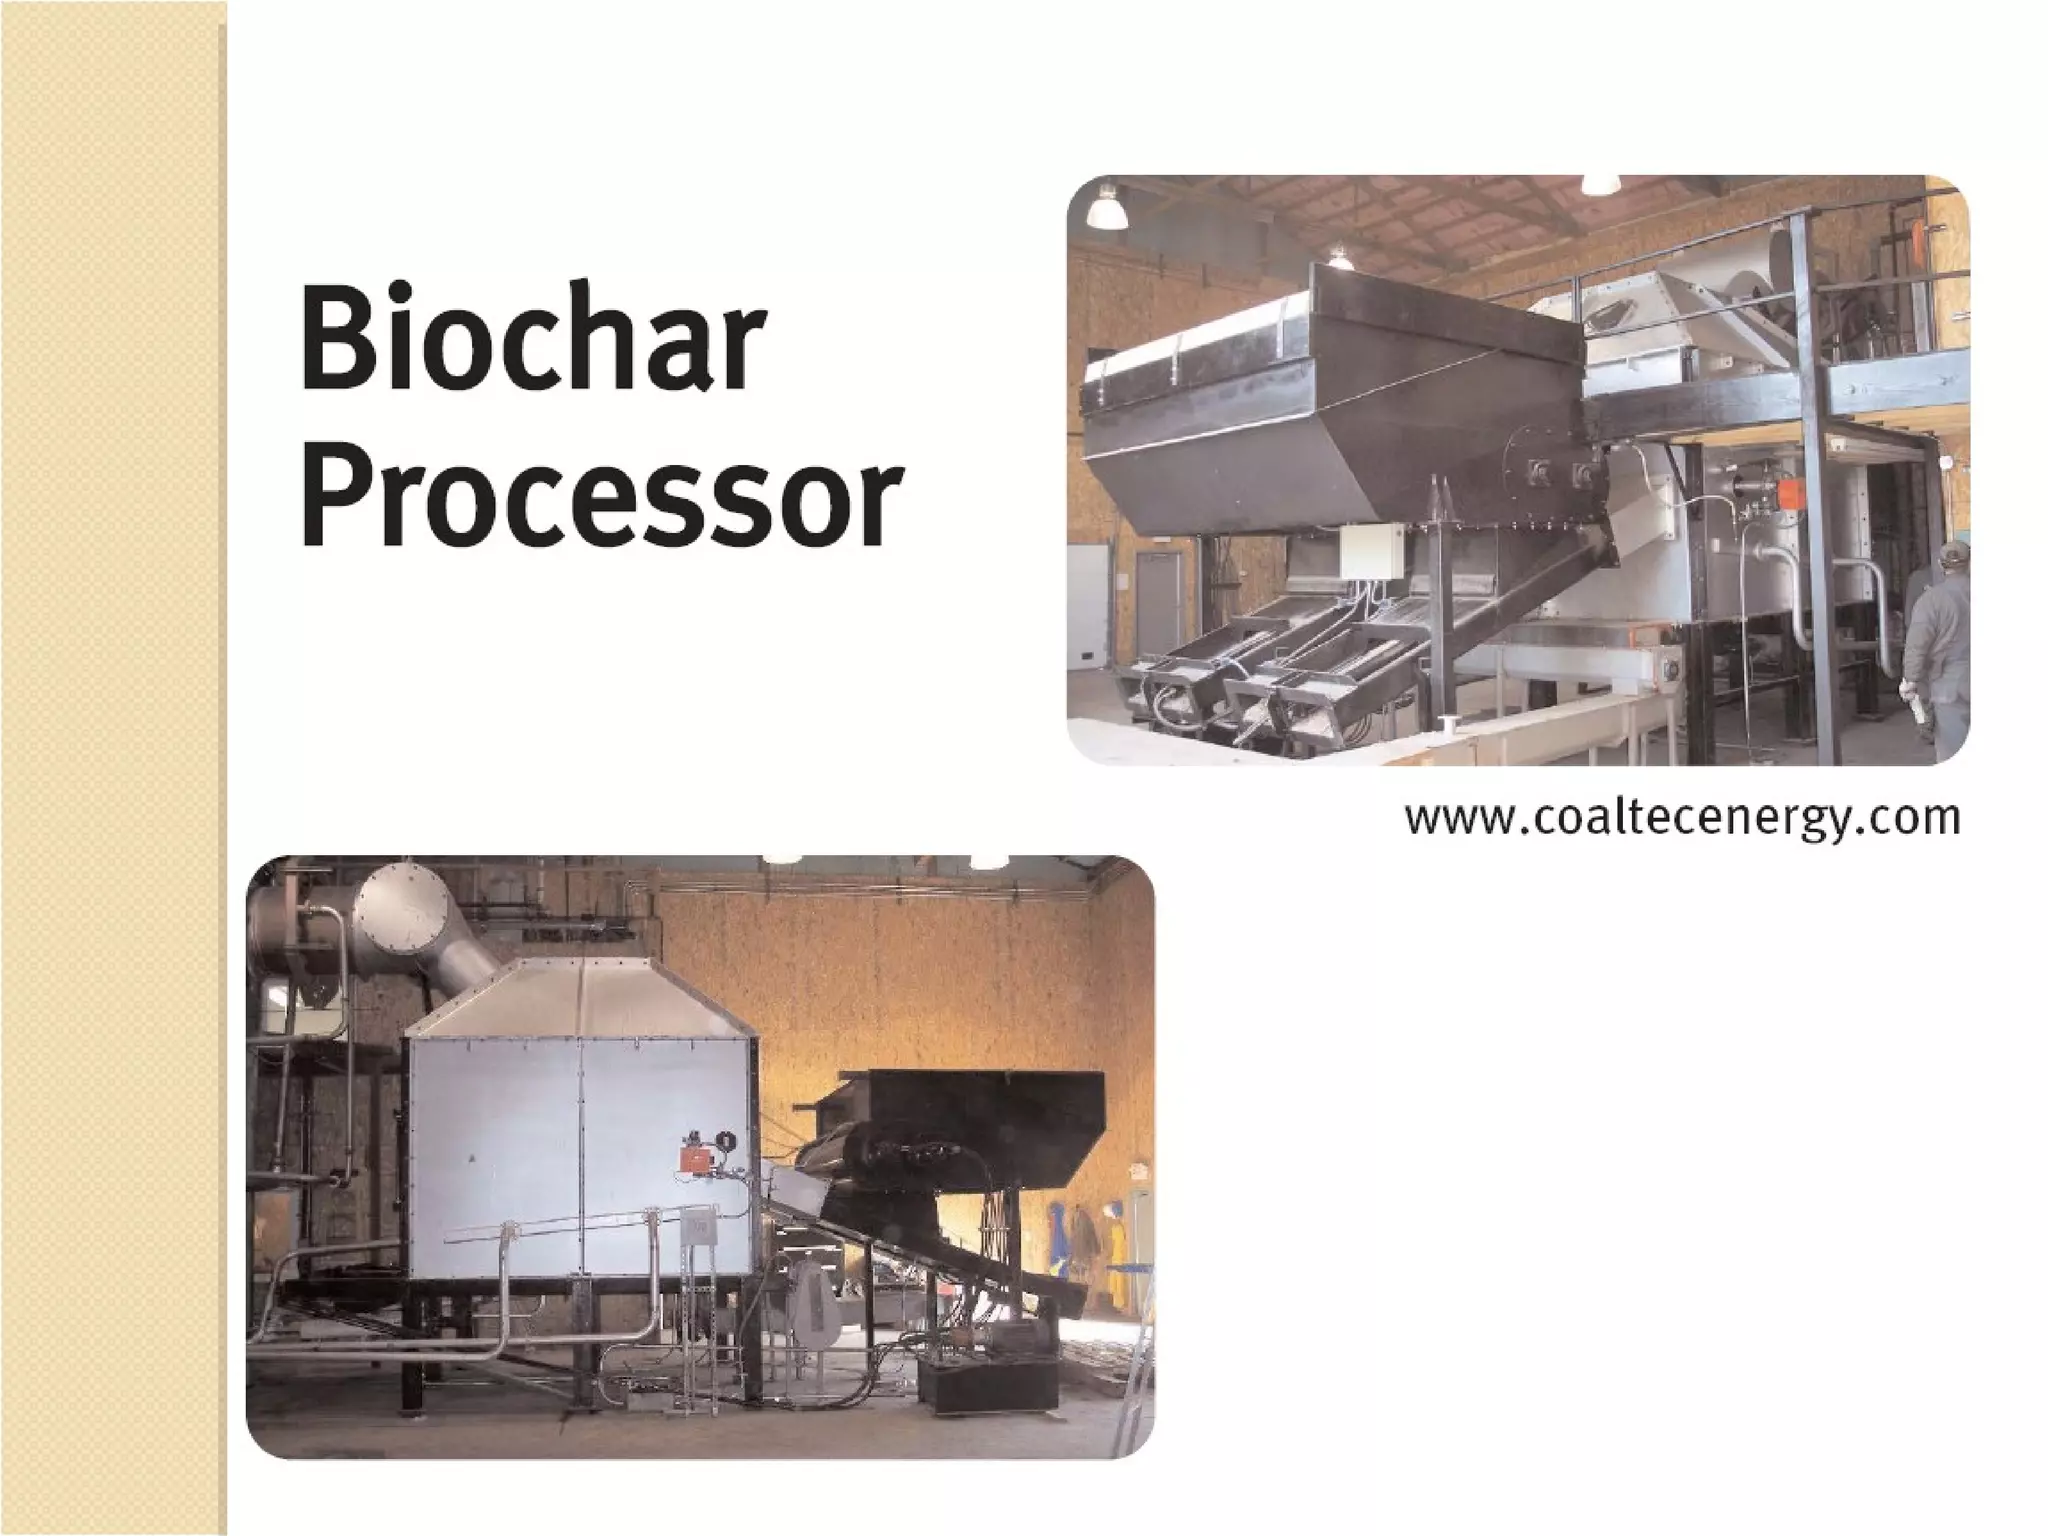
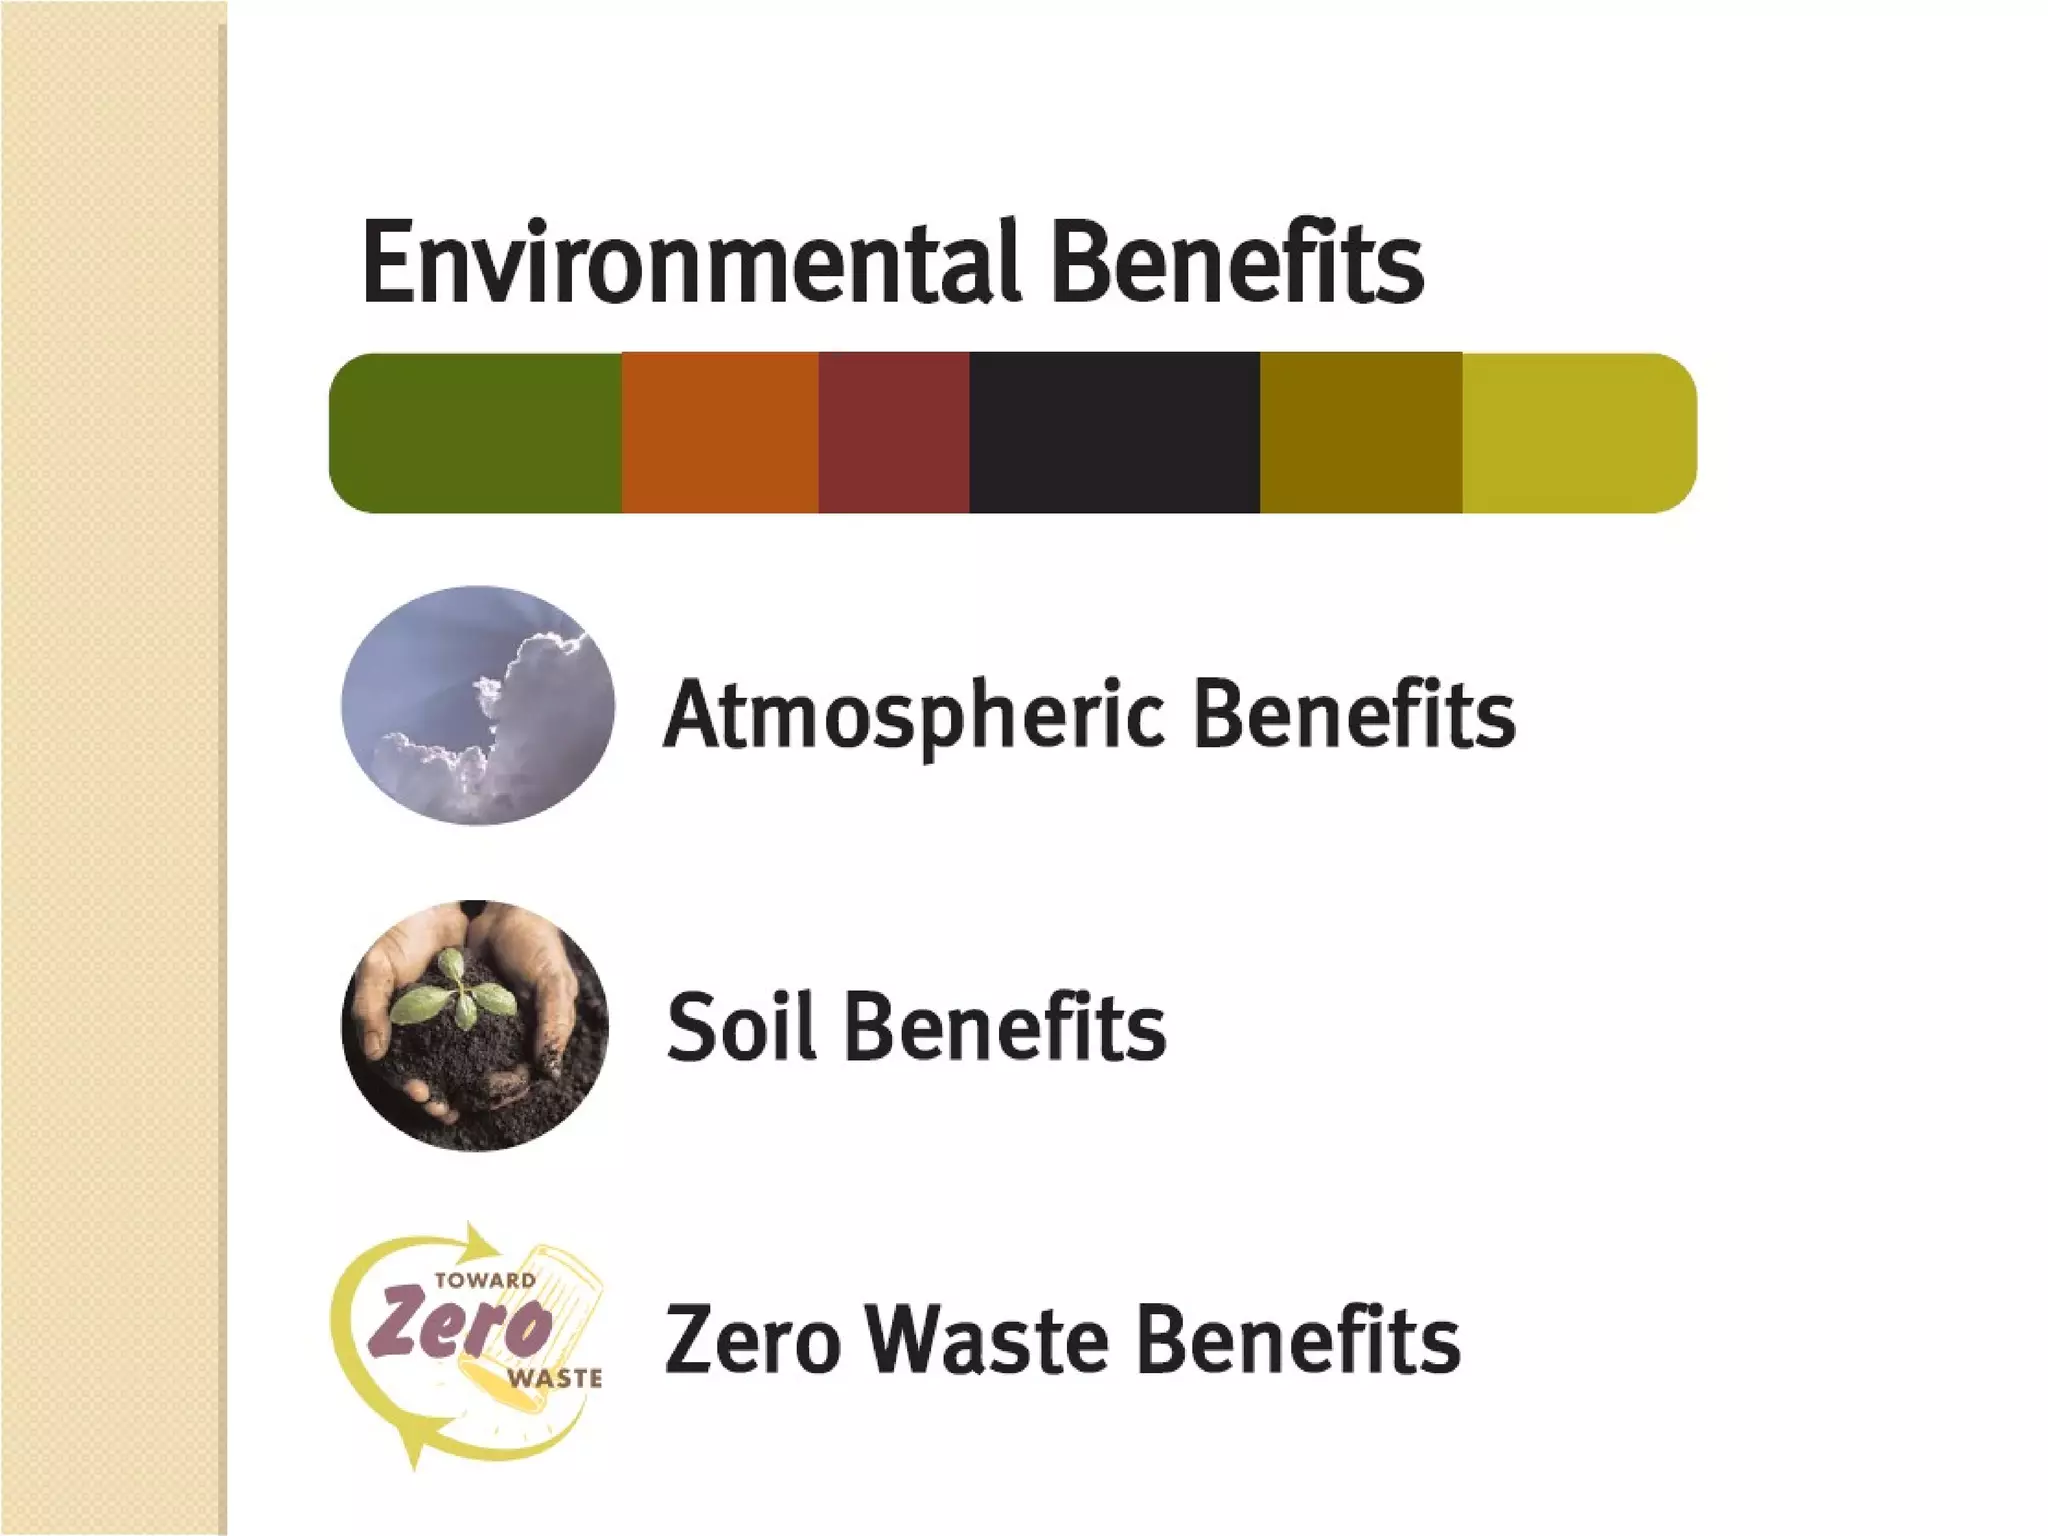
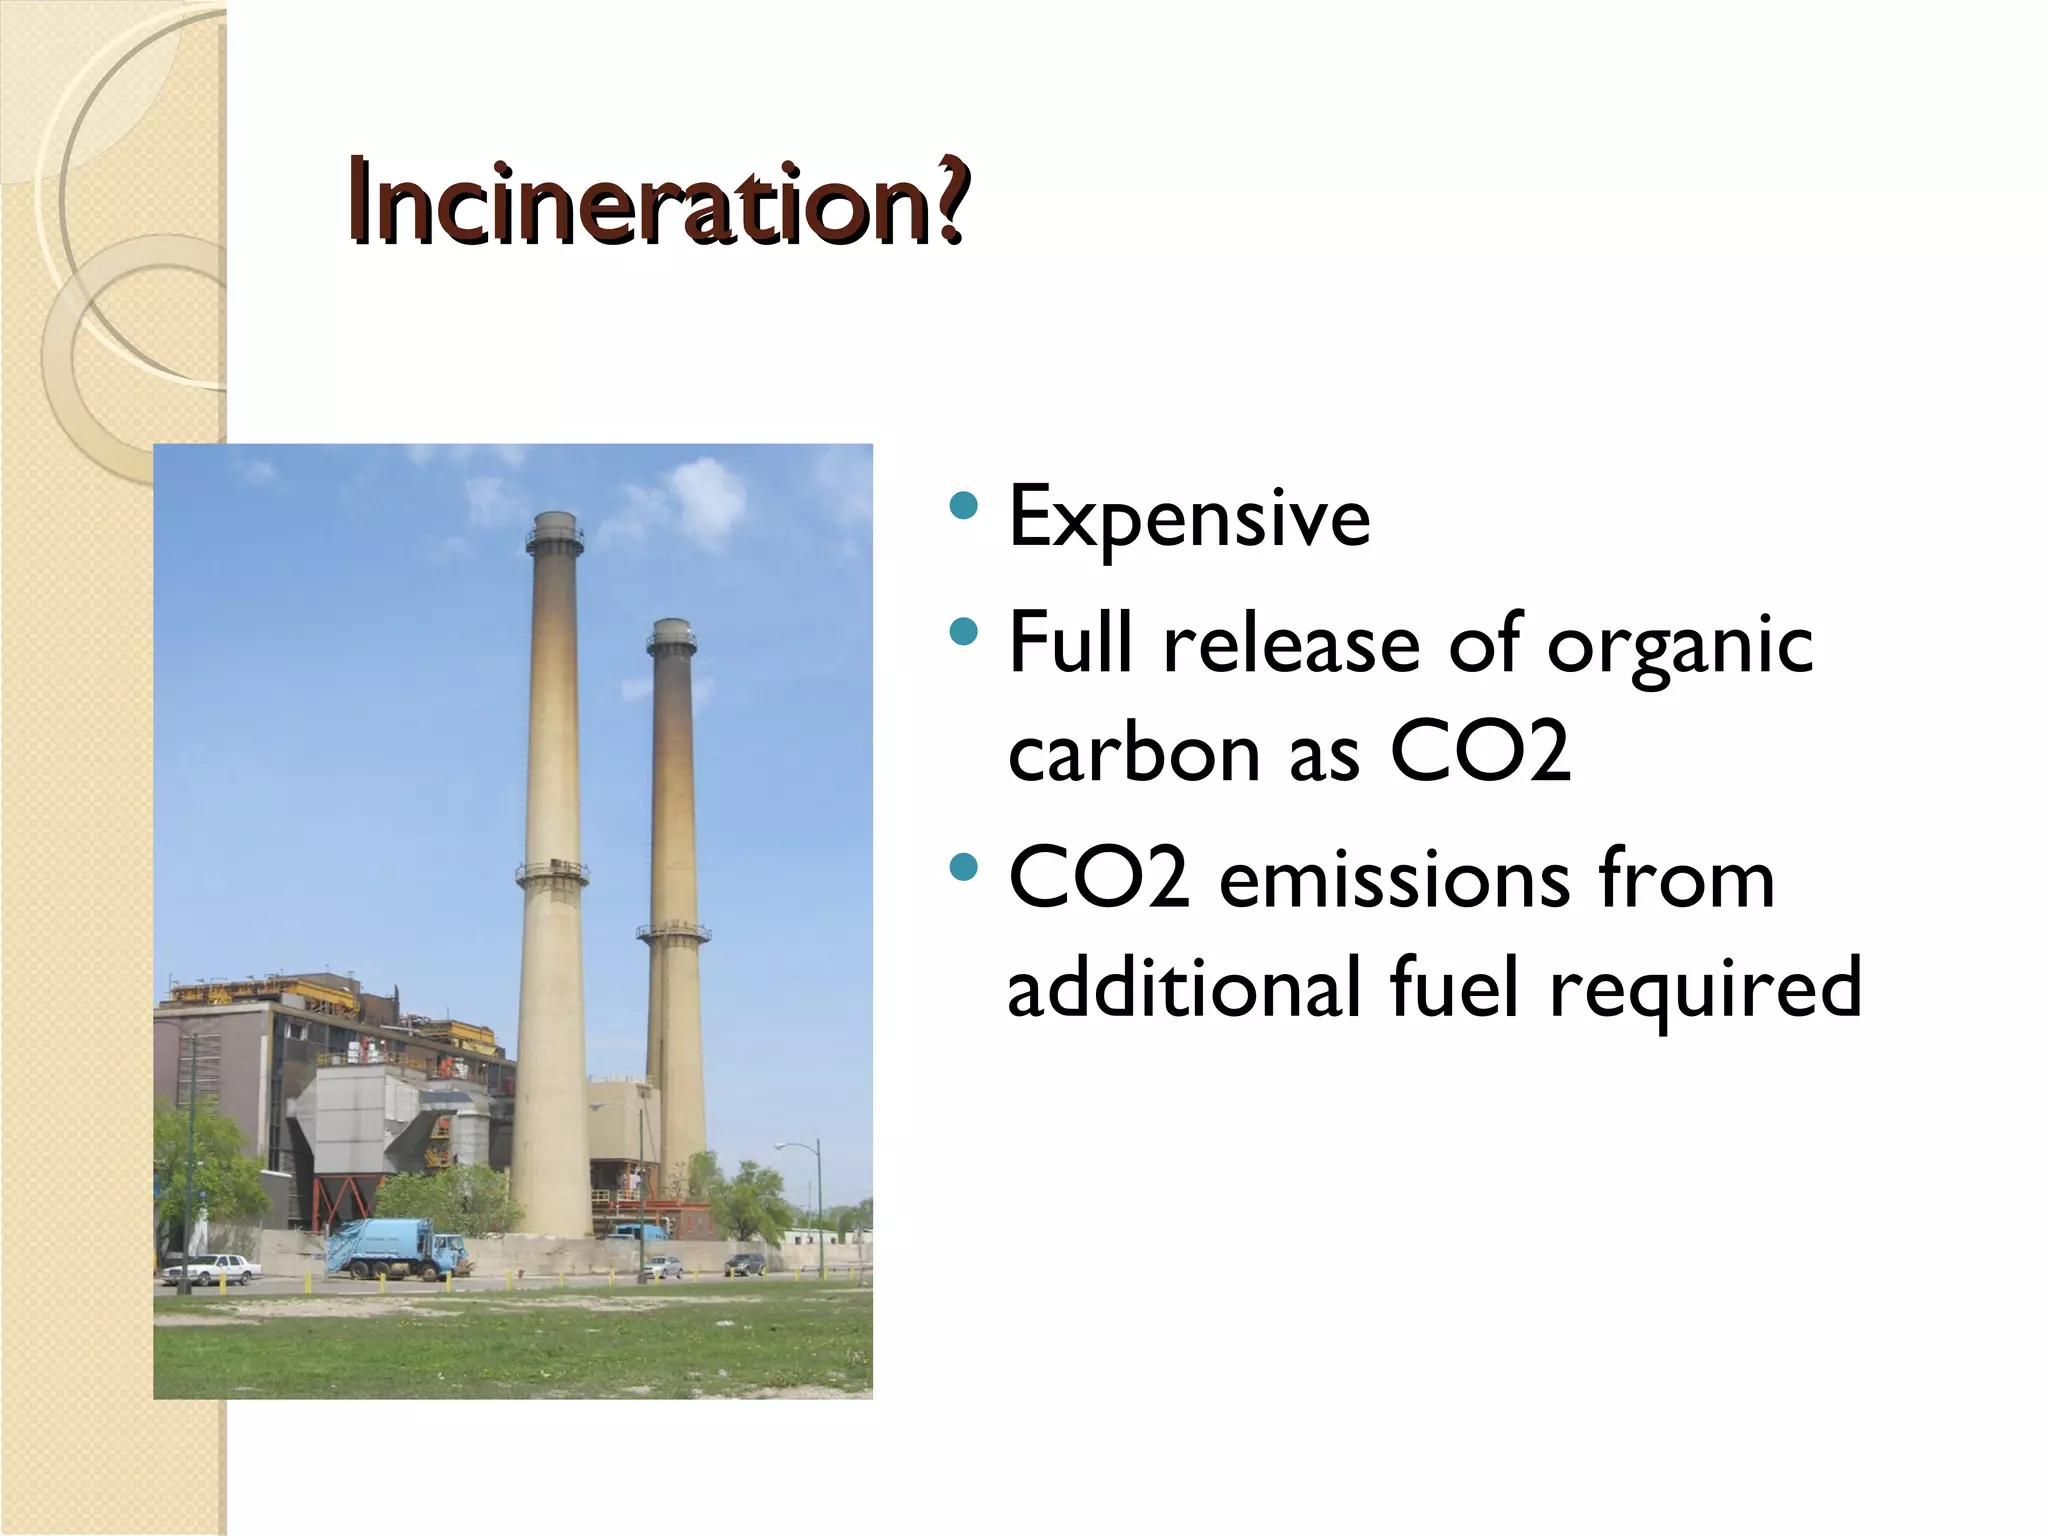
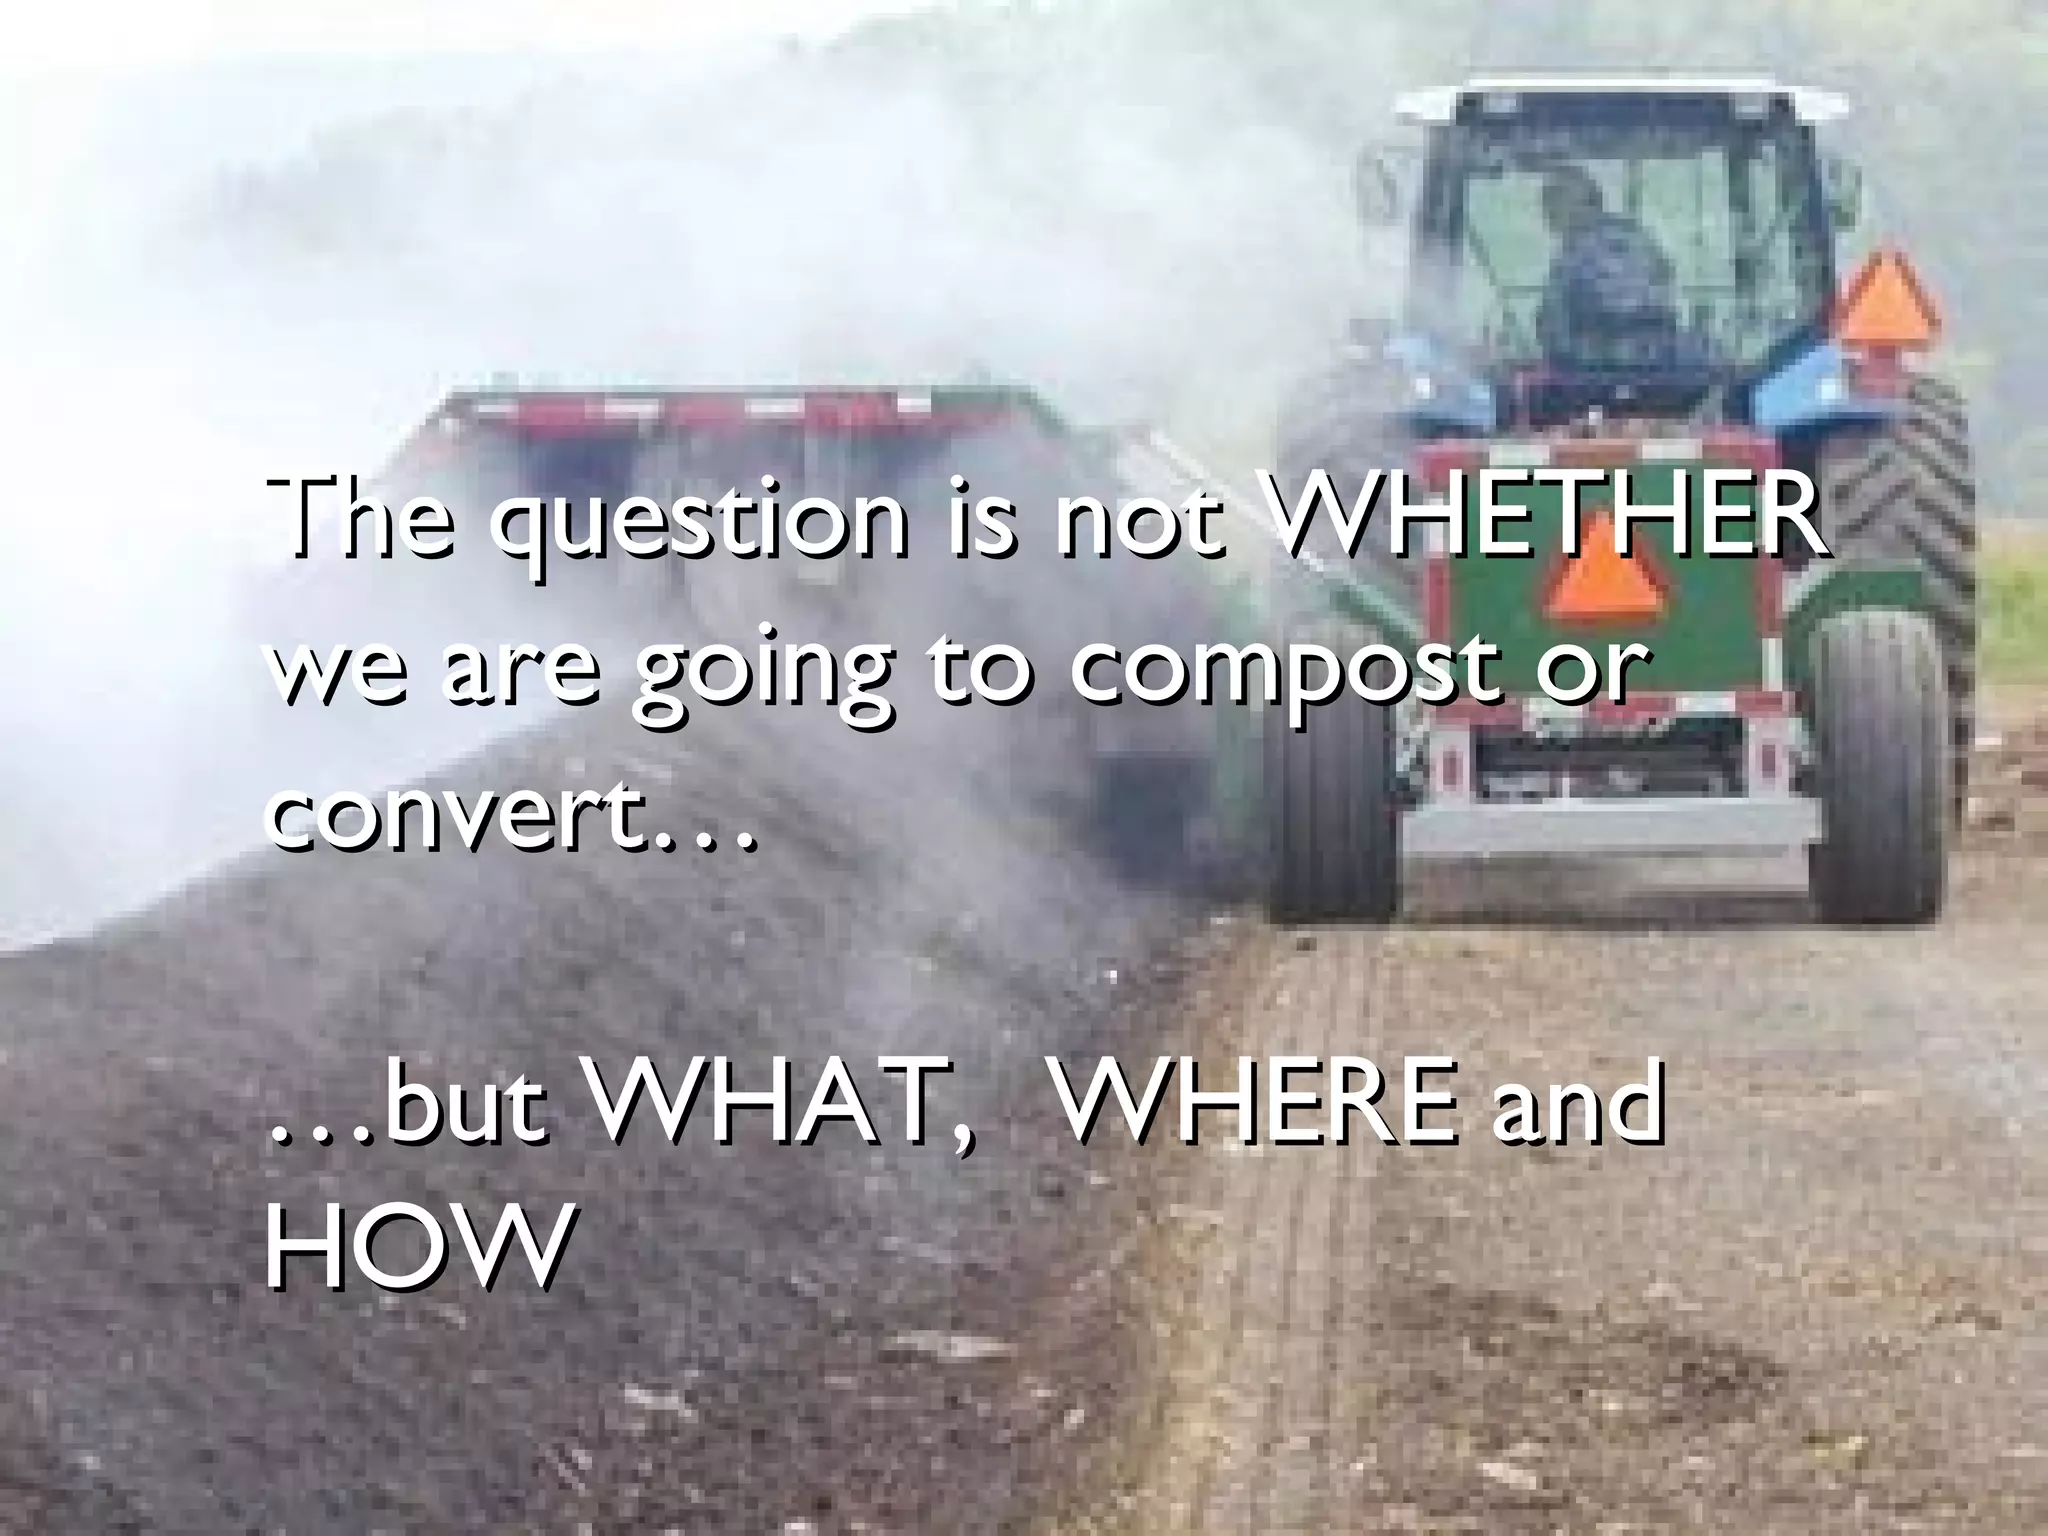
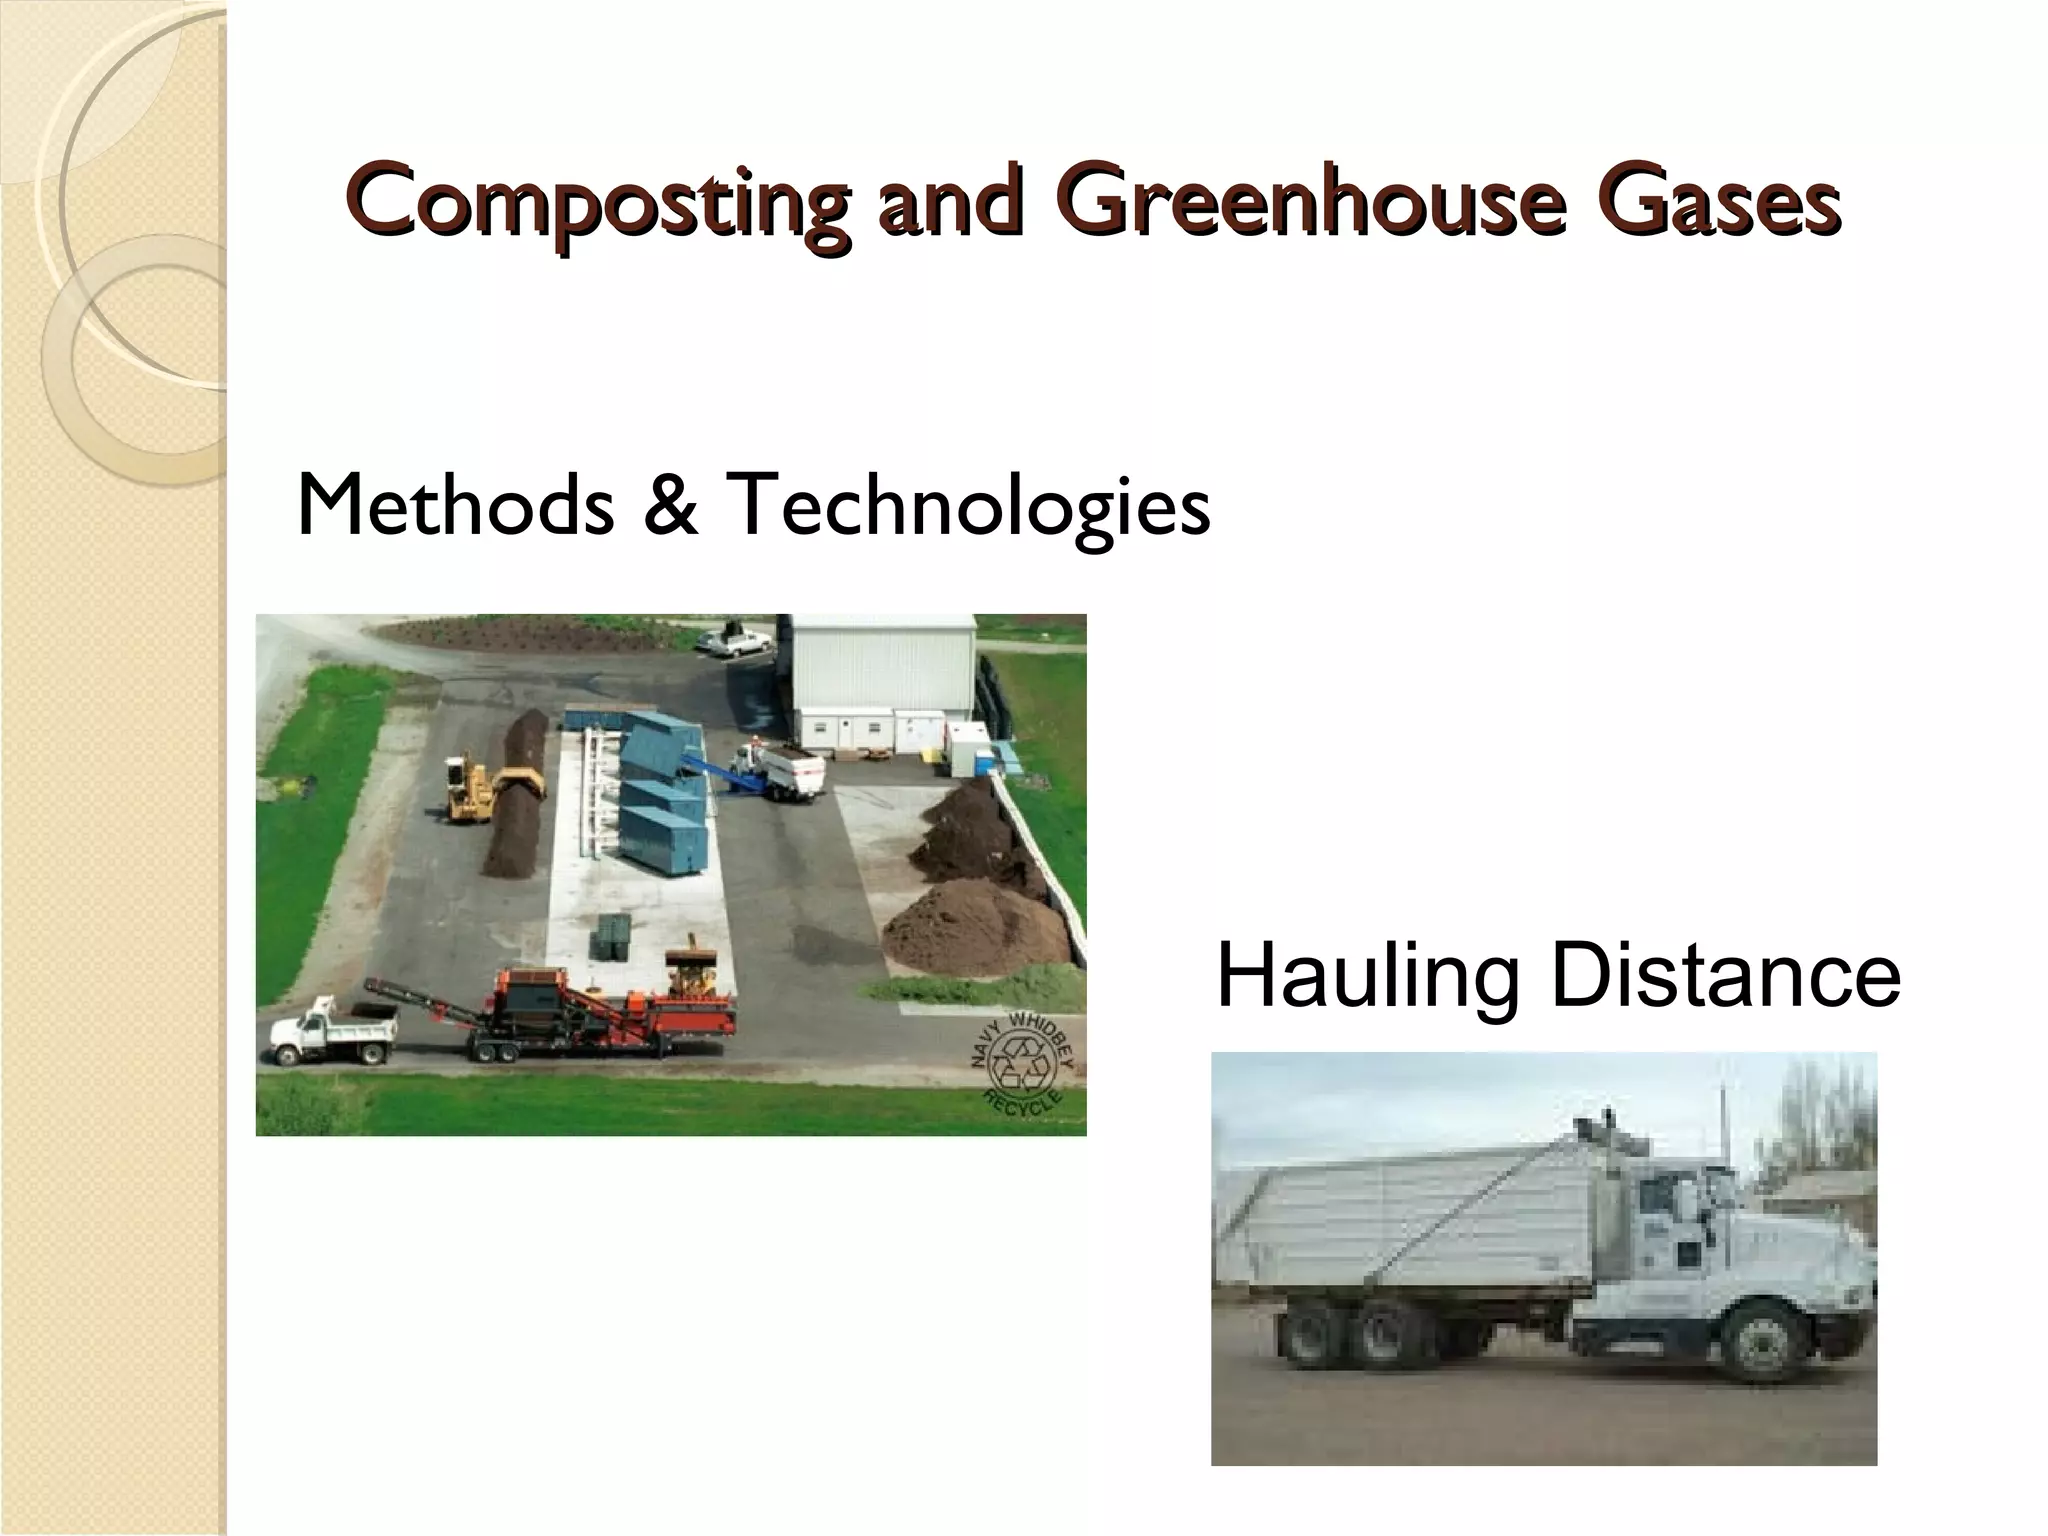
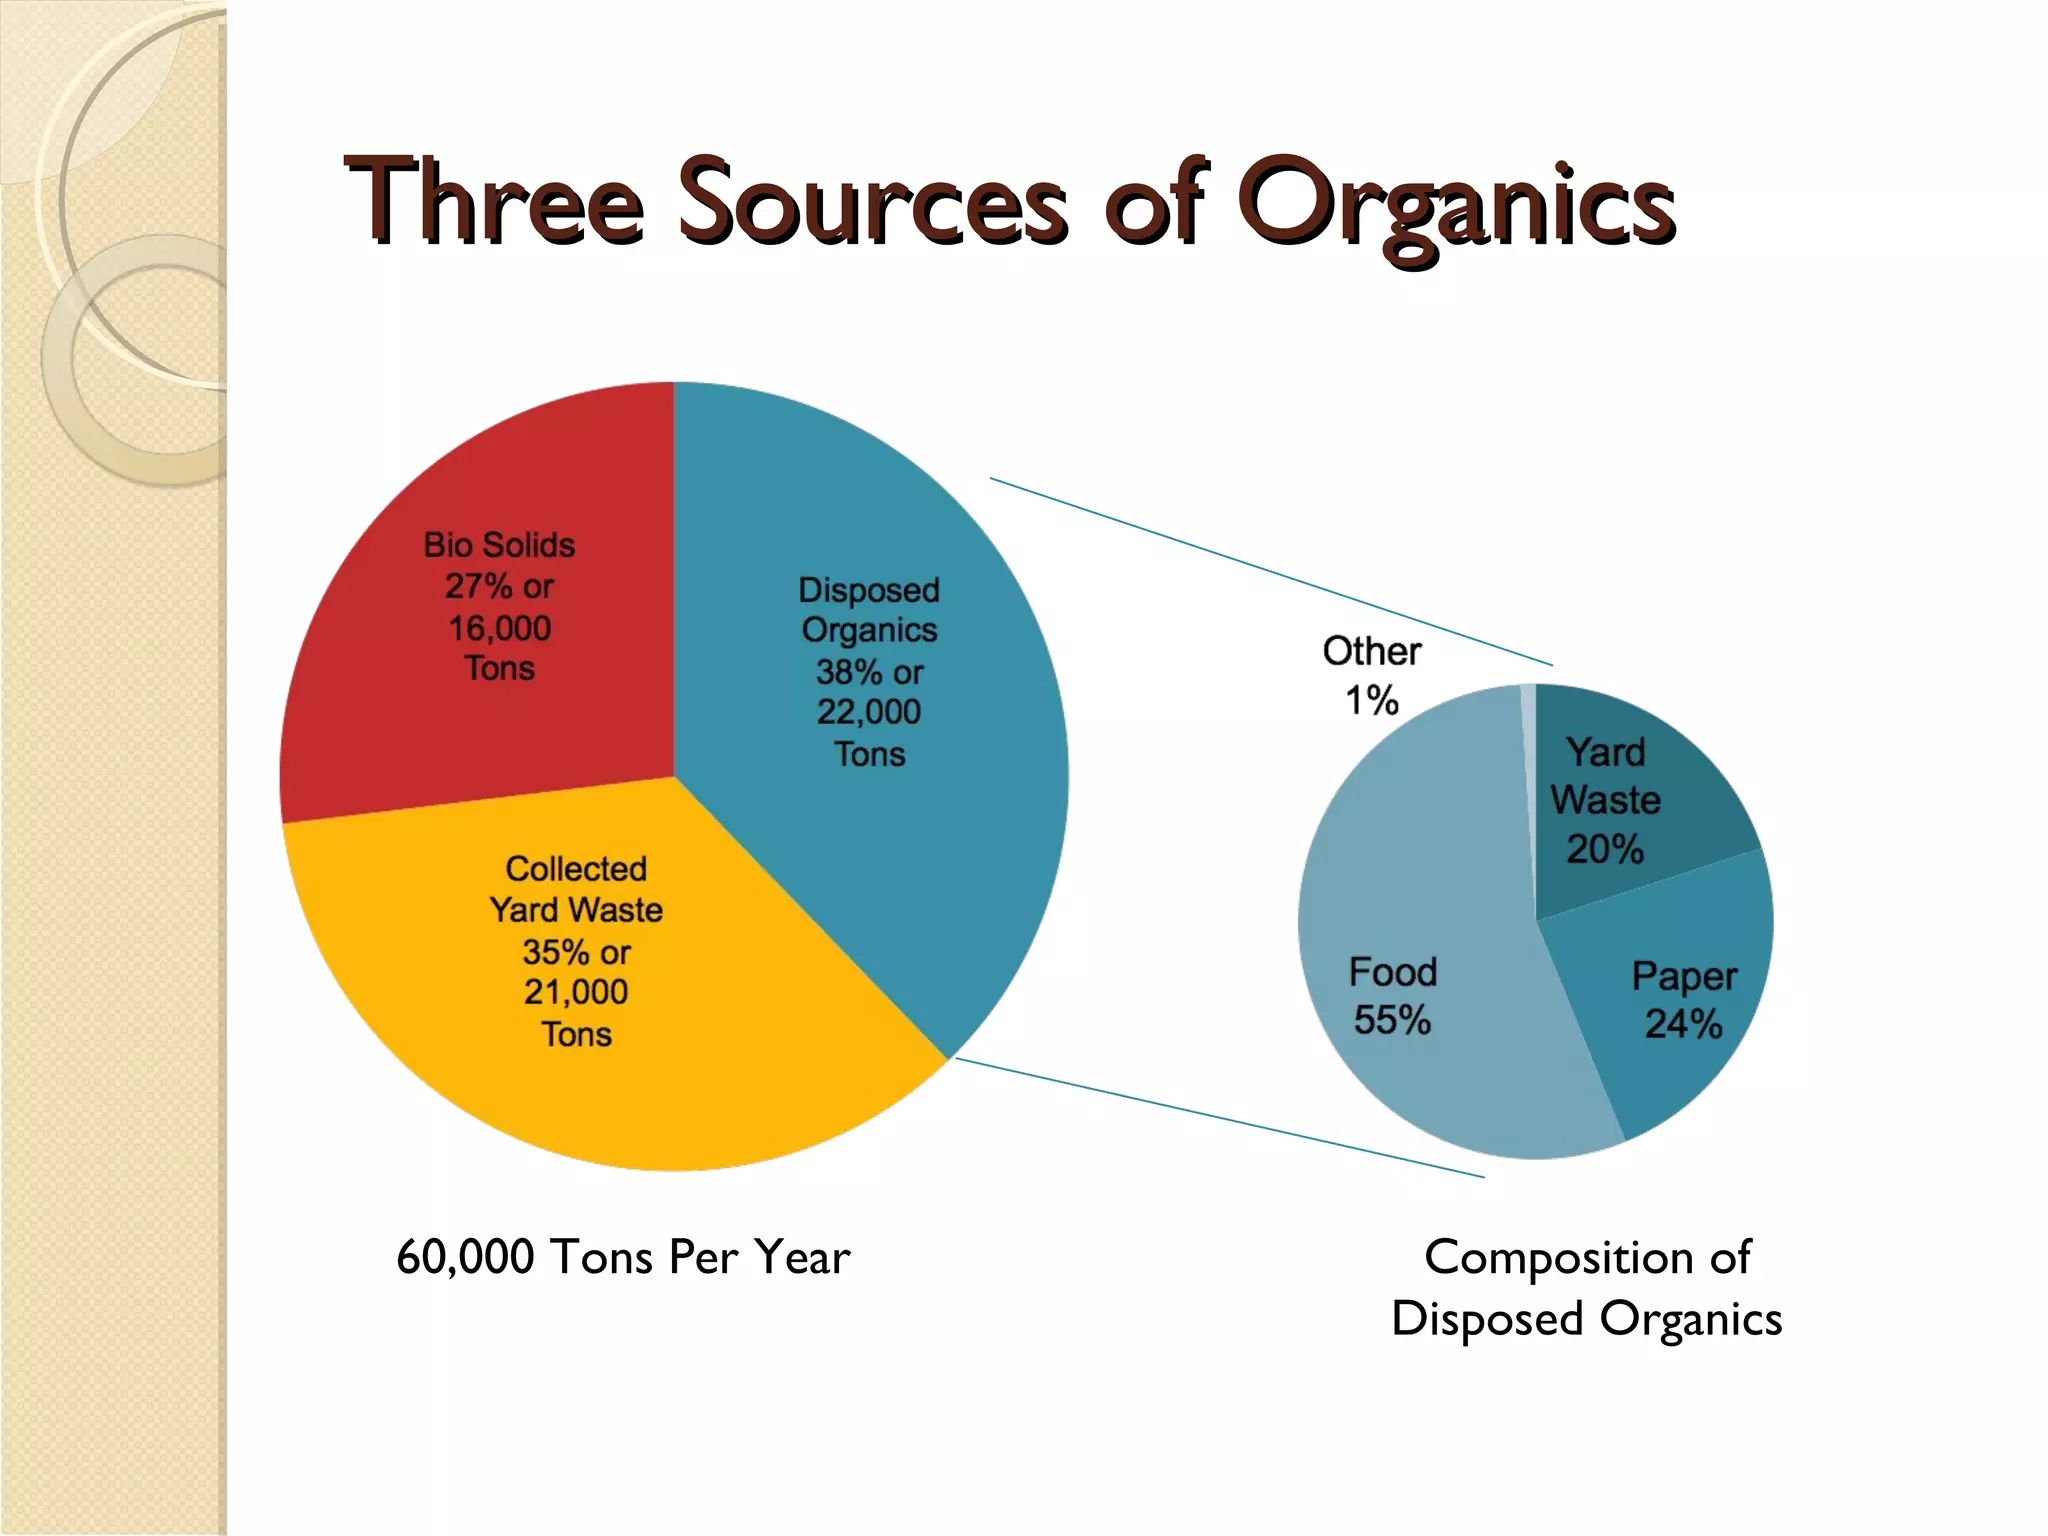


This document summarizes a teach-in on composting strategies for Palo Alto held on January 10, 2009. It introduced the organics challenge facing Palo Alto and discussed various technology options for composting, including windrow composting, aerated static pile composting, in-vessel composting, and anaerobic digestion of food waste. It also covered experiences with composting in the Bay Area, biochar technology, and the impact of various approaches on global warming. Participants were provided information but the event did not attempt to determine locations or solve the problem.


