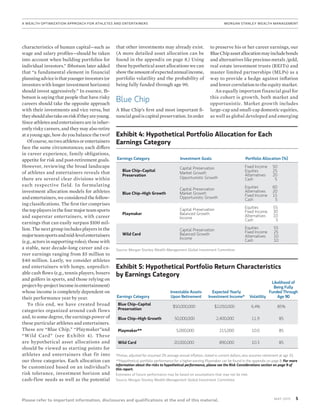
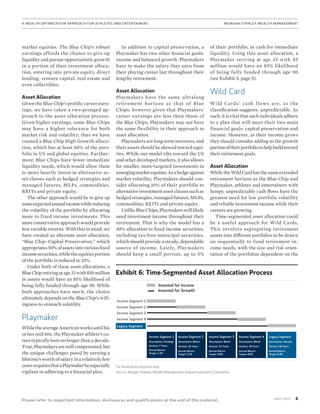
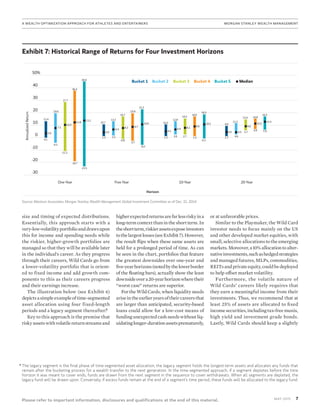
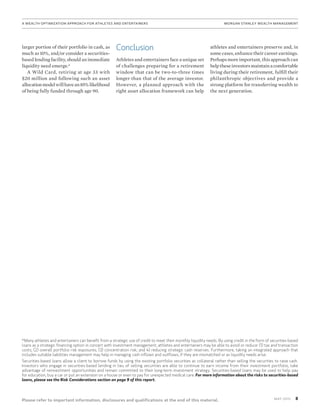
GLOBAL INVESTMENT COMMITTEE MAy 2015
introduction authors
Lisa Shalett
Head of Investment and Portfolio Strategies
Morgan Stanley Wealth Management
 
JON MACKAY
Market Strategist
Morgan Stanley Wealth Management
 
ZACHARY Apoian
Senior Asset Allocation Strategist
Morgan Stanley Wealth Management
A Wealth Optimization
Approach for Athletes
and Entertainers
The careers of athletes and entertainers can
be short. Injuries may sideline athletes at any
time, while social and/or artistic trends can erode
an entertainer’s appeal. For both, peak earnings
can happen early in life, and compensation may
be entirely unpredictable. Due to these factors,
budgeting for ongoing annual expenses and
developing a long-term investment strategy is
complex. In this paper, we lay out a holistic and
integrated approach that can be tailored to the
goals of each individual.
Follow us on Twitter
@MS_CIOWilson
Please refer to important information, disclosures and qualifications at the end of this material.
2MAy 2015
Please refer to important information, disclosures and qualifications at the end of this material.
A Wealth Optimization Approach for Athletes and Entertainers	MORGAN STANLEY WEALTH MANAGEMENT
Executive Summary
The careers and earnings profiles of athletes and entertainers are unusual compared
with traditional forms of employment, for which career length and compensation are
somewhat predictable. Athletes and entertainers’ careers can be short; injuries may
sideline athletes at any time, and social and/or artistic trends can erode an entertainer’s
appeal. For both, peak earnings can happen very early in their careers as many come
into sudden wealth when they sign their first professional contracts. Pay schedules
may be entirely unpredictable, or payments may only occur when the sport is in season.
Due to these factors, budgeting for ongoing annual expenses, assessing large capital
expenditures and developing a long-term investment strategy is complex and absolutely
critical to wealth optimization. Envisioning and planning for the postcareer years also
present unique challenges. Thus, a holistic and integrated approach to financial planning
and investing is necessary so that lifestyle needs can be funded well beyond the
peak-earnings years.
In this paper, we outline some of the hurdles athletes and entertainers face in very
competitive businesses and present investing frameworks that can be tailored to the
goals of each individual.
3MAy 2015
Please refer to important information, disclosures and qualifications at the end of this material.
A Wealth Optimization Approach for Athletes and Entertainers	MORGAN STANLEY WEALTH MANAGEMENT
Debunking the Myth
Acommon misperception about athletes
andentertainersisthattheyareoverpaid
millionaireswholive livesofluxuryfunded
by endless streams of cash. Although there
are some superstars within both the sports
andentertainmentworldswhoenjoyprolific
earnings,thevastmajorityearnfarless.They
may face truncated earnings windows and
unpredictable income streams, as well as
costs associated with their careers—agents,
publicists,trainersandotherpersonnel,and,
insomecases,supportingfriendsandfamily.
Careers for major team-sports athletes
may last on average three to six years (see
Exhibit 1) and peak-earnings windows for
individual athletes and entertainers may
alsobeshort.Thus,findingwaystopreserve
those earnings for “life after the game”
is incredibly important.
Thereareamultitudeofreasonswhymany
athletes and entertainers find it difficult
to make their money last, but there are a
few recurring themes. For starters, many
go from earning nothing to receiving their
first paycheck in the tens, and in some cases
hundreds, of thousands of dollars. This
new-found wealth can be overwhelming
and hard to manage. Some also fail to
appreciate the difference between gross
pay and net pay; when taxes and personnel
expenses are factored in, athletes and
entertainers’netincomeissignificantlyless
than their headline-grabbing gross income.
Furthermore, athletes and entertainers are
largelymoreaggressive,lessinhibited,more
risk-seeking and more impulsive than the
average person. While these traits may
prove useful in their professions, they can
be detrimental when it comes to making
sound financial decisions.
Where Does the
Money Go?
To be sure, research on athletes' financial
healthissparse.A2009studybySportsIllus-
tratedfoundthattwoyearsafterretirement,
78% of NFL players faced financial stress or
have even gone bankrupt. The same study
concluded that approximately 60% of NBA
players were broke within five years after
they stop playing. Similarly, an April 2015
study by the National Bureau of Economic
Researchreportedthatnearly16%offormer
NFL players file for bankruptcy within 12
years of retirement. The data was drawn
from a sample of 2,016 players drafted by
NFL teams between 1996 and 2003.
Within the professional sports and
entertainment worlds, there is a great
disparity between the haves and have-
nots. Athletes can be segmented into a
few categories: first, the top-tier athletes
enjoy longer careers, earn significantly
more both on the field and through
endorsements, and will likely command
higher appearance and speaking fees
from corporations or private parties.
Such professional athletes typically earn
around $50 million in their careers, while
superstars can easily top $100 million. We
callthislevelofearningspower“BlueChip.”
Below the top tier are athletes whose
level of earnings we call “Playmaker.”
They are not the focal point of their team,
but nonetheless play important roles.
Theseathleteshavesignificantlylessearning
powerthantheirsuperstarteammates,often
have shorter careers and do not earn nearly
as much endorsement revenue.Theaverage
Exhibit 1: Average Career Length in the
Four Major Professional Team Sports
MLB* NHL* NBA* NFL*
0
1
2
3
4
5
6
AverageCareerLength
(years)
5.6
4.8
3.5
5.5
Average Career Length
*Major League Baseball, National Basketball Association, National Hockey League and National Football League;
data is as of 2013, except for NHL, which is as of 2014.
Sources: NFL Players Association, ESPN, University of Colorado and Quant Hockey
Exhibit 2: Median Career Earnings in the
Four Major Professional Team Sports*
*Includes guaranteed contract earnings and signing bonuses; excludes endorsement income
**Major League Baseball, National Basketball Association, National Hockey League and National Football League;
data is as of 2013, except for NHL, which is as of 2014.
Sources: NFL Players Association, ESPN, University of Colorado and Quant Hockey
MLB**NHL**NBA** NFL**
14.4
0
2
4
6
8
10
12
14
$16 Million
MedianCareerEarnings
9.0
6.2
2.7
4MAy 2015
Please refer to important information, disclosures and qualifications at the end of this material.
A Wealth Optimization Approach for Athletes and Entertainers	MORGAN STANLEY WEALTH MANAGEMENT
payofathletesinthefourmajorprofessional
team sports is skewed by the superstars’
multimillion-dollar contracts. The median
career earnings are a better picture of
the earnings of the average professional
athlete (see Exhibit 2). While these figures
are impressive, especially for professional
basketball and hockey players, athletes’ net
earnings may amount to just 50% to 60% of
their gross earnings when taxes and other
expenses are taken into account.
Finally, individual-sport athletes, such
as tennis players, boxers and golfers, face
uncertain cash flows; a strong year that
includes a few tournament wins can yield
theathletemillions,whileaninjury-riddled
orpoor-performanceyearcanleaveaplayer
with significantly diminished earnings. We
describe this as “Wild Card” earnings.
After retirement, athletes often have
second-career opportunities within the
sportsindustry,servingasmediapersonali-
tiesorascoaches,trainersorstaffonprofes-
sionalorcollegeteams.Someformerathletes
also find second careers outside of sports,
oftenrunningtheirownbusinesses,working
inproductsalesorthroughspeakingengage-
ments.However,theearningsdrop-offfrom
their playing days can be severe and often
requires a lifestyle change. In many cases,
there is also a transition period that may
last several years between being employed
in the game and being employed out of the
game, creating an income gap which must
be addressed.
Similar to athletes, entertainers are
segmented into various tiers: “A-list”
performers,mid-levelperformersandthose
that struggle to find consistent work. While
popular entertainers can earn in excess of
$100 million in their careers, the median
annualincomeforproducersanddirectorsis
approximately$70,000peryear,accordingto
2013datafromtheBureauofLaborStatistics
(BLS).Foractors,theBLSreportedanaverage
of about $42,000 per year.
Given the vast disparities between dif-
ferent types of athletes and entertainers, it
is vital to have an investment framework
that can be tailored to meet individual cli-
ents’ goals both during their professional
careers and with an eye on their life out of
the public eye.
The Wealth
Management Process
The wealth management process is an
ongoing, iterative approach that takes into
accountretirementgoals,cash-flowrequire-
ments, investment objectives and risk toler-
ance,aswellasmajorlifeeventssuchasedu-
cationforchildrenorgrandchildren,buying
ahouseorvacationhome,philanthropyand
leavingalegacy.Webelievethisprocesscan
help athletes and entertainers create a road
maptohelpguidethemthroughsomeofthe
majorspendingdecisionsandlifestylechoices
theymakebothduringandaftertheircareers.
This process can help answer questions
such as: “Based on my spending needs, how
much money do I need to invest and how
muchmarketriskamIwillingtotaketoreach
mycashflowgoals?”“Willthisportfoliofund
methroughretirement?”“ShouldIconsider
taking out a loan against my portfolio or a
mortgage against my house to enhance my
cash flow?” “How do I incorporate chari-
table giving and legacy planning into my
portfolio goals?”
Answers to the above questions, and
ongoing discussions with a financial advi-
sor, can help create the foundation upon
which an investment portfolio can be built
(see Exhibit 3).
An Optimization
Framework
In the 2007 paper, “Lifetime Financial
Advice: Human Capital, Asset Allocation
and Insurance,”i
Roger Ibbotson of the Yale
School of Management wrote that “there
is growing recognition among academics
and practitioners that the risk and return
Exhibit 3: The Wealth Management Process
Define
Client Goals
Recommend
Strategy
Construct
Portfolio
Monitor 
Adjust
Source: Morgan Stanley Wealth Management Global Investment Committee
i
 Roger G. Ibbotson, Moshe A. Milevsky, Peng Chen and Kevin X. Zhu, Lifetime Financial Advice: Human Capital, Asset Allocation, and Insurance
(The Research Foundation of CFA Institute, April 2007)
5MAy 2015
Please refer to important information, disclosures and qualifications at the end of this material.
A Wealth Optimization Approach for Athletes and Entertainers	MORGAN STANLEY WEALTH MANAGEMENT
characteristics of human capital—such as
wage and salary profiles—should be taken
into account when building portfolios for
individual investors.” Ibbotson later added
that “a fundamental element in financial
planningadviceisthatyoungerinvestors(or
investors with longer investment horizons)
should invest aggressively.” In essence, Ib-
botson is saying that people that have risky
careers should take the opposite approach
with their investments and vice versa, but
theyshouldalsotakeonriskiftheyareyoung.
Sinceathletesandentertainersareininher-
ently risky careers, and they may also retire
at a young age, how do you balance the two?
Ofcourse,notwoathletesorentertainers
face the same circumstances; each differs
in career experience, family obligations,
appetite for risk and post-retirement goals.
However, reviewing the broad landscape
of athletes and entertainers reveals that
there are several clear divisions within
each respective field. In formulating
investment allocation models for athletes
and entertainers, we considered the follow-
ing classifications. The first tier comprises
thetopplayersinthefourmajorteamsports
and superstar entertainers, with career
earnings that can easily surpass $100 mil-
lion. The next group includes players in the
majorteamsportsandmid-levelentertainers
(e.g., actors in supporting roles); those with
a stable, near decade-long career and ca-
reer earnings ranging from $5 million to
$40 million. Lastly, we consider athletes
and entertainers with lumpy, unpredict-
able cash flows (e.g., tennis players, boxers
and golfers in sports, and those relying on
project-by-projectincomeinentertainment)
whose income is completely dependent on
their performance year by year.
To this end, we have created broad
categories organized around cash flows
and, to some degree, the earnings power of
these particular athletes and entertainers.
These are “Blue Chip,” “Playmaker”and
“Wild Card” (see Exhibit 4). These
are hypothetical asset allocations and
should be viewed as starting points for
athletes and entertainers that fit into
our three categories. Each allocation can
be customized based on an individual’s
risk tolerance, investment horizon and
cash-flow needs as well as the potential
that other investments may already exist.
(A more detailed asset allocation can be
found in the appendix on page 8.) Using
these hypothetical asset allocations we can
showtheamountofexpectedannualincome,
portfolio volatility and the probability of
being fully funded through age 90.
Blue Chip
A Blue Chip’s first and most important fi-
nancialgoaliscapitalpreservation.Inorder
to preserve his or her career earnings, our
BlueChipassetallocationmayincludebonds
and alternatives like precious metals /gold,
real estate investment trusts (REITs) and
master limited partnerships (MLPs) as a
way to provide a hedge against inflation
and lower correlation to the equity market.
An equally important financial goal for
this cohort is growth, both market and
opportunistic. Market growth includes
large-cap and small-cap domestic equities,
as well as global developed and emerging
Exhibit 5: Hypothetical Portfolio Return Characteristics
by Earnings Category
Earnings Category
Investable Assets
Upon Retirement
Expected Yearly
Investment Income* Volatility
Likelihood of
Being Fully
Funded Through
Age 90
Blue Chip–Capital
Preservation
$50,000,000 $2,050,000 6.4% 85%
Blue Chip–High Growth 50,000,000 2,400,000 11.9 85
Playmaker** 5,000,000 215,000 10.0 85
Wild Card 20,000,000 890,000 10.3 85
*Pretax, adjusted for assumed 2% average annual inflation, stated in current dollars; also assumes retirement at age 33.
**Hypothetical portfolio performance for a higher-earning Playmaker can be found in the appendix on page 8. For more
information about the risks to hypothetical performance, please see the Risk Considerations section on page 9 of
this report.
Estimates of future performance may be based on assumptions that may not be met.
Source: Morgan Stanley Wealth Management Global Investment Committee
Exhibit 4: Hypothetical Portfolio Allocation for Each
Earnings Category
Earnings Category Investment Goals Portfolio Allocation (%)
Blue Chip–Capital
Preservation
Capital Preservation
Market Growth
Opportunistic Growth
Fixed Income	 50
Equities	 25	
Alternatives	 20
Cash	 5	
Blue Chip–High Growth
Capital Preservation
Market Growth
Opportunistic Growth
Equities	 60
Alternatives	 20
Fixed Income	 15
Cash	5
Playmaker
Capital Preservation
Balanced Growth
Income
Equities	 55
Fixed Income	 30
Alternatives	 10
Cash	 5
Wild Card
Capital Preservation
Balanced Growth
Income
Equities	 55
Fixed Income	 25
Alternatives	 10
Cash	 10
Source: Morgan Stanley Wealth Management Global Investment Committee
6MAy 2015
Please refer to important information, disclosures and qualifications at the end of this material.
A Wealth Optimization Approach for Athletes and Entertainers	MORGAN STANLEY WEALTH MANAGEMENT
market equities. The Blue Chip’s robust
earnings affords the chance to give up
liquidity and pursue opportunistic growth
in a portion of their investment alloca-
tion, entering into private equity, direct
lending, venture capital, real estate and
even collectibles.
Asset Allocation
Given the Blue Chip’s prolific career earn-
ings, we have taken a two-pronged ap-
proach to the asset allocation process.
Given higher earnings, some Blue Chips
may have a higher tolerance for both
market risk and volatility; thus we have
created a Blue Chip High Growth alloca-
tion, which has at least 60% of the port-
folio in US and global equities. Further-
more, Blue Chips have fewer immediate
liquidity needs, which would allow them
to more heavily invest in alternative as-
set classes such as hedged strategies and
managed futures, MLPs, commodities,
REITs and private equity.
The other approach would be to give up
someexpectedannualincomewhilereducing
the volatility of the portfolio by allocating
more to fixed income investments. This
more conservative approach would provide
less variable returns. With this in mind, we
have created an alternate asset allocation,
“Blue Chip–Capital Preservation,” which
appropriates50%ofassetsintovariousfixed
incomesecurities,whiletheequitiesportion
of the portfolio is reduced to 25%.
Under both of these asset allocations, a
BlueChipretiringatage33with$50million
in assets would have an 85% likelihood of
being fully funded through age 90. While
both approaches have merit, the choice
ultimately depends on the Blue Chip’s will-
ingness to stomach volatility.
Playmaker
WhiletheaverageAmericanworksuntilhis
or her mid 60s, the Playmaker athlete’s ca-
reer typically lasts no longer than a decade.
True,Playmakersarewellcompensated,but
the unique challenges posed by earning a
lifetime’s worth of salary in a relatively few
yearsrequiresthataPlaymakerbeespecially
vigilant in adhering to a financial plan.
In addition to capital preservation, a
Playmaker has two other financial goals:
income and balanced growth. Playmakers
have to make the salary they earn from
their playing career last throughout their
lengthy retirement.
Asset Allocation
Playmakers have the same ultralong
retirement horizon as that of Blue
Chips; however given that Playmakers’
career earnings are less than those of
the Blue Chips, Playmakers may not have
the same flexibility in their approach to
asset allocation.
Playmakers are long-term investors, and
their assets should be skewed toward equi-
ties. While our model tilts toward the US
and other developed markets, it also allows
for smaller, more-targeted investments in
emergingmarketequities.Asahedgeagainst
market volatility, Playmakers should con-
sider allocating 10% of their portfolio to
alternative investment asset classes such as
hedged strategies, managed futures, MLPs,
commodities, REITs and private equity.
UnlikeBlueChips,Playmakerswilllikely
need investment income throughout their
retirement. That is why the model has a
30% allocation to fixed income securities,
including tax-free municipal securities,
which should provide a steady, dependable
source of income. Lastly, Playmakers
should keep a small portion, up to 5%
of their portfolio, in cash for immediate
liquidity. Using this asset allocation, a
Playmaker retiring at age 33 with $5
million would have an 85% likelihood
of being fully funded through age 90
(see Exhibit 5, page 5).
Wild Card
Wild Cards’ cash f lows are, as the
classification suggests, unpredictable. As
such, it is vital that such individuals adhere
to a plan that will meet their two main
financial goals: capital preservation and
income. However, as their income grows
they should consider adding to the growth
portionoftheirportfoliotohelpbuildtoward
their retirement goals.
Asset Allocation
WhiletheWildCardhasthesameextended
retirement horizon as the Blue Chip and
Playmaker, athletes and entertainers with
lumpy, unpredictable cash flows have the
greatest need for low portfolio volatility
and reliable investment income while their
careers are growing.
Time-segmented asset allocation could
be a useful approach for Wild Cards.
This involves segregating retirement
assets into different portfolios to be drawn
on sequentially to fund retirement in-
come needs, with the size and risk orien-
tation of the portfolios dependent on the
For Illustrative purposes only
Source: Morgan Stanley Wealth Management Global Investment Committee
Income Segment �
Income Segment �
Income Segment �
Income Segment �
Legacy Segment
Income Segment 1
Assumption: Strategic
Horizon: 7 Years
Annual Return
Target: 2.3%
Income Segment 2
Assumption: Blend
Horizon: 15 Years
Annual Return
Target: 5.2%
Income Segment 3
Assumption: Blend
Horizon: 22 Years
Annual Return
Target: 6.8%
Income Segment 4
Assumption: Blend
Horizon: 30 Years
Annual Return
Target: 8.0%
Legacy Segment
Assumption: Secular
Horizon: 50 Years
Annual Return
Target: 8.9%
Invested for Income
Invested for Growth
Exhibit 6: Time-Segmented Asset Allocation Process
7MAy 2015
Please refer to important information, disclosures and qualifications at the end of this material.
A Wealth Optimization Approach for Athletes and Entertainers	MORGAN STANLEY WEALTH MANAGEMENT
Exhibit 7: Historical Range of Returns for Four Investment Horizons
Source: Ibbotson Associates, Morgan Stanley Wealth Management Global Investment Committee as of Dec. 31, 2014
-��
-��
-��
�.�
�.�
��.�
�.�
-�.�
��.�
��
�
��
��
��
��%
-��.�
��.�
��.�
�.�
�.�
��.�
��.�
��.�
��.�
-�.�
��.�
��.�
�.�
�.� �.�
�.�
-�.�
�.�
�.�
��.�
�.�
�.�
�.�
�.�
��.� ��.�
��.�
�.��.�
��.�
��.�
�.��.�
�.� �.�
�.�
��.�
��.�
��.�
��.�
��.�
-�.�
-�.�
�.�
�.�
�.� �.�
��.�
��.�
��.�
��.�
��.�
-��.�
-��.�
One-Year Five-Year
Horizon
��-Year ��-Year
AnnualizedReturn
Bucket � MedianBucket � Bucket � Bucket � Bucket �
size and timing of expected distributions.
Essentially, this approach starts with a
very-low-volatilityportfolioanddrawsupon
this for income and spending needs while
the riskier, higher-growth portfolios are
managed so that they will be available later
in the individual's career. As they progress
through their careers, Wild Cards go from
a lower-volatility portfolio that is orient-
ed to fixed income and add growth com-
ponents to this as their careers progress
and their earnings increase.
The illustration below (see Exhibit 6)
depictsasimpleexampleoftime-segmented
asset allocation using four fixed-length
periods and a legacy segment thereafter.ii
Key to this approach is the premise that
riskyassetswithvolatilereturnstreamsand
higherexpectedreturnsarefarlessriskyina
long-term context than in the short term. In
theshortterm,riskierassetsexposeinvestors
tothelargestlosses(seeExhibit7).However,
the result flips when these same assets are
held for a prolonged period of time. As can
be seen in the chart, portfolios that feature
the greatest downsides over one-year and
five-yearhorizons(notedbythelowerborder
of the floating bars), actually show the least
downsideovera20-yearhorizonwheretheir
“worst case” returns are superior.
For the Wild Cards, when liquidity needs
ariseintheearlieryearsoftheircareersthat
are larger than anticipated, security-based
loans could allow for a low-cost means of
fundingunexpectedcashneedswithoutliq-
uidatinglonger-durationassetsprematurely,
or at unfavorable prices.
Similar to the Playmaker, the Wild Card
investor needs to focus mainly on the US
and other developed market equities, with
small, selective allocations to the emerging
markets.Moreover,a10%allocationtoalter-
nativeinvestments,suchashedgedstrategies
and managed futures, MLPs, commodities,
REITsandprivateequity,couldbedeployed
to help offset market volatility.
Furthermore, the volatile nature of
Wild Cards’ careers likely requires that
they earn a meaningful income from their
investments. Thus, we recommend that at
least 25% of assets are allocated to fixed
incomesecurities,includingtax-freemunis,
high yield and investment grade bonds.
Lastly, Wild Cards should keep a slightly
ii
The legacy segment is the final phase of time-segmented asset allocation; the legacy segment holds the longest-term assets and allocates any funds that
remain after the bucketing process for a wealth transfer to the next generation. In the time-segmented approach, if a segment depletes before the time
horizon it was meant to cover ends, funds are drawn from the next segment in the sequence to cover withdrawals. When all segments are depleted, the
legacy fund will be drawn upon. Conversely, if excess funds remain at the end of a segment’s time period, these funds will be allocated to the legacy fund.
8MAy 2015
Please refer to important information, disclosures and qualifications at the end of this material.
A Wealth Optimization Approach for Athletes and Entertainers	MORGAN STANLEY WEALTH MANAGEMENT
larger portion of their portfolio in cash, as
much as 10%, and/or consider a securities-
based lending facility, should an immediate
liquidity need emerge.*
A Wild Card, retiring at age 33 with
$20 million and following such an asset
allocationmodelwillhavean85%likelihood
of being fully funded through age 90.
Conclusion
Athletes and entertainers face a unique set
of challenges preparing for a retirement
window that can be two-to-three times
longer than that of the average investor.
However, a planned approach with the
right asset allocation framework can help
athletes and entertainers preserve and, in
some cases, enhance their career earnings.
Perhaps more important, this approach can
helptheseinvestorsmaintainacomfortable
living during their retirement, fulfill their
philanthropic objectives and provide a
strong platform for transferring wealth to
the next generation.
*Many athletes and entertainers can benefit from a strategic use of credit to meet their monthly liquidity needs. By using credit in the form of securities-based
loans as a strategic financing option in concert with investment management, athletes and entertainers may be able to avoid or reduce: (1) tax and transaction
costs; (2) overall portfolio risk exposures; (3) concentration risk; and 4) reducing strategic cash reserves. Furthermore, taking an integrated approach that
includes suitable liabilities management may help in managing cash inflows and outflows, if they are mismatched or as liquidity needs arise.
Securities-based loans allow a client to borrow funds by using the existing portfolio securities as collateral rather than selling the securities to raise cash.
Investors who engage in securities-based lending in lieu of selling securities are able to continue to earn income from their investment portfolio, take
advantage of reinvestment opportunities and remain committed to their long-term investment strategy. Securities-based loans may be used to help pay
for education, buy a car or put an extension on a house or even to pay for unexpected medical care. For more information about the risks to securities-based
loans, please see the Risk Considerations section on page 9 of this report.
9MAy 2015
Please refer to important information, disclosures and qualifications at the end of this material.
A Wealth Optimization Approach for Athletes and Entertainers	MORGAN STANLEY WEALTH MANAGEMENT
Appendix
Recommended Asset Allocation
Asset Class Wild Card
Blue Chip–High
Growth
Blue Chip–Capital
Preservation Playmaker*
Secular Expected
Return Assumption
Cash 10.0% 5.0% 5.0% 5.0% 2.7%
Total Cash 10.0 5.0 5.0 5.0
Short-Term Fixed Income 0.0 0.0 10.0 0.0 3.6
US Fixed Income 15.0 10.0 30.0 20.0 4.3
International Fixed Income 0.0 0.0 5.0 0.0 4.5
Inflation-Linked Securities 0.0 0.0 0.0 0.0 4.3
High Yield 10.0 5.0 5.0 10.0 8.0
Emerging Markets Fixed Income 0.0 0.0 0.0 0.0 6.5
Total Fixed Income 25.0 15.0 50.0 30.0
US Large-Cap Growth Equity 7.5 7.5 2.5 7.5 9.9
US Large-Cap Value Equity 7.5 7.5 2.5 7.5 9.5
US Mid-Cap Growth Equity 5.0 5.0 2.0 5.0 11.1
US Mid-Cap Value Equity 5.0 5.0 2.0 5.0 10.3
US Small-Cap Growth Equity 2.5 5.0 2.0 2.5 12.0
US Small-Cap Value Equity 2.5 5.0 2.0 2.5 11.1
Europe Equity 7.5 7.5 4.0 10.0 9.9
Japan Equity 7.5 7.5 4.0 10.0 9.1
Asia Pacific ex Japan Equity 0.0 0.0 0.0 0.0 11.4
Emerging Markets Equity 10.0 10.0 4.0 5.0 12.3
Total Equities 55.0 60.0 25.0 55.0
Real Estate Investment Trusts 2.0 3.0 3.0 2.0 9.2
Commodities 2.0 3.0 3.0 2.0 5.4
Master Limited Partnerships 2.0 3.0 3.0 2.0 11.3
Hedged Strategies 2.0 3.0 3.0 2.0 7.3
Managed Futures 2.0 3.0 3.0 2.0 6.5
Private Equity 0.0 5.0 5.0 0.0 13.9
Private Real Estate Funds 0.0 0.0 0.0 0.0 9.8
Total Alternative Investments 10.0 20.0 20.0 10.0
TOTAL 100.0 100.0 100.0 100.0
Return Forecast 8.3% 9.2% 6.9% 8.2%
Volatility 10.3% 11.9% 6.4% 10.0%
Sharpe Ratio 0.54 0.54 0.65 0.55
Detailed Asset Allocation
*A Playmaker who retires with $15 million and follows the asset allocation for a Playmaker can expect to see yearly investment income of $650,000, experience 10.0% annual
volatility and have an 85% likelihood of being funded through age 90.
Estimates of future performance may be based on assumptions that may not be met.
Source: Morgan Stanley Wealth Management as of Jan. 31, 2015
10MAy 2015
Please refer to important information, disclosures and qualifications at the end of this material.
A Wealth Optimization Approach for Athletes and Entertainers	MORGAN STANLEY WEALTH MANAGEMENT
Risk Considerations
Hypothetical Performance
General: Hypothetical performance should not be considered a guarantee of future performance or a guarantee of achieving overall financial objectives.
Asset allocation and diversification do not assure a profit or protect against loss in declining financial markets.
Hypothetical performance results have inherent limitations. The performance shown here is simulated performance, not investment results from an actual
portfolio or actual trading. There can be large differences between hypothetical and actual performance results achieved by a particular asset allocation.
Despite the limitations of hypothetical performance, these hypothetical performance results may allow clients and Financial Advisors to obtain a sense of
the risk / return trade-off of different asset allocation constructs.
Investing in the market entails the risk of market volatility. The value of all types of securities may increase or decrease over varying time periods.
This analysis does not purport to recommend or implement an investment strategy. Financial forecasts, rates of return, risk, inflation, and other assumptions
may be used as the basis for illustrations in this analysis. They should not be considered a guarantee of future performance or a guarantee of achieving
overall financial objectives. No analysis has the ability to accurately predict the future, eliminate risk or guarantee investment results. As investment returns,
inflation, taxes, and other economic conditions vary from the assumptions used in this analysis, your actual results will vary (perhaps significantly) from
those presented in this analysis.
The assumed return rates in this analysis are not reflective of any specific investment and do not include any fees or expenses that may be incurred by
investing in specific products. The actual returns of a specific investment may be more or less than the returns used in this analysis. The return assumptions
are based on hypothetical rates of return of securities indices, which serve as proxies for the asset classes. Moreover, different forecasts may choose
different indices as a proxy for the same asset class, thus influencing the return of the asset class.
Securities-Based Loans
Borrowing against securities may not be suitable for everyone. You should be aware that securities-based loans involve a high degree of risk and that market
conditions can magnify any potential for loss. Most importantly, you need to understand that: (1) Sufficient collateral must be maintained to support your
loan(s) and to take future advances; (2) You may have to deposit additional cash or eligible securities on short notice; (3) Some or all of your securities may
be sold without prior notice in order to maintain account equity at required maintenance levels. You will not be entitled to choose the securities that will
be sold. These actions may interrupt your long-term investment strategy and may result in adverse tax consequences or in additional fees being assessed;
(4) Typically a lender reserves the right not to fund any advance request due to insufficient collateral or for any other reason except for any portion of a
securities-based loan that is identified as a committed facility; (5) Typically a lender reserves the right to increase your collateral maintenance requirements
at any time without notice; and (6) Typically a lender reserves the right to call securities-based loans at any time and for any reason.
With the exception of a margin loan, the proceeds from securities based loan products may not be used to purchase, trade, or carry margin stock (or
securities); repay margin debt that was used to purchase, trade or carry margin stock (or securities); and cannot be deposited any brokerage account.
To be eligible for a securities-based loan, a client must typically have a brokerage account that contains eligible securities, which shall serve as collateral for
the securities-based loan.
SHARPE RATIO This statistic measures a
portfolio’s rate of return based on the risk
it assumed and is often referred to as its
risk-adjusted performance. Using standard
deviation and returns in excess of the returns
of T-bills, it determines reward per unit of
risk. This measurement can help determine if
the portfolio is reaching its goal of increasing
returns while managing risk.
VOLATILITY This is a statistical measure of
the dispersion of returns for a given security or
market index. Volatility can either be measured
by using the standard deviation or variance
between returns from that same security
or market index. Commonly, the higher the
volatility, the riskier the security.
Glossary
11MAy 2015
Please refer to important information, disclosures and qualifications at the end of this material.
A Wealth Optimization Approach for Athletes and Entertainers	MORGAN STANLEY WEALTH MANAGEMENT
Alternative Investments
An investment in alternative investments can be highly illiquid, is speculative, and not suitable for all investors. Investing in alternative investments is only
intended for experienced and sophisticated investors who are willing to bear the high economic risks associated with such an investment. Investors should
carefully review and consider potential risks before investing. Some of these risks may include:
•	 loss of all or a substantial portion of the investment due to leveraging, short-selling, or other speculative practices;
•	 lack of liquidity in that there may be no secondary market for the fund and none is expected to develop;
•	 volatility of returns;
•	 restrictions on transferring interests;
•	 potential lack of diversification and resulting higher risk due to concentration of trading authority when a single advisor is utilized;
•	 absence of information regarding valuations and pricing;
•	 complex tax structures and delays in tax reporting;
•	 less regulation and higher fees than mutual funds; and
•	 manager risk.
Individual funds will have specific risks related to their investment programs that will vary from fund to fund.
Actual results may vary and past performance is no guarantee of future results.
MLPs
Master Limited Partnerships (MLPs) are limited partnerships or limited liability companies that are taxed as partnerships and whose interests (limited
partnership units or limited liability company units) are traded on securities exchanges like shares of common stock. Currently, most MLPs operate in the
energy, natural resources or real estate sectors. Investments in MLP interests are subject to the risks generally applicable to companies in the energy and
natural resources sectors, including commodity pricing risk, supply and demand risk, depletion risk and exploration risk.
Individual MLPs are publicly traded partnerships that have unique risks related to their structure. These include, but are not limited to, their reliance on the
capital markets to fund growth, adverse ruling on the current tax treatment of distributions (typically mostly tax deferred), and commodity volume risk.
The potential tax benefits from investing in MLPs depend on their being treated as partnerships for federal income tax purposes and, if the MLP is deemed
to be a corporation, then its income would be subject to federal taxation at the entity level, reducing the amount of cash available for distribution to the
fund which could result in a reduction of the fund’s value.
MLPs carry interest rate risk and may underperform in a rising interest rate environment. MLP funds accrue deferred income taxes for future tax liabilities
associated with the portion of MLP distributions considered to be a tax-deferred return of capital and for any net operating gains as well as capital
appreciation of its investments; this deferred tax liability is reflected in the daily NAV; and, as a result, the MLP fund’s after-tax performance could differ
significantly from the underlying assets even if the pre-tax performance is closely tracked.
International investing entails greater risk, as well as greater potential rewards compared to U.S. investing. These risks include political and economic
uncertainties of foreign countries as well as the risk of currency fluctuations. These risks are magnified in countries with emerging markets, since these
countries may have relatively unstable governments and less established markets and economies.
Managed futures investments are speculative, involve a high degree of risk, use significant leverage, have limited liquidity and/or may be generally illiquid,
may incur substantial charges, may subject investors to conflicts of interest, and are usually suitable only for the risk capital portion of an investor’s
portfolio. Before investing in any partnership and in order to make an informed decision, investors should read the applicable prospectus and/or offering
documents carefully for additional information, including charges, expenses, and risks. Managed futures investments are not intended to replace equities or
fixed income securities but rather may act as a complement to these asset categories in a diversified portfolio.
Investing in commodities entails significant risks. Commodity prices may be affected by a variety of factors at any time, including but not limited to,
(i) changes in supply and demand relationships, (ii) governmental programs and policies, (iii) national and international political and economic events, war and
terrorist events, (iv) changes in interest and exchange rates, (v) trading activities in commodities and related contracts, (vi) pestilence, technological change
and weather, and (vii) the price volatility of a commodity. In addition, the commodities markets are subject to temporary distortions or other disruptions due
to various factors, including lack of liquidity, participation of speculators and government intervention.
Physical precious metals are non-regulated products. Precious metals are speculative investments, which may experience short-term and long term price
volatility. The value of precious metals investments may fluctuate and may appreciate or decline, depending on market conditions. If sold in a declining
market, the price you receive may be less than your original investment. Unlike bonds and stocks, precious metals do not make interest or dividend
payments. Therefore, precious metals may not be suitable for investors who require current income. Precious metals are commodities that should be
safely stored, which may impose additional costs on the investor. The Securities Investor Protection Corporation (“SIPC”) provides certain protection for
customers’ cash and securities in the event of a brokerage firm’s bankruptcy, other financial difficulties, or if customers’ assets are missing. SIPC insurance
does not apply to precious metals or other commodities.
Bonds are subject to interest rate risk. When interest rates rise, bond prices fall; generally the longer a bond's maturity, the more sensitive it is to this risk.
Bonds may also be subject to call risk, which is the risk that the issuer will redeem the debt at its option, fully or partially, before the scheduled maturity
date. The market value of debt instruments may fluctuate, and proceeds from sales prior to maturity may be more or less than the amount originally
invested or the maturity value due to changes in market conditions or changes in the credit quality of the issuer. Bonds are subject to the credit risk of the
issuer. This is the risk that the issuer might be unable to make interest and/or principal payments on a timely basis. Bonds are also subject to reinvestment
risk, which is the risk that principal and/or interest payments from a given investment may be reinvested at a lower interest rate.
Bonds rated below investment grade may have speculative characteristics and present significant risks beyond those of other securities, including greater
credit risk and price volatility in the secondary market. Investors should be careful to consider these risks alongside their individual circumstances, objectives
and risk tolerance before investing in high-yield bonds. High yield bonds should comprise only a limited portion of a balanced portfolio.
12MAy 2015
Please refer to important information, disclosures and qualifications at the end of this material.
A Wealth Optimization Approach for Athletes and Entertainers	MORGAN STANLEY WEALTH MANAGEMENT
Interest on municipal bonds is generally exempt from federal income tax; however, some bonds may be subject to the alternative minimum tax (AMT).
Also, municipal bonds acquired in the secondary market at a discount may be subject to the market discount tax provisions, and therefore could give rise
to taxable income. Typically, state tax-exemption applies if securities are issued within one’s state of residence and, if applicable, local tax-exemption applies
if securities are issued within one’s city of residence. The tax-exempt status of municipal securities may be changed by legislative process, which could affect
their value and marketability.
Treasury Inflation Protection Securities’ (TIPS) coupon payments and underlying principal are automatically increased to compensate for inflation by
tracking the consumer price index (CPI). While the real rate of return is guaranteed, TIPS tend to offer a low return. Because the return of TIPS is linked to
inflation, TIPS may significantly underperform versus conventional U.S. Treasuries in times of low inflation.
Equity securities may fluctuate in response to news on companies, industries, market conditions and general economic environment.
Investing in foreign emerging markets entails greater risks than those normally associated with domestic markets, such as political, currency, economic and
market risks.
Investing in smaller companies involves greater risks not associated with investing in more established companies, such as business risk, significant stock
price fluctuations and illiquidity.
Asset allocation and diversification do not assure a profit or protect against loss in declining financial markets.
REITs investing risks are similar to those associated with direct investments in real estate: property value fluctuations, lack of liquidity, limited
diversification and sensitivity to economic factors such as interest rate changes and market recessions.
Dividend income from REITs will generally not be treated as qualified dividend income and therefore will not be eligible for reduced rates of taxation.
Rebalancing does not protect against a loss in declining financial markets. There may be a potential tax implication with a rebalancing strategy. Investors
should consult with their tax advisor before implementing such a strategy.
Growth investing does not guarantee a profit or eliminate risk. The stocks of these companies can have relatively high valuations. Because of these high
valuations, an investment in a growth stock can be more risky than an investment in a company with more modest growth expectations.
Value investing does not guarantee a profit or eliminate risk. Not all companies whose stocks are considered to be value stocks are able to turn their
business around or successfully employ corrective strategies which would result in stock prices that do not rise as initially expected.
Because of their narrow focus, sector investments tend to be more volatile than investments that diversify across many sectors and companies.
A Wealth Optimization Approach for Athletes and Entertainers	MORGAN STANLEY WEALTH MANAGEMENT
© 2015 Morgan Stanley Smith Barney LLC. Member SIPC. CS 8239252 05/15
Disclosures
The author(s) (if any authors are noted) principally responsible for the preparation of this material receive compensation based upon various factors, including
quality and accuracy of their work, firm revenues (including trading and capital markets revenues), client feedback and competitive factors. Morgan Stanley
Wealth Management is involved in many businesses that may relate to companies, securities or instruments mentioned in this material.
The views expressed herein are those of the author and do not necessarily reflect the views of Morgan Stanley Wealth Management or its affiliates. All
opinions are subject to change without notice. Neither the information provided nor any opinion expressed constitutes a solicitation for the purchase or
sale of any security. Past performance is no guarantee of future results.
This material has been prepared for informational purposes only and is not an offer to buy or sell or a solicitation of any offer to buy or sell any security/
instrument, or to participate in any trading strategy. Any such offer would be made only after a prospective investor had completed its own independent
investigation of the securities, instruments or transactions, and received all information it required to make its own investment decision, including, where
applicable, a review of any offering circular or memorandum describing such security or instrument. That information would contain material information not
contained herein and to which prospective participants are referred. This material is based on public information as of the specified date, and may be stale
thereafter. We have no obligation to tell you when information herein may change. We make no representation or warranty with respect to the accuracy
or completeness of this material. Morgan Stanley Wealth Management has no obligation to provide updated information on the securities/instruments
mentioned herein.
The securities/instruments discussed in this material may not be suitable for all investors. The appropriateness of a particular investment or strategy will
depend on an investor’s individual circumstances and objectives. Morgan Stanley Wealth Management recommends that investors independently evaluate
specific investments and strategies, and encourages investors to seek the advice of a financial advisor. The value of and income from investments may vary
because of changes in interest rates, foreign exchange rates, default rates, prepayment rates, securities/instruments prices, market indexes, operational or
financial conditions of companies and other issuers or other factors. Estimates of future performance are based on assumptions that may not be realized.
Actual events may differ from those assumed and changes to any assumptions may have a material impact on any projections or estimates. Other events
not taken into account may occur and may significantly affect the projections or estimates. Certain assumptions may have been made for modeling purposes
only to simplify the presentation and/or calculation of any projections or estimates, and Morgan Stanley Wealth Management does not represent that any
such assumptions will reflect actual future events. Accordingly, there can be no assurance that estimated returns or projections will be realized or that
actual returns or performance results will not materially differ from those estimated herein.
This material should not be viewed as advice or recommendations with respect to asset allocation or any particular investment. This information is not
intended to, and should not, form a primary basis for any investment decisions that you may make. Morgan Stanley Wealth Management is not acting as a
fiduciary under either the Employee Retirement Income Security Act of 1974, as amended or under section 4975 of the Internal Revenue Code of 1986 as
amended in providing this material.
Morgan Stanley Smith Barney LLC, its affiliates and Morgan Stanley Financial Advisors do not provide legal or tax advice. Each client should always
consult his/her personal tax and/or legal advisor for information concerning his/her individual situation and to learn about any potential tax or
other implications that may result from acting on a particular recommendation.
This material is disseminated in Australia to “retail clients” within the meaning of the Australian Corporations Act by Morgan Stanley Wealth Management
Australia Pty Ltd (A.B.N. 19 009 145 555, holder of Australian financial services license No. 240813).
Morgan Stanley Wealth Management is not incorporated under the People's Republic of China (“PRC”) law and the material in relation to this report is
conducted outside the PRC. This report will be distributed only upon request of a specific recipient. This report does not constitute an offer to sell or
the solicitation of an offer to buy any securities in the PRC. PRC investors must have the relevant qualifications to invest in such securities and must be
responsible for obtaining all relevant approvals, licenses, verifications and or registrations from PRC's relevant governmental authorities.
If your financial adviser is based in Australia, Dubai, Germany, Italy, Switzerland or the United Kingdom, then please be aware that this report is being
distributed by the Morgan Stanley entity where your financial adviser is located, as follows: Australia: Morgan Stanley Wealth Management Australia Pty
Ltd (ABN 19 009 145 555, AFSL No. 240813); Dubai: Morgan Stanley Private Wealth Management Limited (DIFC Branch), regulated by the Dubai Financial
Services Authority (the DFSA), and is directed at Professional Clients only, as defined by the DFSA; Germany: Morgan Stanley Private Wealth Management
Limited, Munich branch authorized by the Prudential Regulation Authority and regulated by the Financial Conduct Authority and the Bundesanstalt fuer
Finanzdienstleistungsaufsicht; Italy: Morgan Stanley Bank International Limited, Milan Branch, authorized by the Prudential Regulation Authority and
regulated by the Financial Conduct Authority and the Prudential Regulation Authority, the Banca d'Italia and the Commissione Nazionale per Le Societa' E
La Borsa; Switzerland: Bank Morgan Stanley AG regulated by the Swiss Financial Market Supervisory Authority; or United Kingdom: Morgan Stanley Private
Wealth Management Ltd, authorized and regulated by the Financial Conduct Authority, approves for the purposes of section 21 of the Financial Services
and Markets Act 2000 this material for distribution in the United Kingdom.
Morgan Stanley Wealth Management is not acting as a municipal advisor to any municipal entity or obligated person within the meaning of Section 15B of
the Securities Exchange Act (the “Municipal Advisor Rule”) and the opinions or views contained herein are not intended to be, and do not constitute, advice
within the meaning of the Municipal Advisor Rule.
This material is disseminated in the United States of America by Morgan Stanley Wealth Management.
Third-party data providers make no warranties or representations of any kind relating to the accuracy, completeness, or timeliness of the data they provide
and shall not have liability for any damages of any kind relating to such data.
This material, or any portion thereof, may not be reprinted, sold or redistributed without the written consent of Morgan Stanley Smith Barney LLC.

Complex Wealth Management - Pro Athletes & Entertainers

  • 1.
    GLOBAL INVESTMENT COMMITTEEMAy 2015 introduction authors Lisa Shalett Head of Investment and Portfolio Strategies Morgan Stanley Wealth Management   JON MACKAY Market Strategist Morgan Stanley Wealth Management   ZACHARY Apoian Senior Asset Allocation Strategist Morgan Stanley Wealth Management A Wealth Optimization Approach for Athletes and Entertainers The careers of athletes and entertainers can be short. Injuries may sideline athletes at any time, while social and/or artistic trends can erode an entertainer’s appeal. For both, peak earnings can happen early in life, and compensation may be entirely unpredictable. Due to these factors, budgeting for ongoing annual expenses and developing a long-term investment strategy is complex. In this paper, we lay out a holistic and integrated approach that can be tailored to the goals of each individual. Follow us on Twitter @MS_CIOWilson Please refer to important information, disclosures and qualifications at the end of this material.
  • 2.
    2MAy 2015 Please referto important information, disclosures and qualifications at the end of this material. A Wealth Optimization Approach for Athletes and Entertainers MORGAN STANLEY WEALTH MANAGEMENT Executive Summary The careers and earnings profiles of athletes and entertainers are unusual compared with traditional forms of employment, for which career length and compensation are somewhat predictable. Athletes and entertainers’ careers can be short; injuries may sideline athletes at any time, and social and/or artistic trends can erode an entertainer’s appeal. For both, peak earnings can happen very early in their careers as many come into sudden wealth when they sign their first professional contracts. Pay schedules may be entirely unpredictable, or payments may only occur when the sport is in season. Due to these factors, budgeting for ongoing annual expenses, assessing large capital expenditures and developing a long-term investment strategy is complex and absolutely critical to wealth optimization. Envisioning and planning for the postcareer years also present unique challenges. Thus, a holistic and integrated approach to financial planning and investing is necessary so that lifestyle needs can be funded well beyond the peak-earnings years. In this paper, we outline some of the hurdles athletes and entertainers face in very competitive businesses and present investing frameworks that can be tailored to the goals of each individual.
  • 3.
    3MAy 2015 Please referto important information, disclosures and qualifications at the end of this material. A Wealth Optimization Approach for Athletes and Entertainers MORGAN STANLEY WEALTH MANAGEMENT Debunking the Myth Acommon misperception about athletes andentertainersisthattheyareoverpaid millionaireswholive livesofluxuryfunded by endless streams of cash. Although there are some superstars within both the sports andentertainmentworldswhoenjoyprolific earnings,thevastmajorityearnfarless.They may face truncated earnings windows and unpredictable income streams, as well as costs associated with their careers—agents, publicists,trainersandotherpersonnel,and, insomecases,supportingfriendsandfamily. Careers for major team-sports athletes may last on average three to six years (see Exhibit 1) and peak-earnings windows for individual athletes and entertainers may alsobeshort.Thus,findingwaystopreserve those earnings for “life after the game” is incredibly important. Thereareamultitudeofreasonswhymany athletes and entertainers find it difficult to make their money last, but there are a few recurring themes. For starters, many go from earning nothing to receiving their first paycheck in the tens, and in some cases hundreds, of thousands of dollars. This new-found wealth can be overwhelming and hard to manage. Some also fail to appreciate the difference between gross pay and net pay; when taxes and personnel expenses are factored in, athletes and entertainers’netincomeissignificantlyless than their headline-grabbing gross income. Furthermore, athletes and entertainers are largelymoreaggressive,lessinhibited,more risk-seeking and more impulsive than the average person. While these traits may prove useful in their professions, they can be detrimental when it comes to making sound financial decisions. Where Does the Money Go? To be sure, research on athletes' financial healthissparse.A2009studybySportsIllus- tratedfoundthattwoyearsafterretirement, 78% of NFL players faced financial stress or have even gone bankrupt. The same study concluded that approximately 60% of NBA players were broke within five years after they stop playing. Similarly, an April 2015 study by the National Bureau of Economic Researchreportedthatnearly16%offormer NFL players file for bankruptcy within 12 years of retirement. The data was drawn from a sample of 2,016 players drafted by NFL teams between 1996 and 2003. Within the professional sports and entertainment worlds, there is a great disparity between the haves and have- nots. Athletes can be segmented into a few categories: first, the top-tier athletes enjoy longer careers, earn significantly more both on the field and through endorsements, and will likely command higher appearance and speaking fees from corporations or private parties. Such professional athletes typically earn around $50 million in their careers, while superstars can easily top $100 million. We callthislevelofearningspower“BlueChip.” Below the top tier are athletes whose level of earnings we call “Playmaker.” They are not the focal point of their team, but nonetheless play important roles. Theseathleteshavesignificantlylessearning powerthantheirsuperstarteammates,often have shorter careers and do not earn nearly as much endorsement revenue.Theaverage Exhibit 1: Average Career Length in the Four Major Professional Team Sports MLB* NHL* NBA* NFL* 0 1 2 3 4 5 6 AverageCareerLength (years) 5.6 4.8 3.5 5.5 Average Career Length *Major League Baseball, National Basketball Association, National Hockey League and National Football League; data is as of 2013, except for NHL, which is as of 2014. Sources: NFL Players Association, ESPN, University of Colorado and Quant Hockey Exhibit 2: Median Career Earnings in the Four Major Professional Team Sports* *Includes guaranteed contract earnings and signing bonuses; excludes endorsement income **Major League Baseball, National Basketball Association, National Hockey League and National Football League; data is as of 2013, except for NHL, which is as of 2014. Sources: NFL Players Association, ESPN, University of Colorado and Quant Hockey MLB**NHL**NBA** NFL** 14.4 0 2 4 6 8 10 12 14 $16 Million MedianCareerEarnings 9.0 6.2 2.7
  • 4.
    4MAy 2015 Please referto important information, disclosures and qualifications at the end of this material. A Wealth Optimization Approach for Athletes and Entertainers MORGAN STANLEY WEALTH MANAGEMENT payofathletesinthefourmajorprofessional team sports is skewed by the superstars’ multimillion-dollar contracts. The median career earnings are a better picture of the earnings of the average professional athlete (see Exhibit 2). While these figures are impressive, especially for professional basketball and hockey players, athletes’ net earnings may amount to just 50% to 60% of their gross earnings when taxes and other expenses are taken into account. Finally, individual-sport athletes, such as tennis players, boxers and golfers, face uncertain cash flows; a strong year that includes a few tournament wins can yield theathletemillions,whileaninjury-riddled orpoor-performanceyearcanleaveaplayer with significantly diminished earnings. We describe this as “Wild Card” earnings. After retirement, athletes often have second-career opportunities within the sportsindustry,servingasmediapersonali- tiesorascoaches,trainersorstaffonprofes- sionalorcollegeteams.Someformerathletes also find second careers outside of sports, oftenrunningtheirownbusinesses,working inproductsalesorthroughspeakingengage- ments.However,theearningsdrop-offfrom their playing days can be severe and often requires a lifestyle change. In many cases, there is also a transition period that may last several years between being employed in the game and being employed out of the game, creating an income gap which must be addressed. Similar to athletes, entertainers are segmented into various tiers: “A-list” performers,mid-levelperformersandthose that struggle to find consistent work. While popular entertainers can earn in excess of $100 million in their careers, the median annualincomeforproducersanddirectorsis approximately$70,000peryear,accordingto 2013datafromtheBureauofLaborStatistics (BLS).Foractors,theBLSreportedanaverage of about $42,000 per year. Given the vast disparities between dif- ferent types of athletes and entertainers, it is vital to have an investment framework that can be tailored to meet individual cli- ents’ goals both during their professional careers and with an eye on their life out of the public eye. The Wealth Management Process The wealth management process is an ongoing, iterative approach that takes into accountretirementgoals,cash-flowrequire- ments, investment objectives and risk toler- ance,aswellasmajorlifeeventssuchasedu- cationforchildrenorgrandchildren,buying ahouseorvacationhome,philanthropyand leavingalegacy.Webelievethisprocesscan help athletes and entertainers create a road maptohelpguidethemthroughsomeofthe majorspendingdecisionsandlifestylechoices theymakebothduringandaftertheircareers. This process can help answer questions such as: “Based on my spending needs, how much money do I need to invest and how muchmarketriskamIwillingtotaketoreach mycashflowgoals?”“Willthisportfoliofund methroughretirement?”“ShouldIconsider taking out a loan against my portfolio or a mortgage against my house to enhance my cash flow?” “How do I incorporate chari- table giving and legacy planning into my portfolio goals?” Answers to the above questions, and ongoing discussions with a financial advi- sor, can help create the foundation upon which an investment portfolio can be built (see Exhibit 3). An Optimization Framework In the 2007 paper, “Lifetime Financial Advice: Human Capital, Asset Allocation and Insurance,”i Roger Ibbotson of the Yale School of Management wrote that “there is growing recognition among academics and practitioners that the risk and return Exhibit 3: The Wealth Management Process Define Client Goals Recommend Strategy Construct Portfolio Monitor Adjust Source: Morgan Stanley Wealth Management Global Investment Committee i  Roger G. Ibbotson, Moshe A. Milevsky, Peng Chen and Kevin X. Zhu, Lifetime Financial Advice: Human Capital, Asset Allocation, and Insurance (The Research Foundation of CFA Institute, April 2007)
  • 5.
    5MAy 2015 Please referto important information, disclosures and qualifications at the end of this material. A Wealth Optimization Approach for Athletes and Entertainers MORGAN STANLEY WEALTH MANAGEMENT characteristics of human capital—such as wage and salary profiles—should be taken into account when building portfolios for individual investors.” Ibbotson later added that “a fundamental element in financial planningadviceisthatyoungerinvestors(or investors with longer investment horizons) should invest aggressively.” In essence, Ib- botson is saying that people that have risky careers should take the opposite approach with their investments and vice versa, but theyshouldalsotakeonriskiftheyareyoung. Sinceathletesandentertainersareininher- ently risky careers, and they may also retire at a young age, how do you balance the two? Ofcourse,notwoathletesorentertainers face the same circumstances; each differs in career experience, family obligations, appetite for risk and post-retirement goals. However, reviewing the broad landscape of athletes and entertainers reveals that there are several clear divisions within each respective field. In formulating investment allocation models for athletes and entertainers, we considered the follow- ing classifications. The first tier comprises thetopplayersinthefourmajorteamsports and superstar entertainers, with career earnings that can easily surpass $100 mil- lion. The next group includes players in the majorteamsportsandmid-levelentertainers (e.g., actors in supporting roles); those with a stable, near decade-long career and ca- reer earnings ranging from $5 million to $40 million. Lastly, we consider athletes and entertainers with lumpy, unpredict- able cash flows (e.g., tennis players, boxers and golfers in sports, and those relying on project-by-projectincomeinentertainment) whose income is completely dependent on their performance year by year. To this end, we have created broad categories organized around cash flows and, to some degree, the earnings power of these particular athletes and entertainers. These are “Blue Chip,” “Playmaker”and “Wild Card” (see Exhibit 4). These are hypothetical asset allocations and should be viewed as starting points for athletes and entertainers that fit into our three categories. Each allocation can be customized based on an individual’s risk tolerance, investment horizon and cash-flow needs as well as the potential that other investments may already exist. (A more detailed asset allocation can be found in the appendix on page 8.) Using these hypothetical asset allocations we can showtheamountofexpectedannualincome, portfolio volatility and the probability of being fully funded through age 90. Blue Chip A Blue Chip’s first and most important fi- nancialgoaliscapitalpreservation.Inorder to preserve his or her career earnings, our BlueChipassetallocationmayincludebonds and alternatives like precious metals /gold, real estate investment trusts (REITs) and master limited partnerships (MLPs) as a way to provide a hedge against inflation and lower correlation to the equity market. An equally important financial goal for this cohort is growth, both market and opportunistic. Market growth includes large-cap and small-cap domestic equities, as well as global developed and emerging Exhibit 5: Hypothetical Portfolio Return Characteristics by Earnings Category Earnings Category Investable Assets Upon Retirement Expected Yearly Investment Income* Volatility Likelihood of Being Fully Funded Through Age 90 Blue Chip–Capital Preservation $50,000,000 $2,050,000 6.4% 85% Blue Chip–High Growth 50,000,000 2,400,000 11.9 85 Playmaker** 5,000,000 215,000 10.0 85 Wild Card 20,000,000 890,000 10.3 85 *Pretax, adjusted for assumed 2% average annual inflation, stated in current dollars; also assumes retirement at age 33. **Hypothetical portfolio performance for a higher-earning Playmaker can be found in the appendix on page 8. For more information about the risks to hypothetical performance, please see the Risk Considerations section on page 9 of this report. Estimates of future performance may be based on assumptions that may not be met. Source: Morgan Stanley Wealth Management Global Investment Committee Exhibit 4: Hypothetical Portfolio Allocation for Each Earnings Category Earnings Category Investment Goals Portfolio Allocation (%) Blue Chip–Capital Preservation Capital Preservation Market Growth Opportunistic Growth Fixed Income 50 Equities 25 Alternatives 20 Cash 5 Blue Chip–High Growth Capital Preservation Market Growth Opportunistic Growth Equities 60 Alternatives 20 Fixed Income 15 Cash 5 Playmaker Capital Preservation Balanced Growth Income Equities 55 Fixed Income 30 Alternatives 10 Cash 5 Wild Card Capital Preservation Balanced Growth Income Equities 55 Fixed Income 25 Alternatives 10 Cash 10 Source: Morgan Stanley Wealth Management Global Investment Committee
  • 6.
    6MAy 2015 Please referto important information, disclosures and qualifications at the end of this material. A Wealth Optimization Approach for Athletes and Entertainers MORGAN STANLEY WEALTH MANAGEMENT market equities. The Blue Chip’s robust earnings affords the chance to give up liquidity and pursue opportunistic growth in a portion of their investment alloca- tion, entering into private equity, direct lending, venture capital, real estate and even collectibles. Asset Allocation Given the Blue Chip’s prolific career earn- ings, we have taken a two-pronged ap- proach to the asset allocation process. Given higher earnings, some Blue Chips may have a higher tolerance for both market risk and volatility; thus we have created a Blue Chip High Growth alloca- tion, which has at least 60% of the port- folio in US and global equities. Further- more, Blue Chips have fewer immediate liquidity needs, which would allow them to more heavily invest in alternative as- set classes such as hedged strategies and managed futures, MLPs, commodities, REITs and private equity. The other approach would be to give up someexpectedannualincomewhilereducing the volatility of the portfolio by allocating more to fixed income investments. This more conservative approach would provide less variable returns. With this in mind, we have created an alternate asset allocation, “Blue Chip–Capital Preservation,” which appropriates50%ofassetsintovariousfixed incomesecurities,whiletheequitiesportion of the portfolio is reduced to 25%. Under both of these asset allocations, a BlueChipretiringatage33with$50million in assets would have an 85% likelihood of being fully funded through age 90. While both approaches have merit, the choice ultimately depends on the Blue Chip’s will- ingness to stomach volatility. Playmaker WhiletheaverageAmericanworksuntilhis or her mid 60s, the Playmaker athlete’s ca- reer typically lasts no longer than a decade. True,Playmakersarewellcompensated,but the unique challenges posed by earning a lifetime’s worth of salary in a relatively few yearsrequiresthataPlaymakerbeespecially vigilant in adhering to a financial plan. In addition to capital preservation, a Playmaker has two other financial goals: income and balanced growth. Playmakers have to make the salary they earn from their playing career last throughout their lengthy retirement. Asset Allocation Playmakers have the same ultralong retirement horizon as that of Blue Chips; however given that Playmakers’ career earnings are less than those of the Blue Chips, Playmakers may not have the same flexibility in their approach to asset allocation. Playmakers are long-term investors, and their assets should be skewed toward equi- ties. While our model tilts toward the US and other developed markets, it also allows for smaller, more-targeted investments in emergingmarketequities.Asahedgeagainst market volatility, Playmakers should con- sider allocating 10% of their portfolio to alternative investment asset classes such as hedged strategies, managed futures, MLPs, commodities, REITs and private equity. UnlikeBlueChips,Playmakerswilllikely need investment income throughout their retirement. That is why the model has a 30% allocation to fixed income securities, including tax-free municipal securities, which should provide a steady, dependable source of income. Lastly, Playmakers should keep a small portion, up to 5% of their portfolio, in cash for immediate liquidity. Using this asset allocation, a Playmaker retiring at age 33 with $5 million would have an 85% likelihood of being fully funded through age 90 (see Exhibit 5, page 5). Wild Card Wild Cards’ cash f lows are, as the classification suggests, unpredictable. As such, it is vital that such individuals adhere to a plan that will meet their two main financial goals: capital preservation and income. However, as their income grows they should consider adding to the growth portionoftheirportfoliotohelpbuildtoward their retirement goals. Asset Allocation WhiletheWildCardhasthesameextended retirement horizon as the Blue Chip and Playmaker, athletes and entertainers with lumpy, unpredictable cash flows have the greatest need for low portfolio volatility and reliable investment income while their careers are growing. Time-segmented asset allocation could be a useful approach for Wild Cards. This involves segregating retirement assets into different portfolios to be drawn on sequentially to fund retirement in- come needs, with the size and risk orien- tation of the portfolios dependent on the For Illustrative purposes only Source: Morgan Stanley Wealth Management Global Investment Committee Income Segment � Income Segment � Income Segment � Income Segment � Legacy Segment Income Segment 1 Assumption: Strategic Horizon: 7 Years Annual Return Target: 2.3% Income Segment 2 Assumption: Blend Horizon: 15 Years Annual Return Target: 5.2% Income Segment 3 Assumption: Blend Horizon: 22 Years Annual Return Target: 6.8% Income Segment 4 Assumption: Blend Horizon: 30 Years Annual Return Target: 8.0% Legacy Segment Assumption: Secular Horizon: 50 Years Annual Return Target: 8.9% Invested for Income Invested for Growth Exhibit 6: Time-Segmented Asset Allocation Process
  • 7.
    7MAy 2015 Please referto important information, disclosures and qualifications at the end of this material. A Wealth Optimization Approach for Athletes and Entertainers MORGAN STANLEY WEALTH MANAGEMENT Exhibit 7: Historical Range of Returns for Four Investment Horizons Source: Ibbotson Associates, Morgan Stanley Wealth Management Global Investment Committee as of Dec. 31, 2014 -�� -�� -�� �.� �.� ��.� �.� -�.� ��.� �� � �� �� �� ��% -��.� ��.� ��.� �.� �.� ��.� ��.� ��.� ��.� -�.� ��.� ��.� �.� �.� �.� �.� -�.� �.� �.� ��.� �.� �.� �.� �.� ��.� ��.� ��.� �.��.� ��.� ��.� �.��.� �.� �.� �.� ��.� ��.� ��.� ��.� ��.� -�.� -�.� �.� �.� �.� �.� ��.� ��.� ��.� ��.� ��.� -��.� -��.� One-Year Five-Year Horizon ��-Year ��-Year AnnualizedReturn Bucket � MedianBucket � Bucket � Bucket � Bucket � size and timing of expected distributions. Essentially, this approach starts with a very-low-volatilityportfolioanddrawsupon this for income and spending needs while the riskier, higher-growth portfolios are managed so that they will be available later in the individual's career. As they progress through their careers, Wild Cards go from a lower-volatility portfolio that is orient- ed to fixed income and add growth com- ponents to this as their careers progress and their earnings increase. The illustration below (see Exhibit 6) depictsasimpleexampleoftime-segmented asset allocation using four fixed-length periods and a legacy segment thereafter.ii Key to this approach is the premise that riskyassetswithvolatilereturnstreamsand higherexpectedreturnsarefarlessriskyina long-term context than in the short term. In theshortterm,riskierassetsexposeinvestors tothelargestlosses(seeExhibit7).However, the result flips when these same assets are held for a prolonged period of time. As can be seen in the chart, portfolios that feature the greatest downsides over one-year and five-yearhorizons(notedbythelowerborder of the floating bars), actually show the least downsideovera20-yearhorizonwheretheir “worst case” returns are superior. For the Wild Cards, when liquidity needs ariseintheearlieryearsoftheircareersthat are larger than anticipated, security-based loans could allow for a low-cost means of fundingunexpectedcashneedswithoutliq- uidatinglonger-durationassetsprematurely, or at unfavorable prices. Similar to the Playmaker, the Wild Card investor needs to focus mainly on the US and other developed market equities, with small, selective allocations to the emerging markets.Moreover,a10%allocationtoalter- nativeinvestments,suchashedgedstrategies and managed futures, MLPs, commodities, REITsandprivateequity,couldbedeployed to help offset market volatility. Furthermore, the volatile nature of Wild Cards’ careers likely requires that they earn a meaningful income from their investments. Thus, we recommend that at least 25% of assets are allocated to fixed incomesecurities,includingtax-freemunis, high yield and investment grade bonds. Lastly, Wild Cards should keep a slightly ii The legacy segment is the final phase of time-segmented asset allocation; the legacy segment holds the longest-term assets and allocates any funds that remain after the bucketing process for a wealth transfer to the next generation. In the time-segmented approach, if a segment depletes before the time horizon it was meant to cover ends, funds are drawn from the next segment in the sequence to cover withdrawals. When all segments are depleted, the legacy fund will be drawn upon. Conversely, if excess funds remain at the end of a segment’s time period, these funds will be allocated to the legacy fund.
  • 8.
    8MAy 2015 Please referto important information, disclosures and qualifications at the end of this material. A Wealth Optimization Approach for Athletes and Entertainers MORGAN STANLEY WEALTH MANAGEMENT larger portion of their portfolio in cash, as much as 10%, and/or consider a securities- based lending facility, should an immediate liquidity need emerge.* A Wild Card, retiring at age 33 with $20 million and following such an asset allocationmodelwillhavean85%likelihood of being fully funded through age 90. Conclusion Athletes and entertainers face a unique set of challenges preparing for a retirement window that can be two-to-three times longer than that of the average investor. However, a planned approach with the right asset allocation framework can help athletes and entertainers preserve and, in some cases, enhance their career earnings. Perhaps more important, this approach can helptheseinvestorsmaintainacomfortable living during their retirement, fulfill their philanthropic objectives and provide a strong platform for transferring wealth to the next generation. *Many athletes and entertainers can benefit from a strategic use of credit to meet their monthly liquidity needs. By using credit in the form of securities-based loans as a strategic financing option in concert with investment management, athletes and entertainers may be able to avoid or reduce: (1) tax and transaction costs; (2) overall portfolio risk exposures; (3) concentration risk; and 4) reducing strategic cash reserves. Furthermore, taking an integrated approach that includes suitable liabilities management may help in managing cash inflows and outflows, if they are mismatched or as liquidity needs arise. Securities-based loans allow a client to borrow funds by using the existing portfolio securities as collateral rather than selling the securities to raise cash. Investors who engage in securities-based lending in lieu of selling securities are able to continue to earn income from their investment portfolio, take advantage of reinvestment opportunities and remain committed to their long-term investment strategy. Securities-based loans may be used to help pay for education, buy a car or put an extension on a house or even to pay for unexpected medical care. For more information about the risks to securities-based loans, please see the Risk Considerations section on page 9 of this report.
  • 9.
    9MAy 2015 Please referto important information, disclosures and qualifications at the end of this material. A Wealth Optimization Approach for Athletes and Entertainers MORGAN STANLEY WEALTH MANAGEMENT Appendix Recommended Asset Allocation Asset Class Wild Card Blue Chip–High Growth Blue Chip–Capital Preservation Playmaker* Secular Expected Return Assumption Cash 10.0% 5.0% 5.0% 5.0% 2.7% Total Cash 10.0 5.0 5.0 5.0 Short-Term Fixed Income 0.0 0.0 10.0 0.0 3.6 US Fixed Income 15.0 10.0 30.0 20.0 4.3 International Fixed Income 0.0 0.0 5.0 0.0 4.5 Inflation-Linked Securities 0.0 0.0 0.0 0.0 4.3 High Yield 10.0 5.0 5.0 10.0 8.0 Emerging Markets Fixed Income 0.0 0.0 0.0 0.0 6.5 Total Fixed Income 25.0 15.0 50.0 30.0 US Large-Cap Growth Equity 7.5 7.5 2.5 7.5 9.9 US Large-Cap Value Equity 7.5 7.5 2.5 7.5 9.5 US Mid-Cap Growth Equity 5.0 5.0 2.0 5.0 11.1 US Mid-Cap Value Equity 5.0 5.0 2.0 5.0 10.3 US Small-Cap Growth Equity 2.5 5.0 2.0 2.5 12.0 US Small-Cap Value Equity 2.5 5.0 2.0 2.5 11.1 Europe Equity 7.5 7.5 4.0 10.0 9.9 Japan Equity 7.5 7.5 4.0 10.0 9.1 Asia Pacific ex Japan Equity 0.0 0.0 0.0 0.0 11.4 Emerging Markets Equity 10.0 10.0 4.0 5.0 12.3 Total Equities 55.0 60.0 25.0 55.0 Real Estate Investment Trusts 2.0 3.0 3.0 2.0 9.2 Commodities 2.0 3.0 3.0 2.0 5.4 Master Limited Partnerships 2.0 3.0 3.0 2.0 11.3 Hedged Strategies 2.0 3.0 3.0 2.0 7.3 Managed Futures 2.0 3.0 3.0 2.0 6.5 Private Equity 0.0 5.0 5.0 0.0 13.9 Private Real Estate Funds 0.0 0.0 0.0 0.0 9.8 Total Alternative Investments 10.0 20.0 20.0 10.0 TOTAL 100.0 100.0 100.0 100.0 Return Forecast 8.3% 9.2% 6.9% 8.2% Volatility 10.3% 11.9% 6.4% 10.0% Sharpe Ratio 0.54 0.54 0.65 0.55 Detailed Asset Allocation *A Playmaker who retires with $15 million and follows the asset allocation for a Playmaker can expect to see yearly investment income of $650,000, experience 10.0% annual volatility and have an 85% likelihood of being funded through age 90. Estimates of future performance may be based on assumptions that may not be met. Source: Morgan Stanley Wealth Management as of Jan. 31, 2015
  • 10.
    10MAy 2015 Please referto important information, disclosures and qualifications at the end of this material. A Wealth Optimization Approach for Athletes and Entertainers MORGAN STANLEY WEALTH MANAGEMENT Risk Considerations Hypothetical Performance General: Hypothetical performance should not be considered a guarantee of future performance or a guarantee of achieving overall financial objectives. Asset allocation and diversification do not assure a profit or protect against loss in declining financial markets. Hypothetical performance results have inherent limitations. The performance shown here is simulated performance, not investment results from an actual portfolio or actual trading. There can be large differences between hypothetical and actual performance results achieved by a particular asset allocation. Despite the limitations of hypothetical performance, these hypothetical performance results may allow clients and Financial Advisors to obtain a sense of the risk / return trade-off of different asset allocation constructs. Investing in the market entails the risk of market volatility. The value of all types of securities may increase or decrease over varying time periods. This analysis does not purport to recommend or implement an investment strategy. Financial forecasts, rates of return, risk, inflation, and other assumptions may be used as the basis for illustrations in this analysis. They should not be considered a guarantee of future performance or a guarantee of achieving overall financial objectives. No analysis has the ability to accurately predict the future, eliminate risk or guarantee investment results. As investment returns, inflation, taxes, and other economic conditions vary from the assumptions used in this analysis, your actual results will vary (perhaps significantly) from those presented in this analysis. The assumed return rates in this analysis are not reflective of any specific investment and do not include any fees or expenses that may be incurred by investing in specific products. The actual returns of a specific investment may be more or less than the returns used in this analysis. The return assumptions are based on hypothetical rates of return of securities indices, which serve as proxies for the asset classes. Moreover, different forecasts may choose different indices as a proxy for the same asset class, thus influencing the return of the asset class. Securities-Based Loans Borrowing against securities may not be suitable for everyone. You should be aware that securities-based loans involve a high degree of risk and that market conditions can magnify any potential for loss. Most importantly, you need to understand that: (1) Sufficient collateral must be maintained to support your loan(s) and to take future advances; (2) You may have to deposit additional cash or eligible securities on short notice; (3) Some or all of your securities may be sold without prior notice in order to maintain account equity at required maintenance levels. You will not be entitled to choose the securities that will be sold. These actions may interrupt your long-term investment strategy and may result in adverse tax consequences or in additional fees being assessed; (4) Typically a lender reserves the right not to fund any advance request due to insufficient collateral or for any other reason except for any portion of a securities-based loan that is identified as a committed facility; (5) Typically a lender reserves the right to increase your collateral maintenance requirements at any time without notice; and (6) Typically a lender reserves the right to call securities-based loans at any time and for any reason. With the exception of a margin loan, the proceeds from securities based loan products may not be used to purchase, trade, or carry margin stock (or securities); repay margin debt that was used to purchase, trade or carry margin stock (or securities); and cannot be deposited any brokerage account. To be eligible for a securities-based loan, a client must typically have a brokerage account that contains eligible securities, which shall serve as collateral for the securities-based loan. SHARPE RATIO This statistic measures a portfolio’s rate of return based on the risk it assumed and is often referred to as its risk-adjusted performance. Using standard deviation and returns in excess of the returns of T-bills, it determines reward per unit of risk. This measurement can help determine if the portfolio is reaching its goal of increasing returns while managing risk. VOLATILITY This is a statistical measure of the dispersion of returns for a given security or market index. Volatility can either be measured by using the standard deviation or variance between returns from that same security or market index. Commonly, the higher the volatility, the riskier the security. Glossary
  • 11.
    11MAy 2015 Please referto important information, disclosures and qualifications at the end of this material. A Wealth Optimization Approach for Athletes and Entertainers MORGAN STANLEY WEALTH MANAGEMENT Alternative Investments An investment in alternative investments can be highly illiquid, is speculative, and not suitable for all investors. Investing in alternative investments is only intended for experienced and sophisticated investors who are willing to bear the high economic risks associated with such an investment. Investors should carefully review and consider potential risks before investing. Some of these risks may include: • loss of all or a substantial portion of the investment due to leveraging, short-selling, or other speculative practices; • lack of liquidity in that there may be no secondary market for the fund and none is expected to develop; • volatility of returns; • restrictions on transferring interests; • potential lack of diversification and resulting higher risk due to concentration of trading authority when a single advisor is utilized; • absence of information regarding valuations and pricing; • complex tax structures and delays in tax reporting; • less regulation and higher fees than mutual funds; and • manager risk. Individual funds will have specific risks related to their investment programs that will vary from fund to fund. Actual results may vary and past performance is no guarantee of future results. MLPs Master Limited Partnerships (MLPs) are limited partnerships or limited liability companies that are taxed as partnerships and whose interests (limited partnership units or limited liability company units) are traded on securities exchanges like shares of common stock. Currently, most MLPs operate in the energy, natural resources or real estate sectors. Investments in MLP interests are subject to the risks generally applicable to companies in the energy and natural resources sectors, including commodity pricing risk, supply and demand risk, depletion risk and exploration risk. Individual MLPs are publicly traded partnerships that have unique risks related to their structure. These include, but are not limited to, their reliance on the capital markets to fund growth, adverse ruling on the current tax treatment of distributions (typically mostly tax deferred), and commodity volume risk. The potential tax benefits from investing in MLPs depend on their being treated as partnerships for federal income tax purposes and, if the MLP is deemed to be a corporation, then its income would be subject to federal taxation at the entity level, reducing the amount of cash available for distribution to the fund which could result in a reduction of the fund’s value. MLPs carry interest rate risk and may underperform in a rising interest rate environment. MLP funds accrue deferred income taxes for future tax liabilities associated with the portion of MLP distributions considered to be a tax-deferred return of capital and for any net operating gains as well as capital appreciation of its investments; this deferred tax liability is reflected in the daily NAV; and, as a result, the MLP fund’s after-tax performance could differ significantly from the underlying assets even if the pre-tax performance is closely tracked. International investing entails greater risk, as well as greater potential rewards compared to U.S. investing. These risks include political and economic uncertainties of foreign countries as well as the risk of currency fluctuations. These risks are magnified in countries with emerging markets, since these countries may have relatively unstable governments and less established markets and economies. Managed futures investments are speculative, involve a high degree of risk, use significant leverage, have limited liquidity and/or may be generally illiquid, may incur substantial charges, may subject investors to conflicts of interest, and are usually suitable only for the risk capital portion of an investor’s portfolio. Before investing in any partnership and in order to make an informed decision, investors should read the applicable prospectus and/or offering documents carefully for additional information, including charges, expenses, and risks. Managed futures investments are not intended to replace equities or fixed income securities but rather may act as a complement to these asset categories in a diversified portfolio. Investing in commodities entails significant risks. Commodity prices may be affected by a variety of factors at any time, including but not limited to, (i) changes in supply and demand relationships, (ii) governmental programs and policies, (iii) national and international political and economic events, war and terrorist events, (iv) changes in interest and exchange rates, (v) trading activities in commodities and related contracts, (vi) pestilence, technological change and weather, and (vii) the price volatility of a commodity. In addition, the commodities markets are subject to temporary distortions or other disruptions due to various factors, including lack of liquidity, participation of speculators and government intervention. Physical precious metals are non-regulated products. Precious metals are speculative investments, which may experience short-term and long term price volatility. The value of precious metals investments may fluctuate and may appreciate or decline, depending on market conditions. If sold in a declining market, the price you receive may be less than your original investment. Unlike bonds and stocks, precious metals do not make interest or dividend payments. Therefore, precious metals may not be suitable for investors who require current income. Precious metals are commodities that should be safely stored, which may impose additional costs on the investor. The Securities Investor Protection Corporation (“SIPC”) provides certain protection for customers’ cash and securities in the event of a brokerage firm’s bankruptcy, other financial difficulties, or if customers’ assets are missing. SIPC insurance does not apply to precious metals or other commodities. Bonds are subject to interest rate risk. When interest rates rise, bond prices fall; generally the longer a bond's maturity, the more sensitive it is to this risk. Bonds may also be subject to call risk, which is the risk that the issuer will redeem the debt at its option, fully or partially, before the scheduled maturity date. The market value of debt instruments may fluctuate, and proceeds from sales prior to maturity may be more or less than the amount originally invested or the maturity value due to changes in market conditions or changes in the credit quality of the issuer. Bonds are subject to the credit risk of the issuer. This is the risk that the issuer might be unable to make interest and/or principal payments on a timely basis. Bonds are also subject to reinvestment risk, which is the risk that principal and/or interest payments from a given investment may be reinvested at a lower interest rate. Bonds rated below investment grade may have speculative characteristics and present significant risks beyond those of other securities, including greater credit risk and price volatility in the secondary market. Investors should be careful to consider these risks alongside their individual circumstances, objectives and risk tolerance before investing in high-yield bonds. High yield bonds should comprise only a limited portion of a balanced portfolio.
  • 12.
    12MAy 2015 Please referto important information, disclosures and qualifications at the end of this material. A Wealth Optimization Approach for Athletes and Entertainers MORGAN STANLEY WEALTH MANAGEMENT Interest on municipal bonds is generally exempt from federal income tax; however, some bonds may be subject to the alternative minimum tax (AMT). Also, municipal bonds acquired in the secondary market at a discount may be subject to the market discount tax provisions, and therefore could give rise to taxable income. Typically, state tax-exemption applies if securities are issued within one’s state of residence and, if applicable, local tax-exemption applies if securities are issued within one’s city of residence. The tax-exempt status of municipal securities may be changed by legislative process, which could affect their value and marketability. Treasury Inflation Protection Securities’ (TIPS) coupon payments and underlying principal are automatically increased to compensate for inflation by tracking the consumer price index (CPI). While the real rate of return is guaranteed, TIPS tend to offer a low return. Because the return of TIPS is linked to inflation, TIPS may significantly underperform versus conventional U.S. Treasuries in times of low inflation. Equity securities may fluctuate in response to news on companies, industries, market conditions and general economic environment. Investing in foreign emerging markets entails greater risks than those normally associated with domestic markets, such as political, currency, economic and market risks. Investing in smaller companies involves greater risks not associated with investing in more established companies, such as business risk, significant stock price fluctuations and illiquidity. Asset allocation and diversification do not assure a profit or protect against loss in declining financial markets. REITs investing risks are similar to those associated with direct investments in real estate: property value fluctuations, lack of liquidity, limited diversification and sensitivity to economic factors such as interest rate changes and market recessions. Dividend income from REITs will generally not be treated as qualified dividend income and therefore will not be eligible for reduced rates of taxation. Rebalancing does not protect against a loss in declining financial markets. There may be a potential tax implication with a rebalancing strategy. Investors should consult with their tax advisor before implementing such a strategy. Growth investing does not guarantee a profit or eliminate risk. The stocks of these companies can have relatively high valuations. Because of these high valuations, an investment in a growth stock can be more risky than an investment in a company with more modest growth expectations. Value investing does not guarantee a profit or eliminate risk. Not all companies whose stocks are considered to be value stocks are able to turn their business around or successfully employ corrective strategies which would result in stock prices that do not rise as initially expected. Because of their narrow focus, sector investments tend to be more volatile than investments that diversify across many sectors and companies.
  • 13.
    A Wealth OptimizationApproach for Athletes and Entertainers MORGAN STANLEY WEALTH MANAGEMENT © 2015 Morgan Stanley Smith Barney LLC. Member SIPC. CS 8239252 05/15 Disclosures The author(s) (if any authors are noted) principally responsible for the preparation of this material receive compensation based upon various factors, including quality and accuracy of their work, firm revenues (including trading and capital markets revenues), client feedback and competitive factors. Morgan Stanley Wealth Management is involved in many businesses that may relate to companies, securities or instruments mentioned in this material. The views expressed herein are those of the author and do not necessarily reflect the views of Morgan Stanley Wealth Management or its affiliates. All opinions are subject to change without notice. Neither the information provided nor any opinion expressed constitutes a solicitation for the purchase or sale of any security. Past performance is no guarantee of future results. This material has been prepared for informational purposes only and is not an offer to buy or sell or a solicitation of any offer to buy or sell any security/ instrument, or to participate in any trading strategy. Any such offer would be made only after a prospective investor had completed its own independent investigation of the securities, instruments or transactions, and received all information it required to make its own investment decision, including, where applicable, a review of any offering circular or memorandum describing such security or instrument. That information would contain material information not contained herein and to which prospective participants are referred. This material is based on public information as of the specified date, and may be stale thereafter. We have no obligation to tell you when information herein may change. We make no representation or warranty with respect to the accuracy or completeness of this material. Morgan Stanley Wealth Management has no obligation to provide updated information on the securities/instruments mentioned herein. The securities/instruments discussed in this material may not be suitable for all investors. The appropriateness of a particular investment or strategy will depend on an investor’s individual circumstances and objectives. Morgan Stanley Wealth Management recommends that investors independently evaluate specific investments and strategies, and encourages investors to seek the advice of a financial advisor. The value of and income from investments may vary because of changes in interest rates, foreign exchange rates, default rates, prepayment rates, securities/instruments prices, market indexes, operational or financial conditions of companies and other issuers or other factors. Estimates of future performance are based on assumptions that may not be realized. Actual events may differ from those assumed and changes to any assumptions may have a material impact on any projections or estimates. Other events not taken into account may occur and may significantly affect the projections or estimates. Certain assumptions may have been made for modeling purposes only to simplify the presentation and/or calculation of any projections or estimates, and Morgan Stanley Wealth Management does not represent that any such assumptions will reflect actual future events. Accordingly, there can be no assurance that estimated returns or projections will be realized or that actual returns or performance results will not materially differ from those estimated herein. This material should not be viewed as advice or recommendations with respect to asset allocation or any particular investment. This information is not intended to, and should not, form a primary basis for any investment decisions that you may make. Morgan Stanley Wealth Management is not acting as a fiduciary under either the Employee Retirement Income Security Act of 1974, as amended or under section 4975 of the Internal Revenue Code of 1986 as amended in providing this material. Morgan Stanley Smith Barney LLC, its affiliates and Morgan Stanley Financial Advisors do not provide legal or tax advice. Each client should always consult his/her personal tax and/or legal advisor for information concerning his/her individual situation and to learn about any potential tax or other implications that may result from acting on a particular recommendation. This material is disseminated in Australia to “retail clients” within the meaning of the Australian Corporations Act by Morgan Stanley Wealth Management Australia Pty Ltd (A.B.N. 19 009 145 555, holder of Australian financial services license No. 240813). Morgan Stanley Wealth Management is not incorporated under the People's Republic of China (“PRC”) law and the material in relation to this report is conducted outside the PRC. This report will be distributed only upon request of a specific recipient. This report does not constitute an offer to sell or the solicitation of an offer to buy any securities in the PRC. PRC investors must have the relevant qualifications to invest in such securities and must be responsible for obtaining all relevant approvals, licenses, verifications and or registrations from PRC's relevant governmental authorities. If your financial adviser is based in Australia, Dubai, Germany, Italy, Switzerland or the United Kingdom, then please be aware that this report is being distributed by the Morgan Stanley entity where your financial adviser is located, as follows: Australia: Morgan Stanley Wealth Management Australia Pty Ltd (ABN 19 009 145 555, AFSL No. 240813); Dubai: Morgan Stanley Private Wealth Management Limited (DIFC Branch), regulated by the Dubai Financial Services Authority (the DFSA), and is directed at Professional Clients only, as defined by the DFSA; Germany: Morgan Stanley Private Wealth Management Limited, Munich branch authorized by the Prudential Regulation Authority and regulated by the Financial Conduct Authority and the Bundesanstalt fuer Finanzdienstleistungsaufsicht; Italy: Morgan Stanley Bank International Limited, Milan Branch, authorized by the Prudential Regulation Authority and regulated by the Financial Conduct Authority and the Prudential Regulation Authority, the Banca d'Italia and the Commissione Nazionale per Le Societa' E La Borsa; Switzerland: Bank Morgan Stanley AG regulated by the Swiss Financial Market Supervisory Authority; or United Kingdom: Morgan Stanley Private Wealth Management Ltd, authorized and regulated by the Financial Conduct Authority, approves for the purposes of section 21 of the Financial Services and Markets Act 2000 this material for distribution in the United Kingdom. Morgan Stanley Wealth Management is not acting as a municipal advisor to any municipal entity or obligated person within the meaning of Section 15B of the Securities Exchange Act (the “Municipal Advisor Rule”) and the opinions or views contained herein are not intended to be, and do not constitute, advice within the meaning of the Municipal Advisor Rule. This material is disseminated in the United States of America by Morgan Stanley Wealth Management. Third-party data providers make no warranties or representations of any kind relating to the accuracy, completeness, or timeliness of the data they provide and shall not have liability for any damages of any kind relating to such data. This material, or any portion thereof, may not be reprinted, sold or redistributed without the written consent of Morgan Stanley Smith Barney LLC.