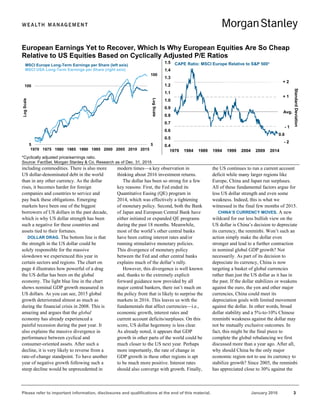
- The document discusses Morgan Stanley's outlook for the global economy and financial markets in 2016.
- It predicts that economic growth will converge across developed economies like the US, Eurozone, UK and Japan, with little difference expected in real GDP growth between these regions.
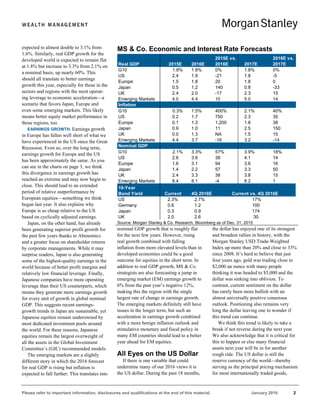
- Earnings growth is also expected to accelerate in Europe and Japan, outpacing recent trends in the US and emerging from an "extreme divergence."
- However, returns may remain volatile as economic outcomes converge due to diverging rates of change and differences in nominal GDP growth across regions. The strength of the US dollar also poses a key risk.


![Please refer to important information, disclosures and qualifications at the end of this material. January 2016 15
anymore in the manner that they have
because we no longer have all monetary
policy allowing the rerating of both bonds
and equities. I think 2015 really set the
scene for that because markets were
churning.
I think many investors are looking
through the rearview mirror at the returns
they've had out of equities and bonds in
the last five or 10 years, thinking, “This is
great.” But delivering alpha is becoming
much, much harder. We think a lot of
exchange-traded funds that track major
benchmark indexes are not going to
deliver the annualized returns that they
have in recent years because there isn't this
rising tide of returns in bond and equity
markets from here on out.
We are trying to encourage a lot of our
clients to take risk. That's the only way
they are going to protect the purchasing
power of their wealth. Particularly in
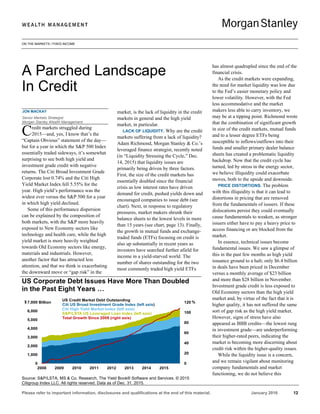
Europe, you have negative interest rates.
Nothing is yielding anything out to about
seven years in the sovereign bond markets.
So if there is no risk taken, there is no
return potential.
CG: Where do you see attractive return
potential?
ND: The US is trading at 27 times
earnings, according to the Shiller P/E ratio
[price divided by average 10 years’
earnings, adjusted for inflation]. That
means the more you put it in the US, the
lower the prospective returns you may
earn in the next 10 years. As an investor,
you want to hunt where there's return
potential. I would look at the US
valuations and argue it's already fully
valued.
We know Greece is in trouble, but the
valuation of the market offers 17% return
potential. If you look at the Italian market,
and you take out the banking sector, which
is now in structural decline, the average
Italian company is earning 60% of what it
was earning in 2006 or 2007. That’s why
we believe recovery potential is still sitting
inside the European market.
One story that I think is underestimated
is European investors could buy Europe:
European asset allocators have
traditionally been underweight equities
because of the volatility, and they've done
very well in fixed income markets. But
that's looking through the rearview mirror.
If you look through the wind screen,
Europeans have to go for equity markets to
get any type of return going forward, and
they are significantly underweight their
own markets.
CG: Which European sectors look most
attractive?
ND: For many of the sectors, you just
need Europe to improve. I think there's
clear evidence that consumption is
improving. Spending is improving and,
therefore, we think the more domestic,
consumer-related plays are a good place to
go.
I am probably an outlier, because I don't
understand the desire to buy banks. I think
banks are the most disrupted, the most
unnecessary, the most overresourced
sector of the market. I can't see any return
potential there and I don’t think that they
are going to be an earnings driver,
particularly with growing regulation.
We think you need to buy structural
growth stocks. In Europe, we would see
those as luxury goods, health care and a lot
of industrial and services areas. What you
don't own are banks, utilities and a whole
load of stuff in the middle that are not
generating either growth or income. We
prefer to take the risk by segmenting it
either into the true capital-appreciation-
type stocks or the dividend stocks.
CG: What would cause you to perhaps
change your constructive outlook on
Europe?
ND: I think it is overbullishness on the
US, causing the euro to go back up. That
stymies a lot of the recovery and the
restructuring, because the markets would
interpret that as the weaker dollar being
good for emerging markets—but the quid
pro quo is that it would be bad for Europe.
I tend to feel that the problems for
Europe are here in the US, and how the
markets and how the currency moves here
is how Europe will adjust. I think the
underlying story of Europe's restructuring
and gentle recovery is going to be in place
for a while.
CG: Beyond Europe, are there any other
investment themes that you see affecting
markets?
ND: Disruption is a very, very big
theme. It's been emerging very quickly in
the equity markets, but we think it has a lot
further to go. What we've tried to do is
understand how industries are now
changing, how technology and consumer
behavior is changing the markets, the
value chains, the pressure points.
The way I looked at this initially was, I
don't want to be invested in things that are
going to be disrupted—so the first stage
was to be very defensive. Then we do our
research to understand if companies can
navigate the changing environment. It's
doubly difficult because the millennials
are here. They don't want cars. They want
to live in a city. They want fresh food.
They like their mobile phones to do their
shopping. They are totally different.
Many companies will be challenged to
stay relevant to the baby boomers, or
clients of today, while finding a way of
becoming relevant to the clients of the
future—the millenials. A lot of industries
are going to suffer as the consumer
changes.
This is a theme across pretty much
every investment, and I think the
frustration for many of us is you can't buy
the disruptors; you can't invest in Uber or
Airbnb. All you can do is make sure you're
in the least disruptive investments.
Neil Dwane is not an employee of
Morgan Stanley Wealth Management.
Opinions expressed by him are solely his
own and may not necessarily reflect those
of Morgan Stanley Wealth Management or
its affiliates.](https://image.slidesharecdn.com/1fqzc2rjqwujvkiwg1mp-signature-d04f619685e16aaa717b334329bc81c286bb55079d3c25041d0f66db399c0905-poli-160107010902/85/2016-outlook-15-320.jpg)