This document compares the switching frequency and performance of two vector control methods for asynchronous motors: Field Oriented Control (FOC) and Direct Torque Control (DTC). Experimental studies revealed that FOC results in a significantly higher switching frequency (approximately 65-75% more than DTC) and less torque ripple, making it preferable for applications where high torque quality is essential. The findings suggest that while DTC excels in fast dynamic response, FOC is more advantageous for efficiency and stability in switching frequencies.
![International Journal on Soft Computing, Artificial Intelligence and Applications (IJSCAI), Vol.3, No. 3/4, November 2014
COMPARING OF SWITCHING FREQUENCY ON VECTOR
CONTROLLED ASYNCHRONOUS MOTOR
Yılmaz Korkmaz1, Fatih Korkmaz2, Ismail Topaloglu2, Hayati Mamur2
1 Faculty of Technology, Department of Electrical-Electronic Engineering,
Gazi University, Ankara, Turkey
2 Faculty of Engineering, Department of Electrical-Electronic Engineering,
Çankırı Karatekin University, Çankırı, Turkey
ABSTRACT
Nowadays, asynchronous motors have wide range use in many industrial applications. Field oriented
control (FOC) and direct torque control (DTC) are commonly used methods in high performance vector
control for asynchronous motors. Therefore, it is very important to identify clearly advantages and
disadvantages of both systems in the selection of appropriate control methods for many industrial
applications. This paper aims to present a new and different perspective regarding the comparison of the
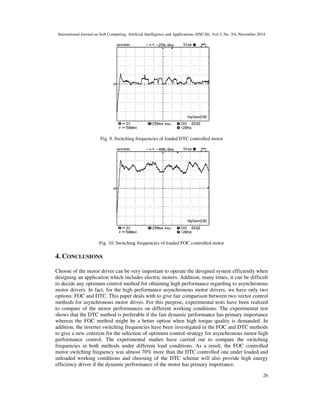
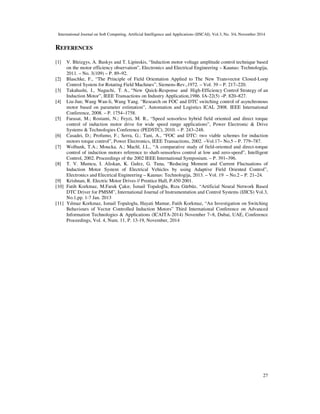
switching behaviours on the FOC and the DTC drivers. For this purpose, the experimental studies have
been carried out to compare the inverter switching frequencies and torque responses of the asynchronous
motor in the FOC and the DTC systems under different working conditions. The dSPACE 1103 controller
board was programmed with Matlab/Simulink software. As expected, the experimental studies showed that
the FOC controlled motors has a lessened torque ripple. On the other hand, the FOC controlled motor
switching frequency has about 65-75% more than the DTC controlled under both loaded and unloaded
working conditions.
KEYWORDS
Asynchronous motor; vector control; motor drives; switching frequency
1. INTRODUCTION
For many years, asynchronous motors have wide range use in industrial applications due to its
simple and robust structure and low costs when compared with dc motors. Furthermore, we have
better high performance control options now due to development of power electronics in the last
few decades. There are two noted control methods in high performance control of asynchronous
motors named as: FOC and DTC.
Blaschke proposed the FOC in the 1970s. The FOC was unique and only option that we had on
asynchronous motors high performance control until 1980s that the DTC was introduced by
Takahashi. Since that day, there have been continual discussions and questions about that: Which
one has the best performance on asynchronous motors vector control? [1-3].
The main idea of vector control methods is the control of motor flux and torque components
separately like DC motors. The main difference between two methods is that the FOC controls by
a rotor or stator field orientation, while the DTC controls by a stator field observation [4]. So, the
structural differences in the both control methods are that the FOC uses park transformation, more
machine parameters, and current regulators, while the DTC uses Clarke transformation, less
DOI :10.5121/ijscai.2014.3402 19](https://image.slidesharecdn.com/comparingofswitchingfrequencyonvectorcontrolledasynchronousmotor-141207234827-conversion-gate01/85/Comparing-of-switching-frequency-on-vector-controlled-asynchronous-motor-1-320.jpg)
![International Journal on Soft Computing, Artificial Intelligence and Applications (IJSCAI), Vol.3, No. 3/4, November 2014
machine parameters, and any current regulators. Thus, comparative studies between the two
methods show that the DTC is simplicity, a fast dynamic response, and robust against to
parameter changes. Despite all these advantages, the DTC also has some handicaps: the most
important of them being high torque and current ripples. Evidently, all users have to take into
account all these advantages and disadvantages when deciding on which method they will use on
designed system [5]. There are some comparative studies regarding both comparison of both the
methods, which address the motors speed and torque behaviours. Thanks to this research, it is
now known that despite a high torque ripple, the DTC has a fast dynamic response [6-7].
In this paper, a new and different perspective has been presented regarding the comparison of the
FOC and the DTC drivers. The voltage source inverter switching frequencies has been compared
on both the FOC and the DTC systems. There is no doubt about the importance of switching
frequency on power electronic systems because its directly affects switching losses and it means
also affects indirectly the efficiency of the drivers. Experimental studies have been carried out to
compare switching frequencies and the dSpace 1103 controller board has been programmed with
Matlab/Simulink.
20
2. FOC AND DTC METHODS
The FOC is mostly used to control the speed of the motor, not control of the moment, due to its
low level sensitivity [8].
In the FOC, the parameters of the motor have to be turned in a d-q reference frame, which
consider turns in a synchronous speed (park transformation). Thus, the position of the rotor flux
has to be well determined for the success of transformation. In the determining the process of the
rotor flux position two basic approaches are used.
Using of flux sensors is the first approach to determine the rotor flux position while to measure
the rotor position with an incremental encoder and calculate the angle between the axis of the
rotor and the flux, is the second one. Eq. 1 and Eq. 2, describes the calculation of the stator
current d-q components.
*
T L
2
qs L
=
r
m
e
r
p
i
*
* 2
3
l
(1)
r
m
ds L
i
*
* l
= (2)
*
qs i and *
ds i are the stator current d-q components reference values, *
r l is the rotor flux reference
value, and m L is the mutual inductance, r L is rotor inductance and p is motor pole pairs value
in these equations. The stator three phase currents obtained by using the transformation matrix
which is given in Eq. 3.](https://image.slidesharecdn.com/comparingofswitchingfrequencyonvectorcontrolledasynchronousmotor-141207234827-conversion-gate01/85/Comparing-of-switching-frequency-on-vector-controlled-asynchronous-motor-2-320.jpg)
![i
i
*
q
*
0
*
a
*
b
*
1
2
2
3
sin
2
2
3
cos
1
3
sin
3
cos
cos sin 1
i
i
d
c
p
q
p
q
p
q
p
q
q q
(3)
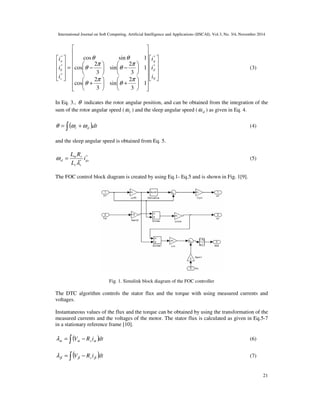
In Eq. 3., q indicates the rotor angular position, and can be obtained from the integration of the
sum of the rotor angular speed ( r w ) and the sleep angular speed ( sl w ) as given in Eq. 4.
( )dt r sl q =
w +w . (4)
and the sleep angular speed is obtained from Eq. 5.
*
L R
l
m r
w = (5)
sl i
* qs
L
r r
The FOC control block diagram is created by using Eq.1- Eq.5 and is shown in Fig. 1[9].
Fig. 1. Simulink block diagram of the FOC controller
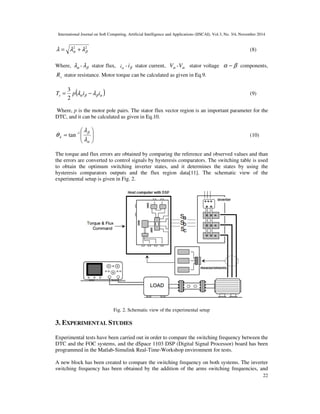
The DTC algorithm controls the stator flux and the torque with using measured currents and
voltages.
Instantaneous values of the flux and the torque can be obtained by using the transformation of the
measured currents and the voltages of the motor. The stator flux is calculated as given in Eq.5-7
in a stationary reference frame [10].
(V R i )dt s =
− a a a l (6)
(V R i )dt s =
− b b b l (7)](https://image.slidesharecdn.com/comparingofswitchingfrequencyonvectorcontrolledasynchronousmotor-141207234827-conversion-gate01/85/Comparing-of-switching-frequency-on-vector-controlled-asynchronous-motor-6-320.jpg)
![International Journal on Soft Computing, Artificial Intelligence and Applications (IJSCAI), Vol.3, No. 3/4, November 2014
22
2 2
a b l = l +l (8)
Where, a l - b l stator flux, a i - b i stator current, a V - a V stator voltage a − b components,
s R stator resistance. Motor torque can be calculated as given in Eq.9.
3
( ) a b b a T p l i l i e = −
2
(9)
Where, p is the motor pole pairs. The stator flux vector region is an important parameter for the
DTC, and it can be calculated as given in Eq.10.
q 1 tan (10)
l
l l
= −
b
a
The torque and flux errors are obtained by comparing the reference and observed values and than
the errors are converted to control signals by hysteresis comparators. The switching table is used
to obtain the optimum switching inverter states, and it determines the states by using the
hysteresis comparators outputs and the flux region data[11]. The schematic view of the
experimental setup is given in Fig. 2.
Fig. 2. Schematic view of the experimental setup
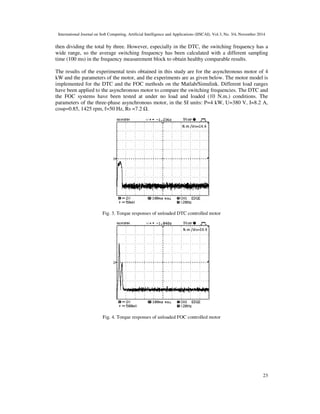
3. EXPERIMENTAL STUDIES
Experimental tests have been carried out in order to compare the switching frequency between the
DTC and the FOC systems, and the dSpace 1103 DSP (Digital Signal Processor) board has been
programmed in the Matlab-Simulink Real-Time-Workshop environment for tests.
A new block has been created to compare the switching frequency on both systems. The inverter
switching frequency has been obtained by the addition of the arms switching frequencies, and](https://image.slidesharecdn.com/comparingofswitchingfrequencyonvectorcontrolledasynchronousmotor-141207234827-conversion-gate01/85/Comparing-of-switching-frequency-on-vector-controlled-asynchronous-motor-7-320.jpg)