Busuness communication
For downloading this contact- bikashkumar.bk100@gmail.com
Prepared by Students of University of Rajshahi
Robiul Islam
Shahin Islam
Saiful Islam
MD. Al Amin
Bikash Kumar
Sohanuzzaman
Arif ahmed
MD. Hasanuzzaman
Busuness communication
For downloading this contact- bikashkumar.bk100@gmail.com
Prepared by Students of University of Rajshahi
Robiul Islam
Shahin Islam
Saiful Islam
MD. Al Amin
Bikash Kumar
Sohanuzzaman
Arif ahmed
MD. Hasanuzzaman
Visualizing Healthcare Data with Tableau (Toronto Central LHIN Presentation)Stefan Popowycz
This is the presentation I gave to the Toronto Central LHIN about using Tableau to visualizing healthcare metrics (April 16 2013). I also have a section on how Information Design best practices can be leveraged in order to effectively communicate your key messages to your end users.
Homeless assistance increasingly relies on data, performance measurement, and management information systems. This workshop will describe elementary concepts in data and performance management, as well as practical strategies for using data systems to support a performance-based homeless assistance system. This workshop is designed to prepare those inexperienced with data and performance measurement for the HEARTH Data and Performance Measurement workshop.
Developing Metrics for Financial Shared Services: Best Practices, Tips and T...Jeff Zwier
One of the most difficult tasks shared services managers face is measuring and demonstrating value returned to their
organizations. How can you capture your value in terms that are quantifiable, meaningful to your senior management and
useful as performance and analytical tools by your service leadership team? In this presentation, Jeff Zwier shares some of the tips, best practices and pitfalls he has
learned while developing performance and analytical metrics for shared services operating within a global financial services team, including
• Designing metrics that encourage the right responses from senior management
• Types of metrics and when to use each
• Principles of basic performance dashboard design
• Determining the right level of analysis to support performance management and demonstrate cost savings
A discussion about how to take practical steps to implement Infonomics in your organisation. This was run as a webinar - the video recording of which is available on the LINQ YouTube Channel https://www.youtube.com/channel/UCWdC90cjg6sXMlltkBxMj9w
Chapter 9
Informal Reports
1
Today’s Agenda
Informational and analytical reports
Direct and indirect organization
Informal and formal styles
Report formats
Effective headings
Data and research
Today’s Agenda
Informational and analytical reports
Direct and indirect organization
Informal and formal styles
Report formats
Effective headings
Data and research
Reporting in the Workplace
Status of tasks, projects, and work in progress.
Oral, e-mail messages, PDF files, or slide decks.
Three Main Purposes of Business Reports
Convey
information
1
Here’s info for
you.
Answer questions
2
Here’s your answer.
Solve problems
3
Here’s one solution.
5
Characteristics
of Business Reports
Report
Functions
Organizational Strategies
Direct
Indirect
Analytical reports
Informational reports
i
Informational Reports
i
Present data
without analysis or recommendations
Are routine and often periodic
Analytical Reports
Provide data or findings, analyses, and conclusions
May also supply recommendations
Intend to persuade readers
Today’s Agenda
Informational and analytical reports
Direct and indirect organization
Informal and formal styles
Report formats
Effective headings
Data and research
Recommendation Reports
Include a discussion of pros, cons, and costs.
Direct Strategy
Explain the problem or need briefly.
Announce the recommendation, solution, or action concisely and
with action verbs.
Explain more fully the benefits of the recommendation or steps necessary to solve the problem.
Conclude with a summary specifying the recommendation and necessary action.
Recommendation Reports
Discuss alternative solutions, beginning with the least likely to succeed.
Indirect Strategy
Refer to the problem in general terms in the subject line or title.
Describe the problem or need your recommendation addresses.
Use specific examples, supporting statistics, and authoritative quotations to lend credibility.
Recommendation Reports
Ask for authorization to proceed, if necessary.
Indirect Strategy
Present the most promising alternative (your recommendation) last.
Show how the advantages of your recommendation outweigh its disadvantages.
Summarize your recommendation. Specify the action it requires,
if appropriate.
Today’s Agenda
Informational and analytical reports
Direct and indirect organization
Informal and formal styles
Report formats
Effective headings
Data and research
Report Writing Style
Conversational language
Informal
Style
Friendly, casual tone
First-person pronouns, contractions
Shorter sentences, familiar words
Report Writing Style
Absence of humor, figures of speech, “editorializing”
Formal
Style
Emphasis on objectivity, accuracy, fairness
Professional distance between writer and reader
May use third person
(“the researcher”) and passive voice
Your Group Project: Should it be…
□ Informational □ Analytical □ Recommendation
□ Direct Strategy □ Indirect Strategy
□ Formal Writing Style.
This presentation tries to clear the concept of Data Visualization and Infographics. How to approach both the processes and whats takes to create stunning data visualization or Amazing infographics!
Driving Change to Thrive in a Digital FutureNeil Calvert
Presented at Digital Transformation 2018 #DX2018, this presentation describes the power of enabling information literacy within your business and how this in turn creates opportunities to drive new business value and revenue in response to the expectations of today's consumers in the digital economy.
Unit 8 - Information and Communication Technology (Paper I).pdfThiyagu K
This slides describes the basic concepts of ICT, basics of Email, Emerging Technology and Digital Initiatives in Education. This presentations aligns with the UGC Paper I syllabus.
A Strategic Approach: GenAI in EducationPeter Windle
Artificial Intelligence (AI) technologies such as Generative AI, Image Generators and Large Language Models have had a dramatic impact on teaching, learning and assessment over the past 18 months. The most immediate threat AI posed was to Academic Integrity with Higher Education Institutes (HEIs) focusing their efforts on combating the use of GenAI in assessment. Guidelines were developed for staff and students, policies put in place too. Innovative educators have forged paths in the use of Generative AI for teaching, learning and assessments leading to pockets of transformation springing up across HEIs, often with little or no top-down guidance, support or direction.
This Gasta posits a strategic approach to integrating AI into HEIs to prepare staff, students and the curriculum for an evolving world and workplace. We will highlight the advantages of working with these technologies beyond the realm of teaching, learning and assessment by considering prompt engineering skills, industry impact, curriculum changes, and the need for staff upskilling. In contrast, not engaging strategically with Generative AI poses risks, including falling behind peers, missed opportunities and failing to ensure our graduates remain employable. The rapid evolution of AI technologies necessitates a proactive and strategic approach if we are to remain relevant.
Operation “Blue Star” is the only event in the history of Independent India where the state went into war with its own people. Even after about 40 years it is not clear if it was culmination of states anger over people of the region, a political game of power or start of dictatorial chapter in the democratic setup.
The people of Punjab felt alienated from main stream due to denial of their just demands during a long democratic struggle since independence. As it happen all over the word, it led to militant struggle with great loss of lives of military, police and civilian personnel. Killing of Indira Gandhi and massacre of innocent Sikhs in Delhi and other India cities was also associated with this movement.
Introduction to AI for Nonprofits with Tapp NetworkTechSoup
Dive into the world of AI! Experts Jon Hill and Tareq Monaur will guide you through AI's role in enhancing nonprofit websites and basic marketing strategies, making it easy to understand and apply.
Acetabularia Information For Class 9 .docxvaibhavrinwa19
Acetabularia acetabulum is a single-celled green alga that in its vegetative state is morphologically differentiated into a basal rhizoid and an axially elongated stalk, which bears whorls of branching hairs. The single diploid nucleus resides in the rhizoid.
Macroeconomics- Movie Location
This will be used as part of your Personal Professional Portfolio once graded.
Objective:
Prepare a presentation or a paper using research, basic comparative analysis, data organization and application of economic information. You will make an informed assessment of an economic climate outside of the United States to accomplish an entertainment industry objective.
Model Attribute Check Company Auto PropertyCeline George
In Odoo, the multi-company feature allows you to manage multiple companies within a single Odoo database instance. Each company can have its own configurations while still sharing common resources such as products, customers, and suppliers.
9. Reports can be…
•Solicited or unsolicited
•Internal or external
•Formal or informal
•Informational or
analytical
•Direct or indirect
•Written in a variety of
formats
Image source
10. Summary
• Defined what a business report is
• Learned to distinguish between different types of
reports
• Explored different report formats
11. References
Guffrey, M. E., Loewy, D., & Almonte, R. (2019). Essentials of business communication
(9th Canadian Edition). Nelson.
Jamieson, L. (2019). Chapter 8: Communicating in the digital-age workplace [PowerPoint
slides]. Nelson.
12. Image Sources
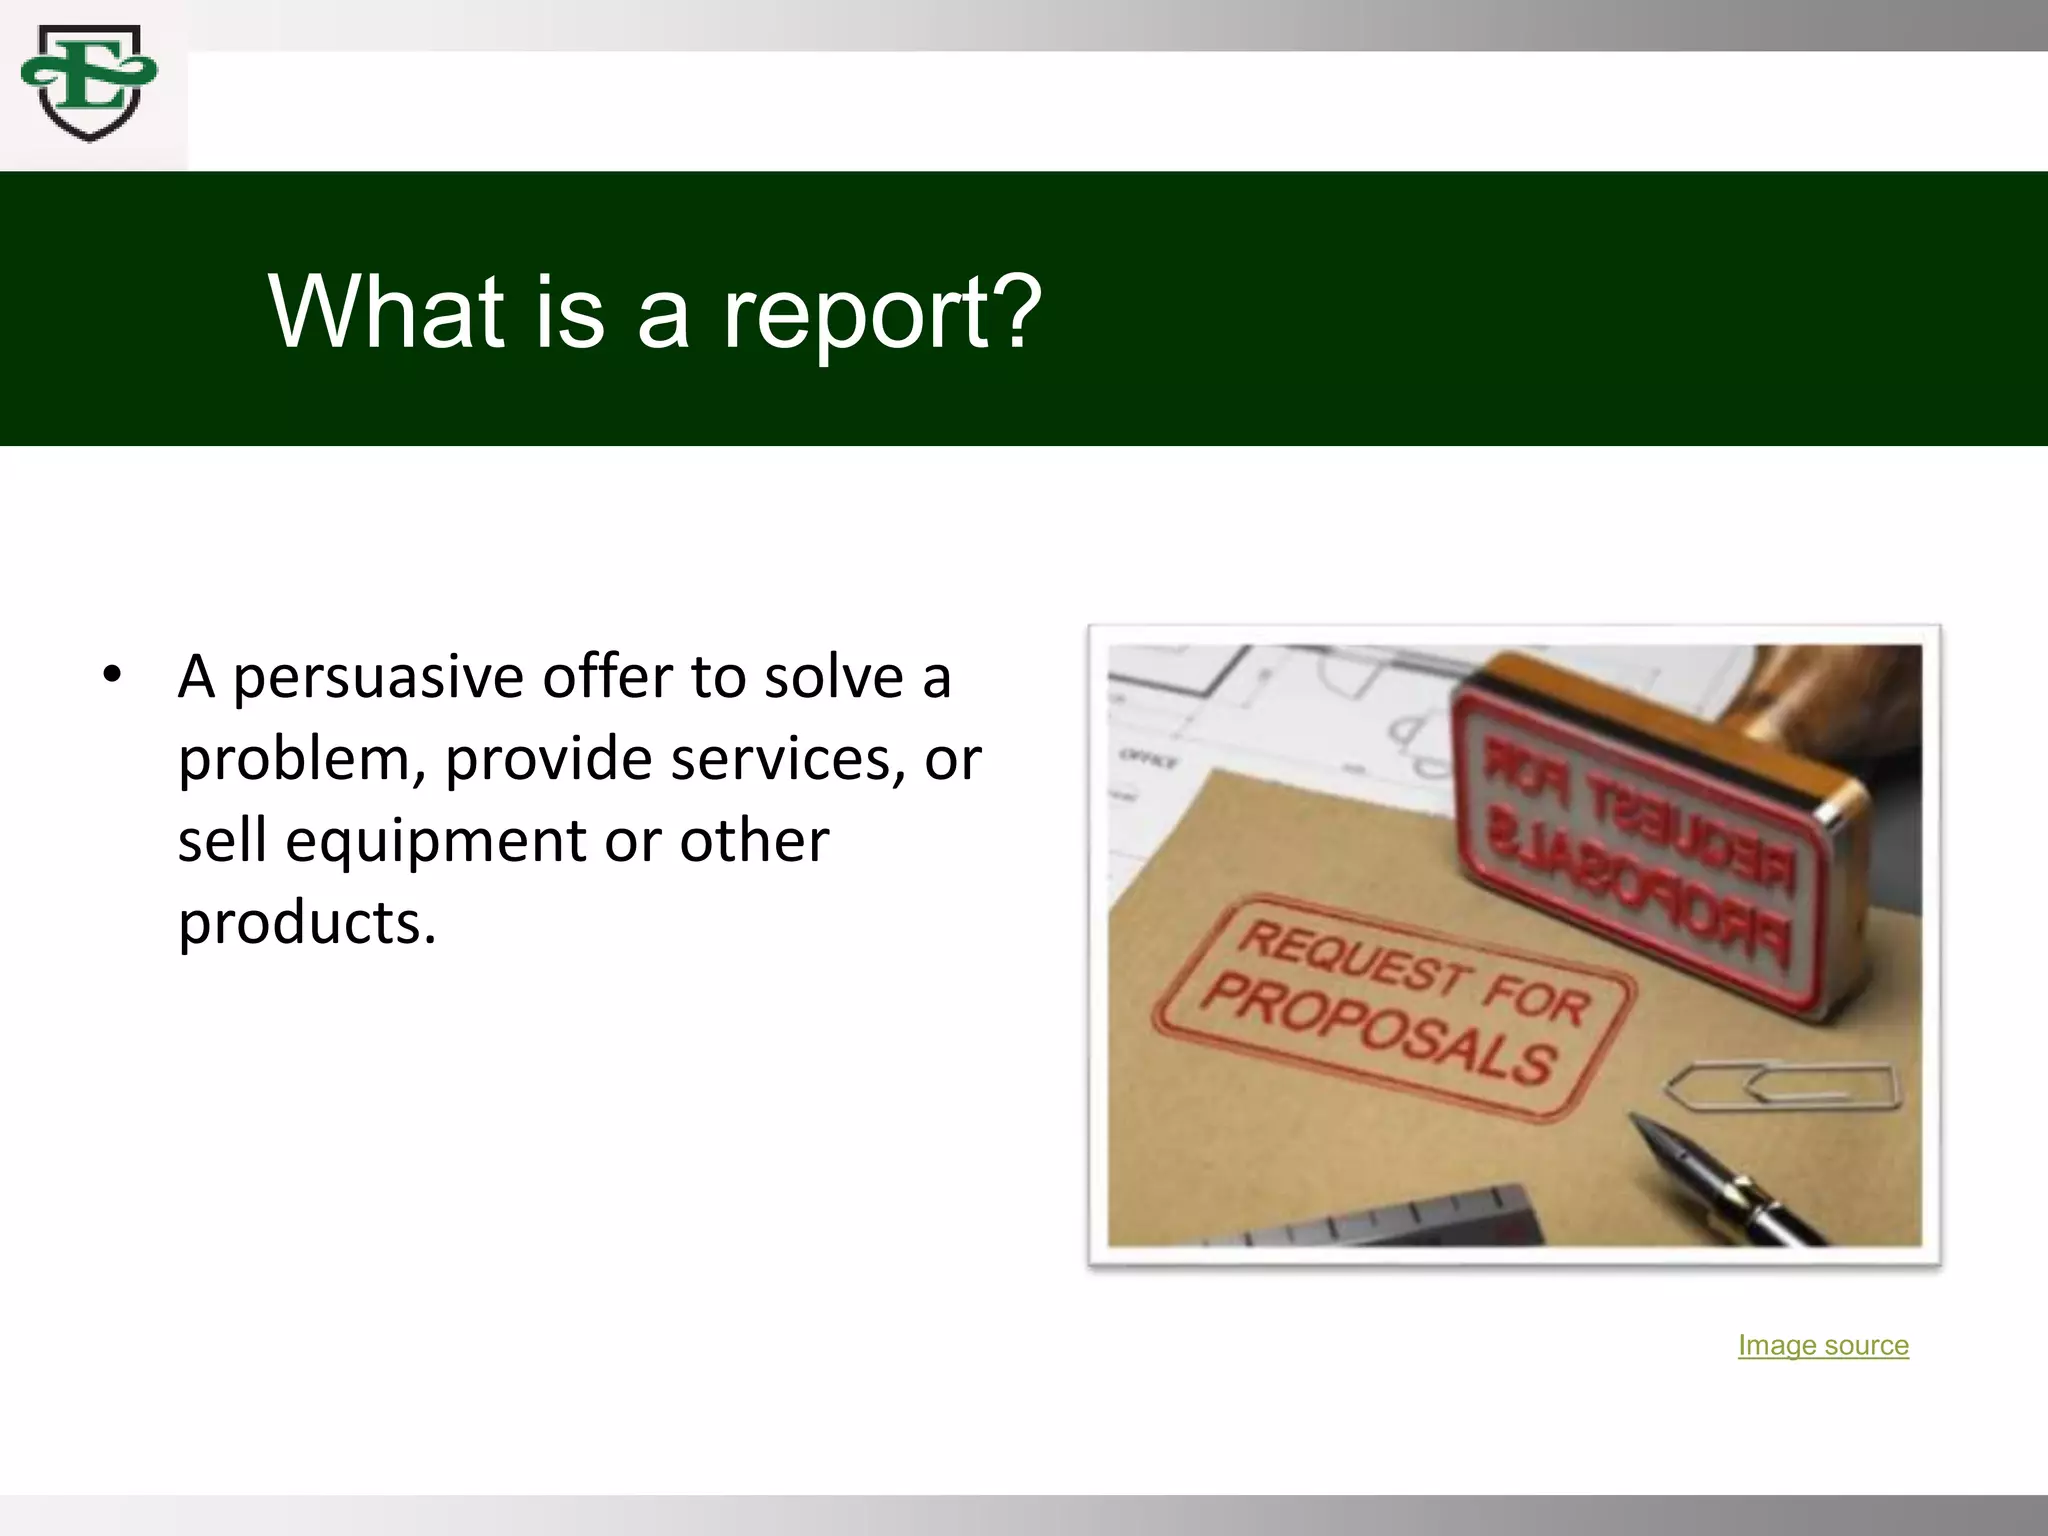
[Stamp saying request for proposal] [Photograph]. [n.d.]. Vizion.
https://www.vizion.com/blog/create-your-own-rfp-with-these-rfp-examples/
[Person writing notes and typing on computer] [Photograph]. [n.d.] Insurance Thought
Leadership.https://www.insurancethoughtleadership.com/tag/informal-report/