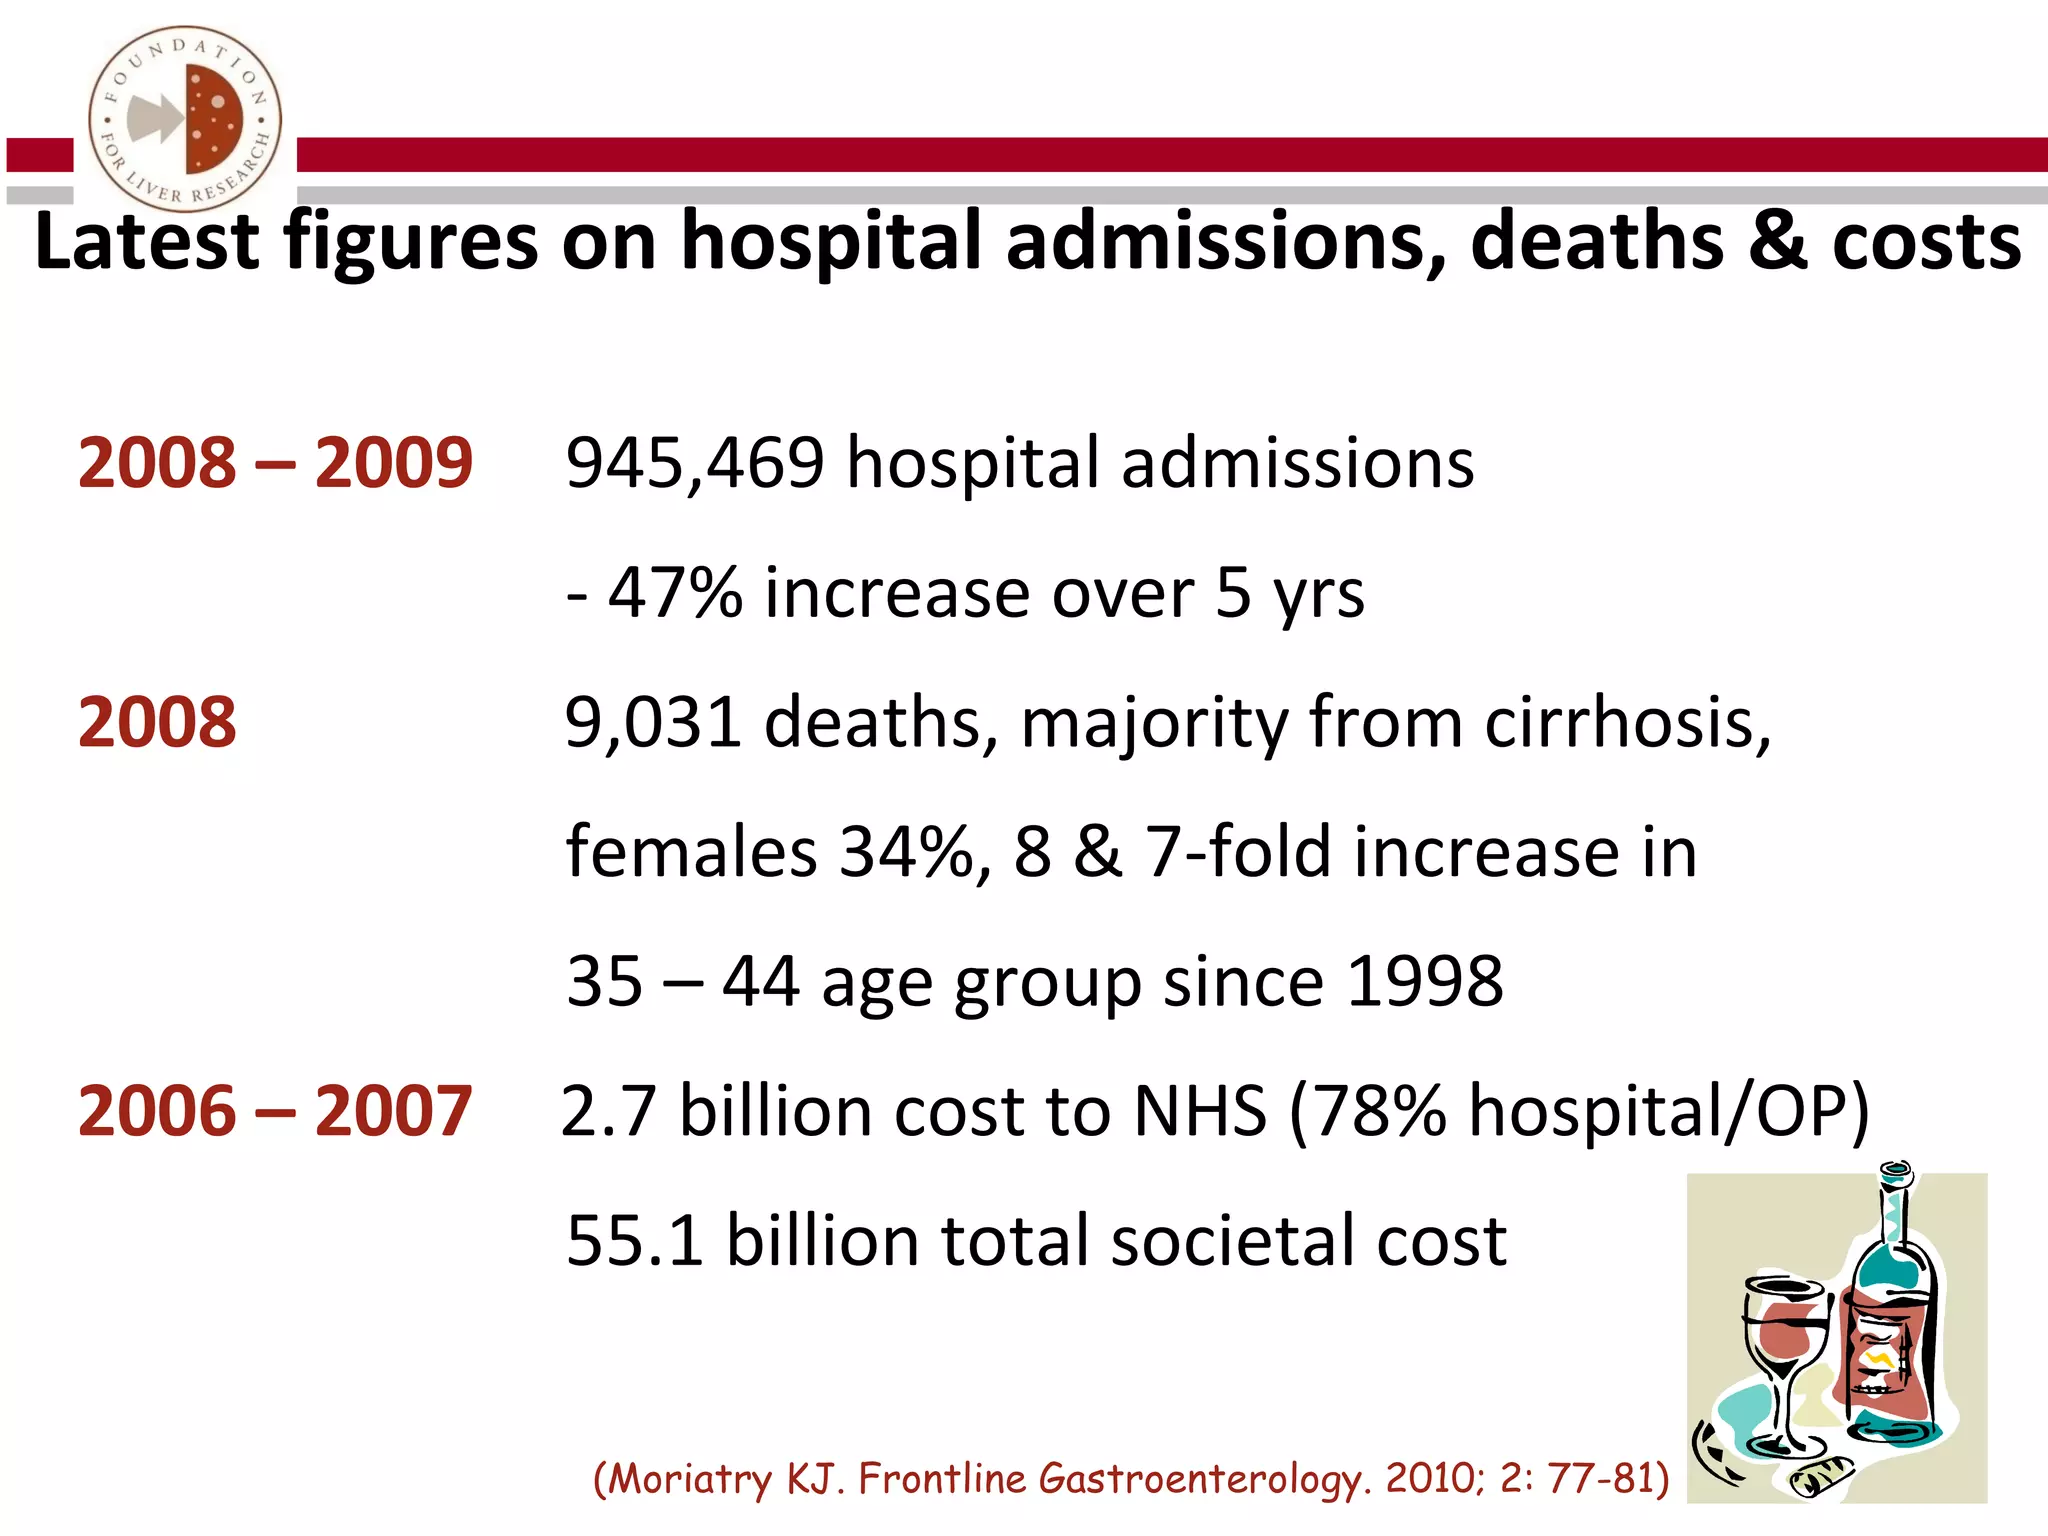
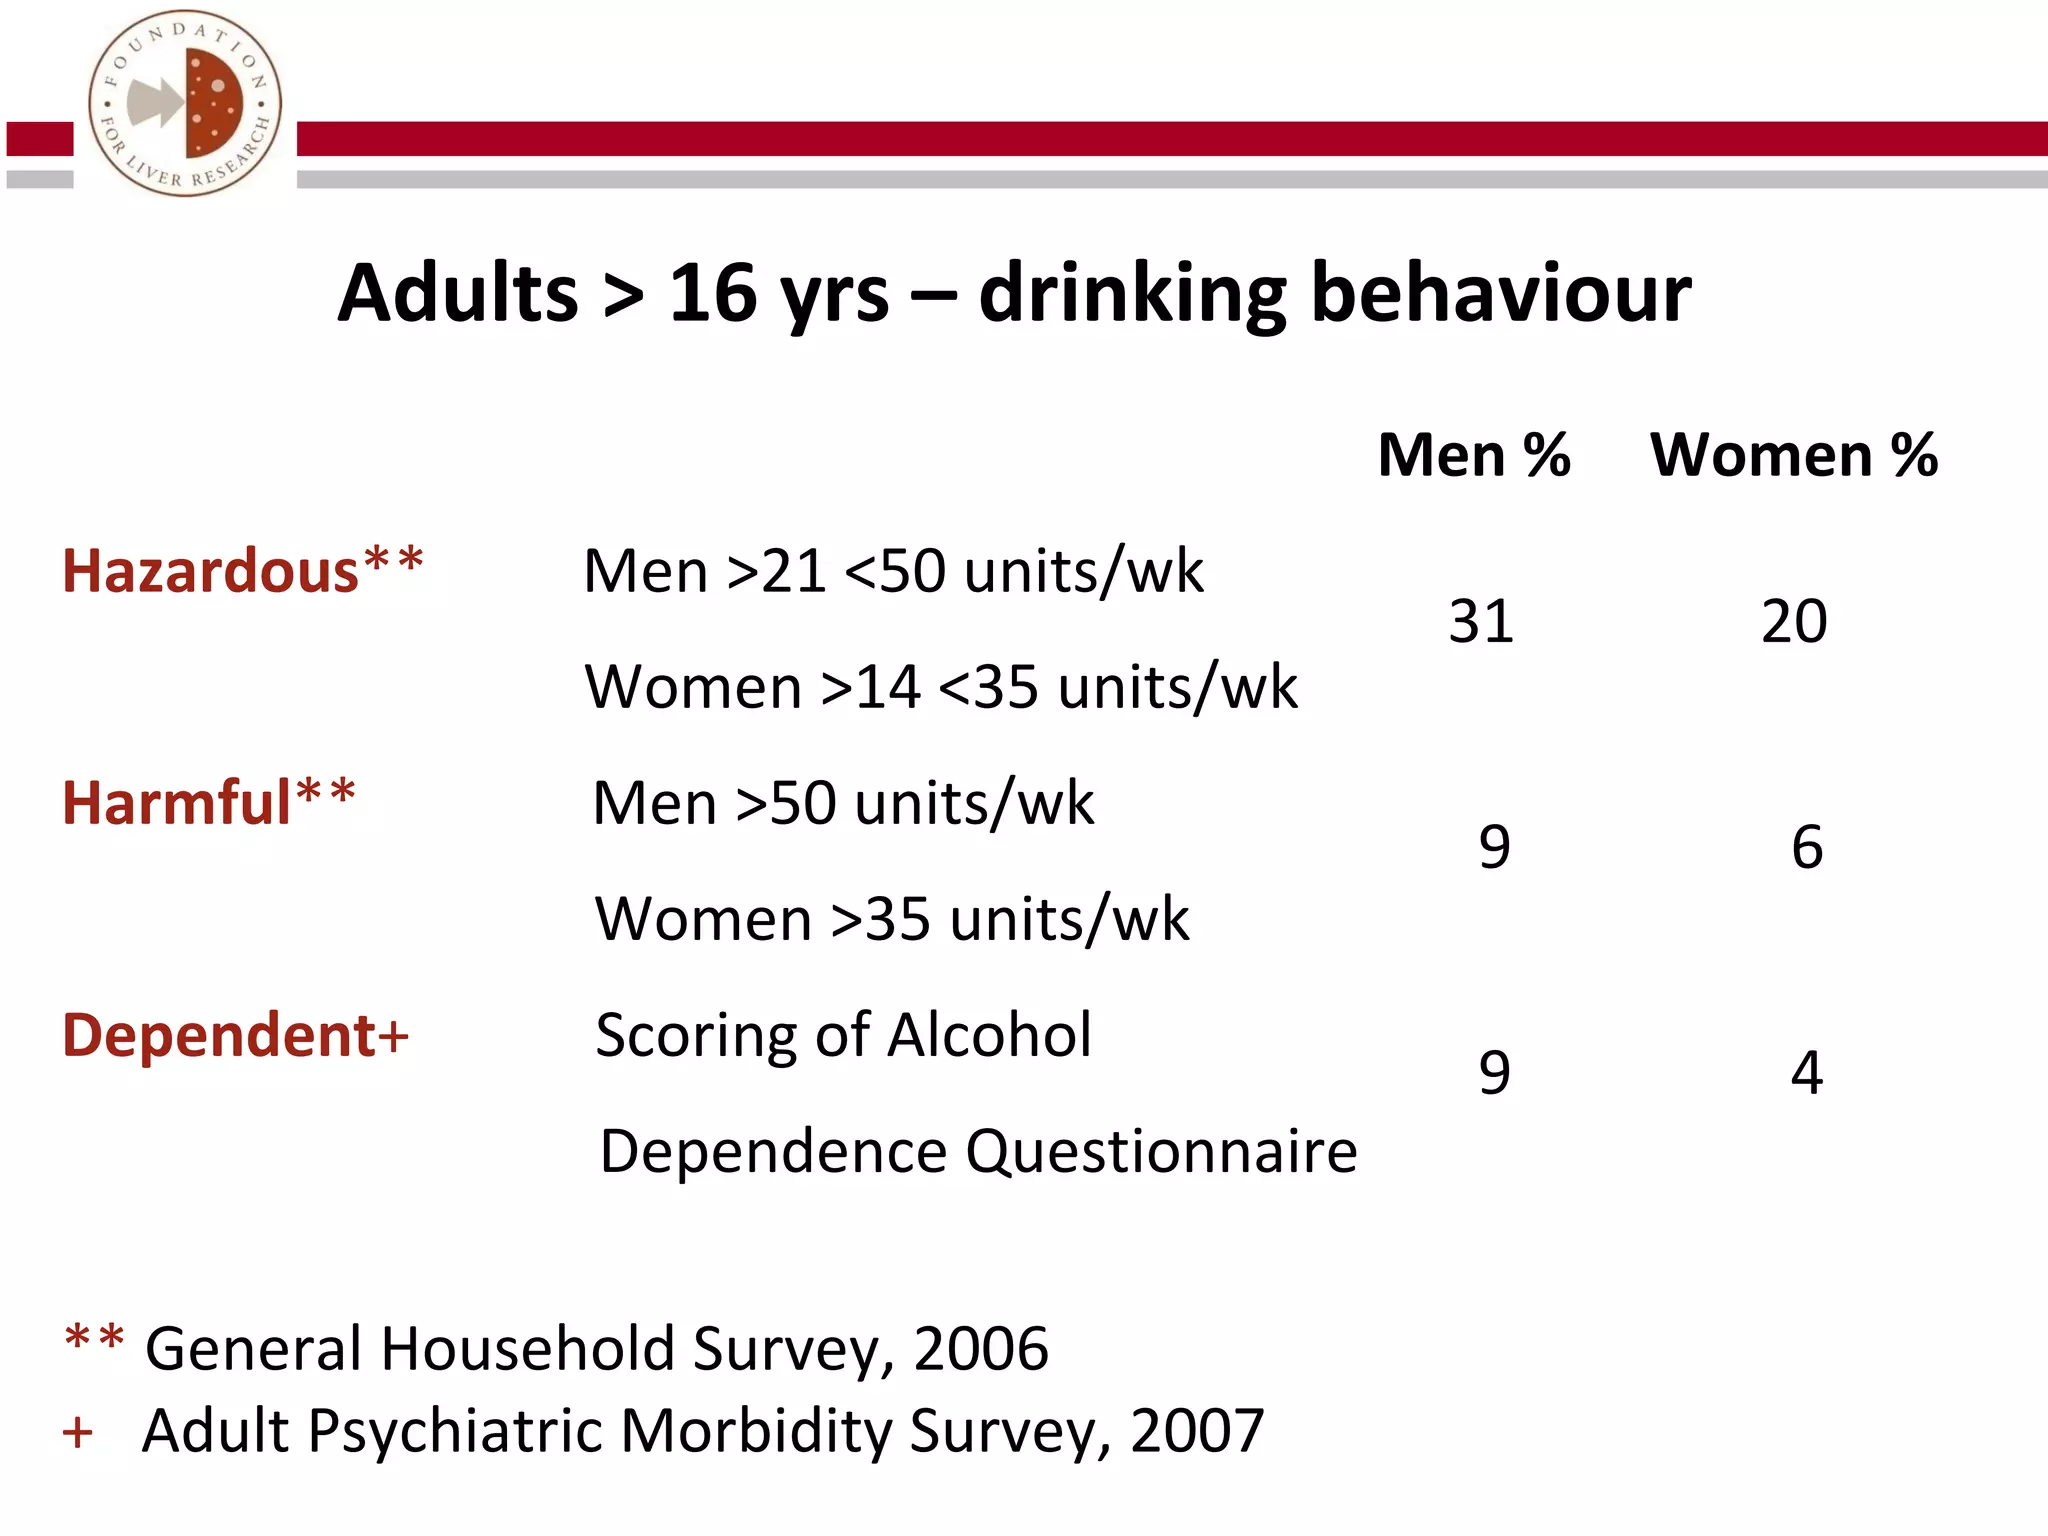
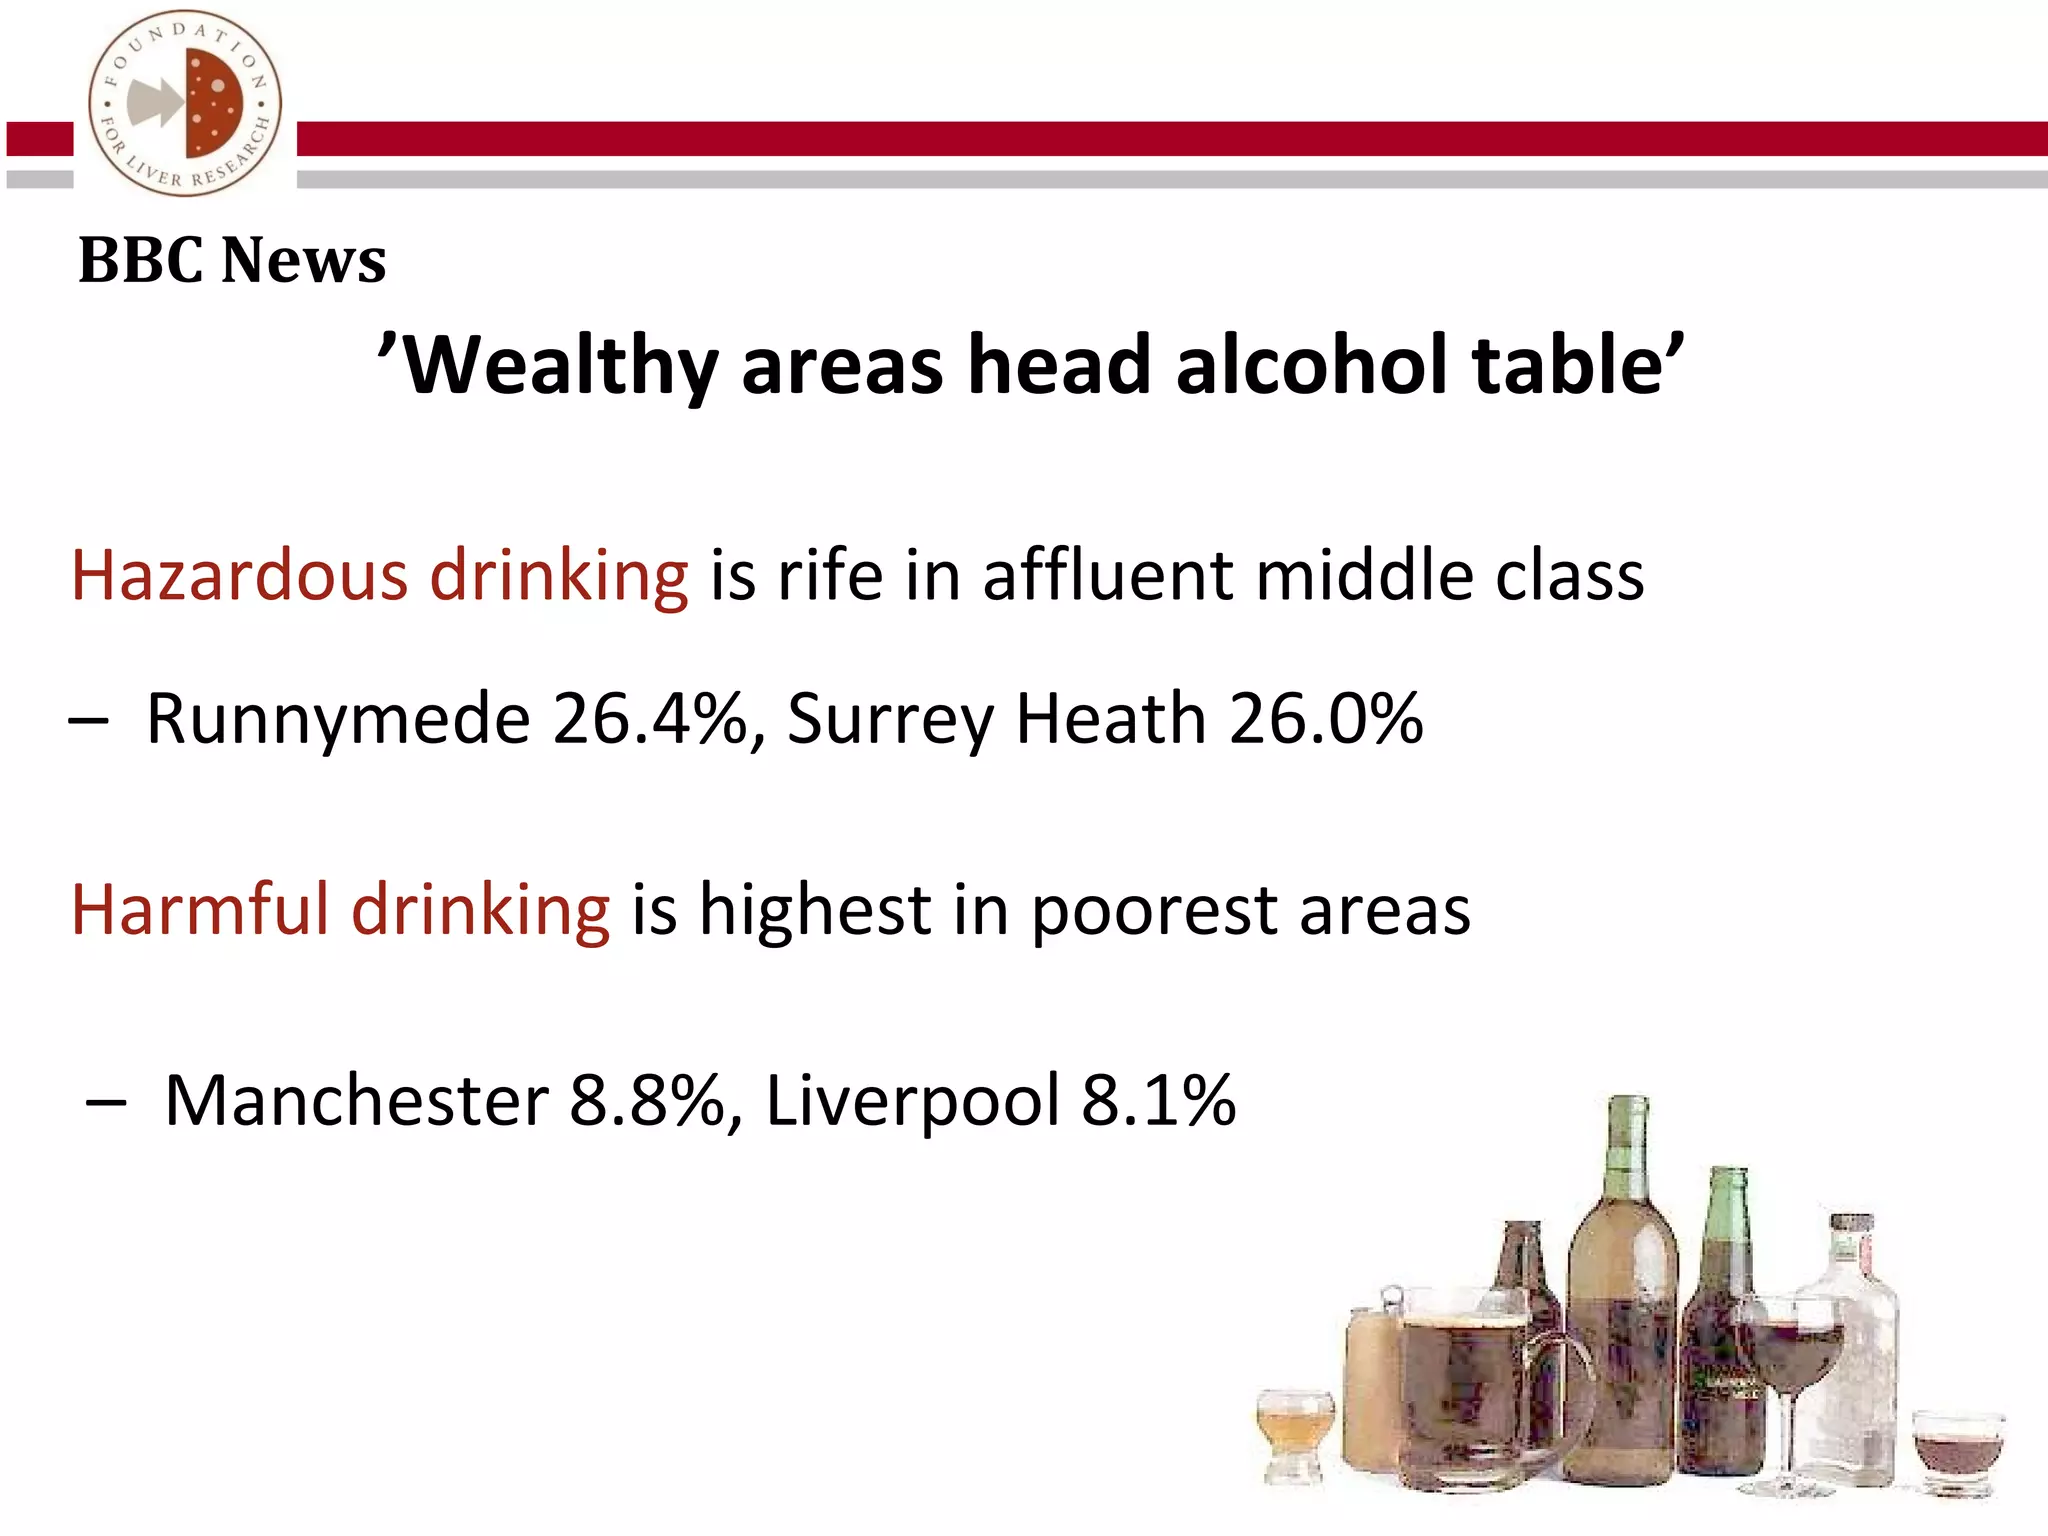
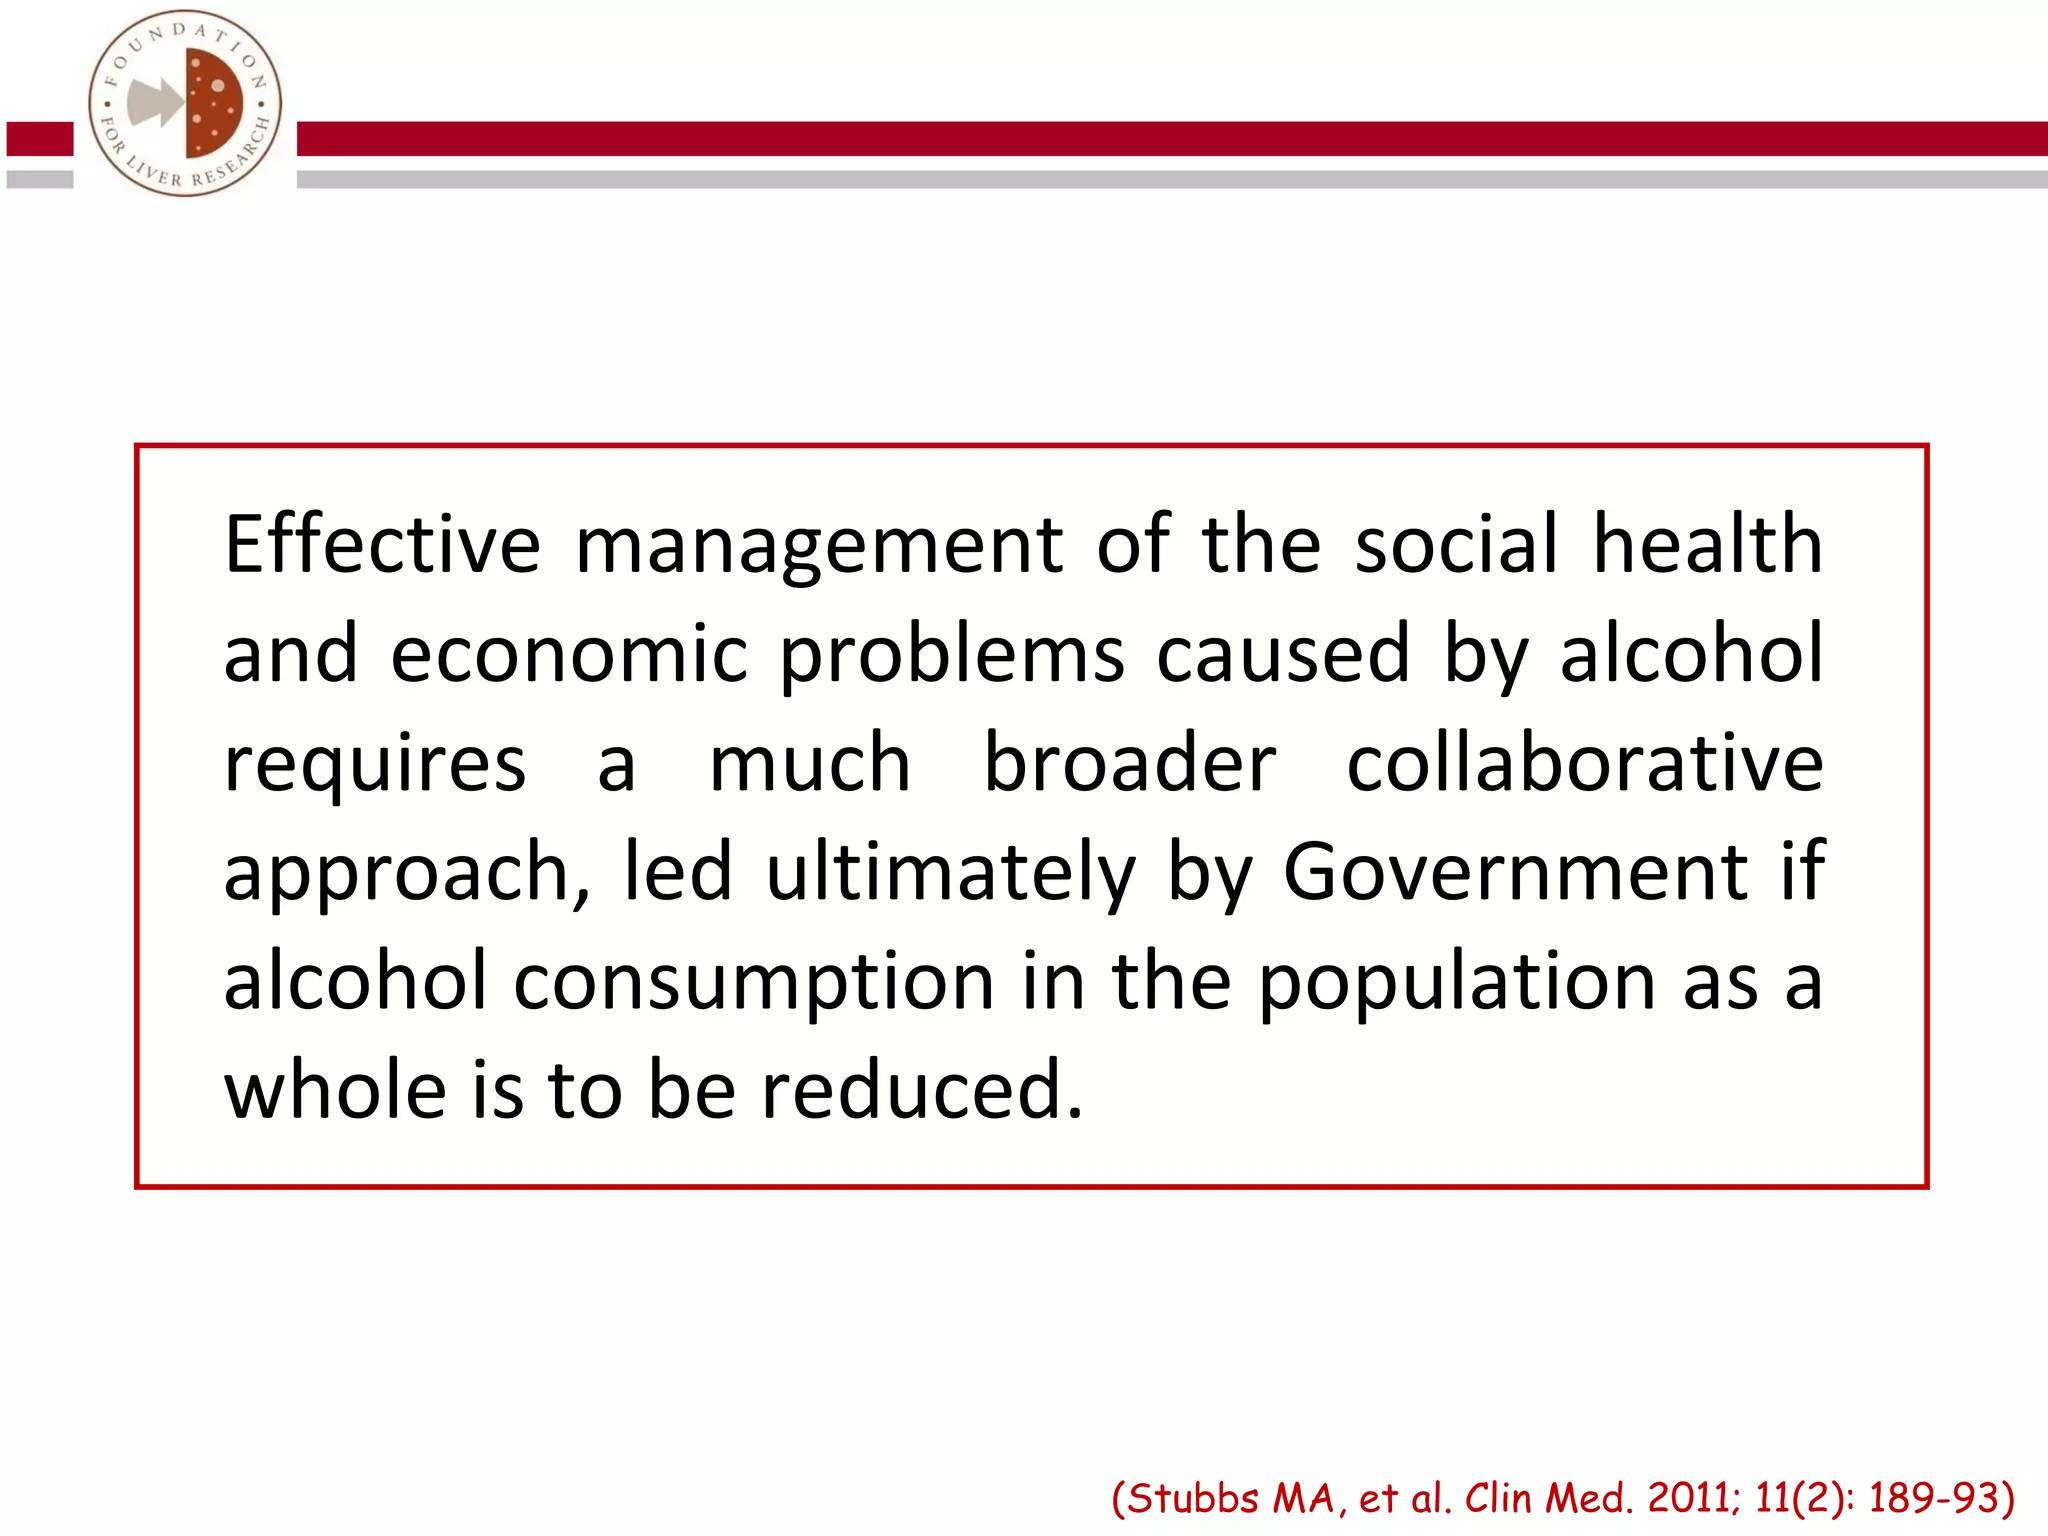
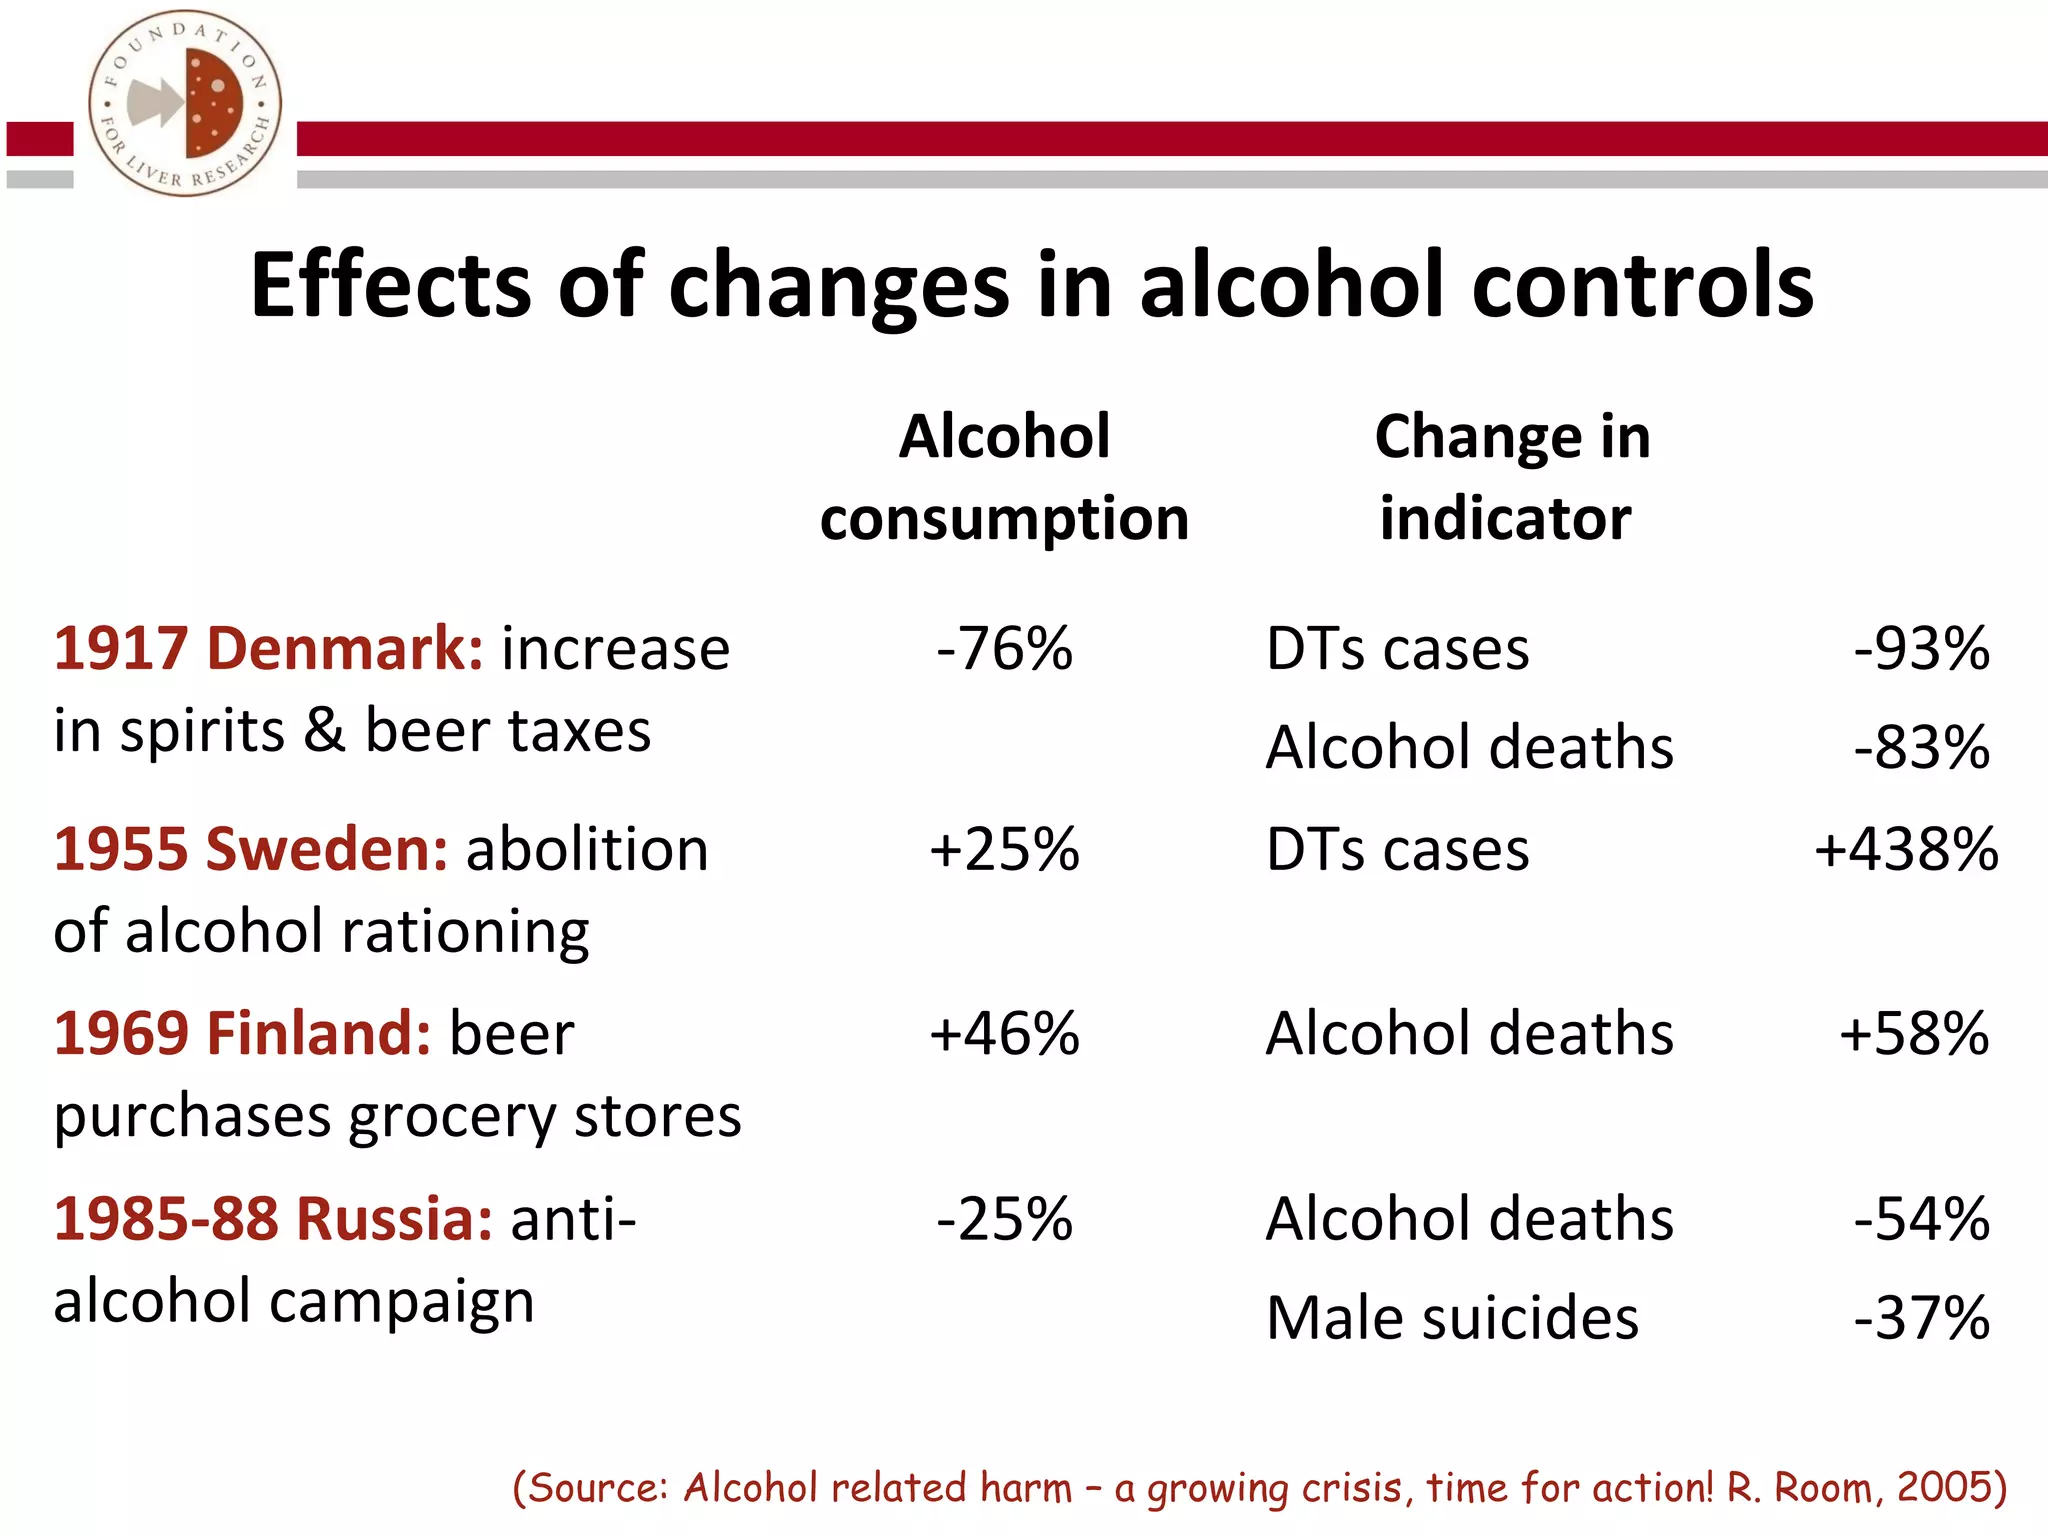
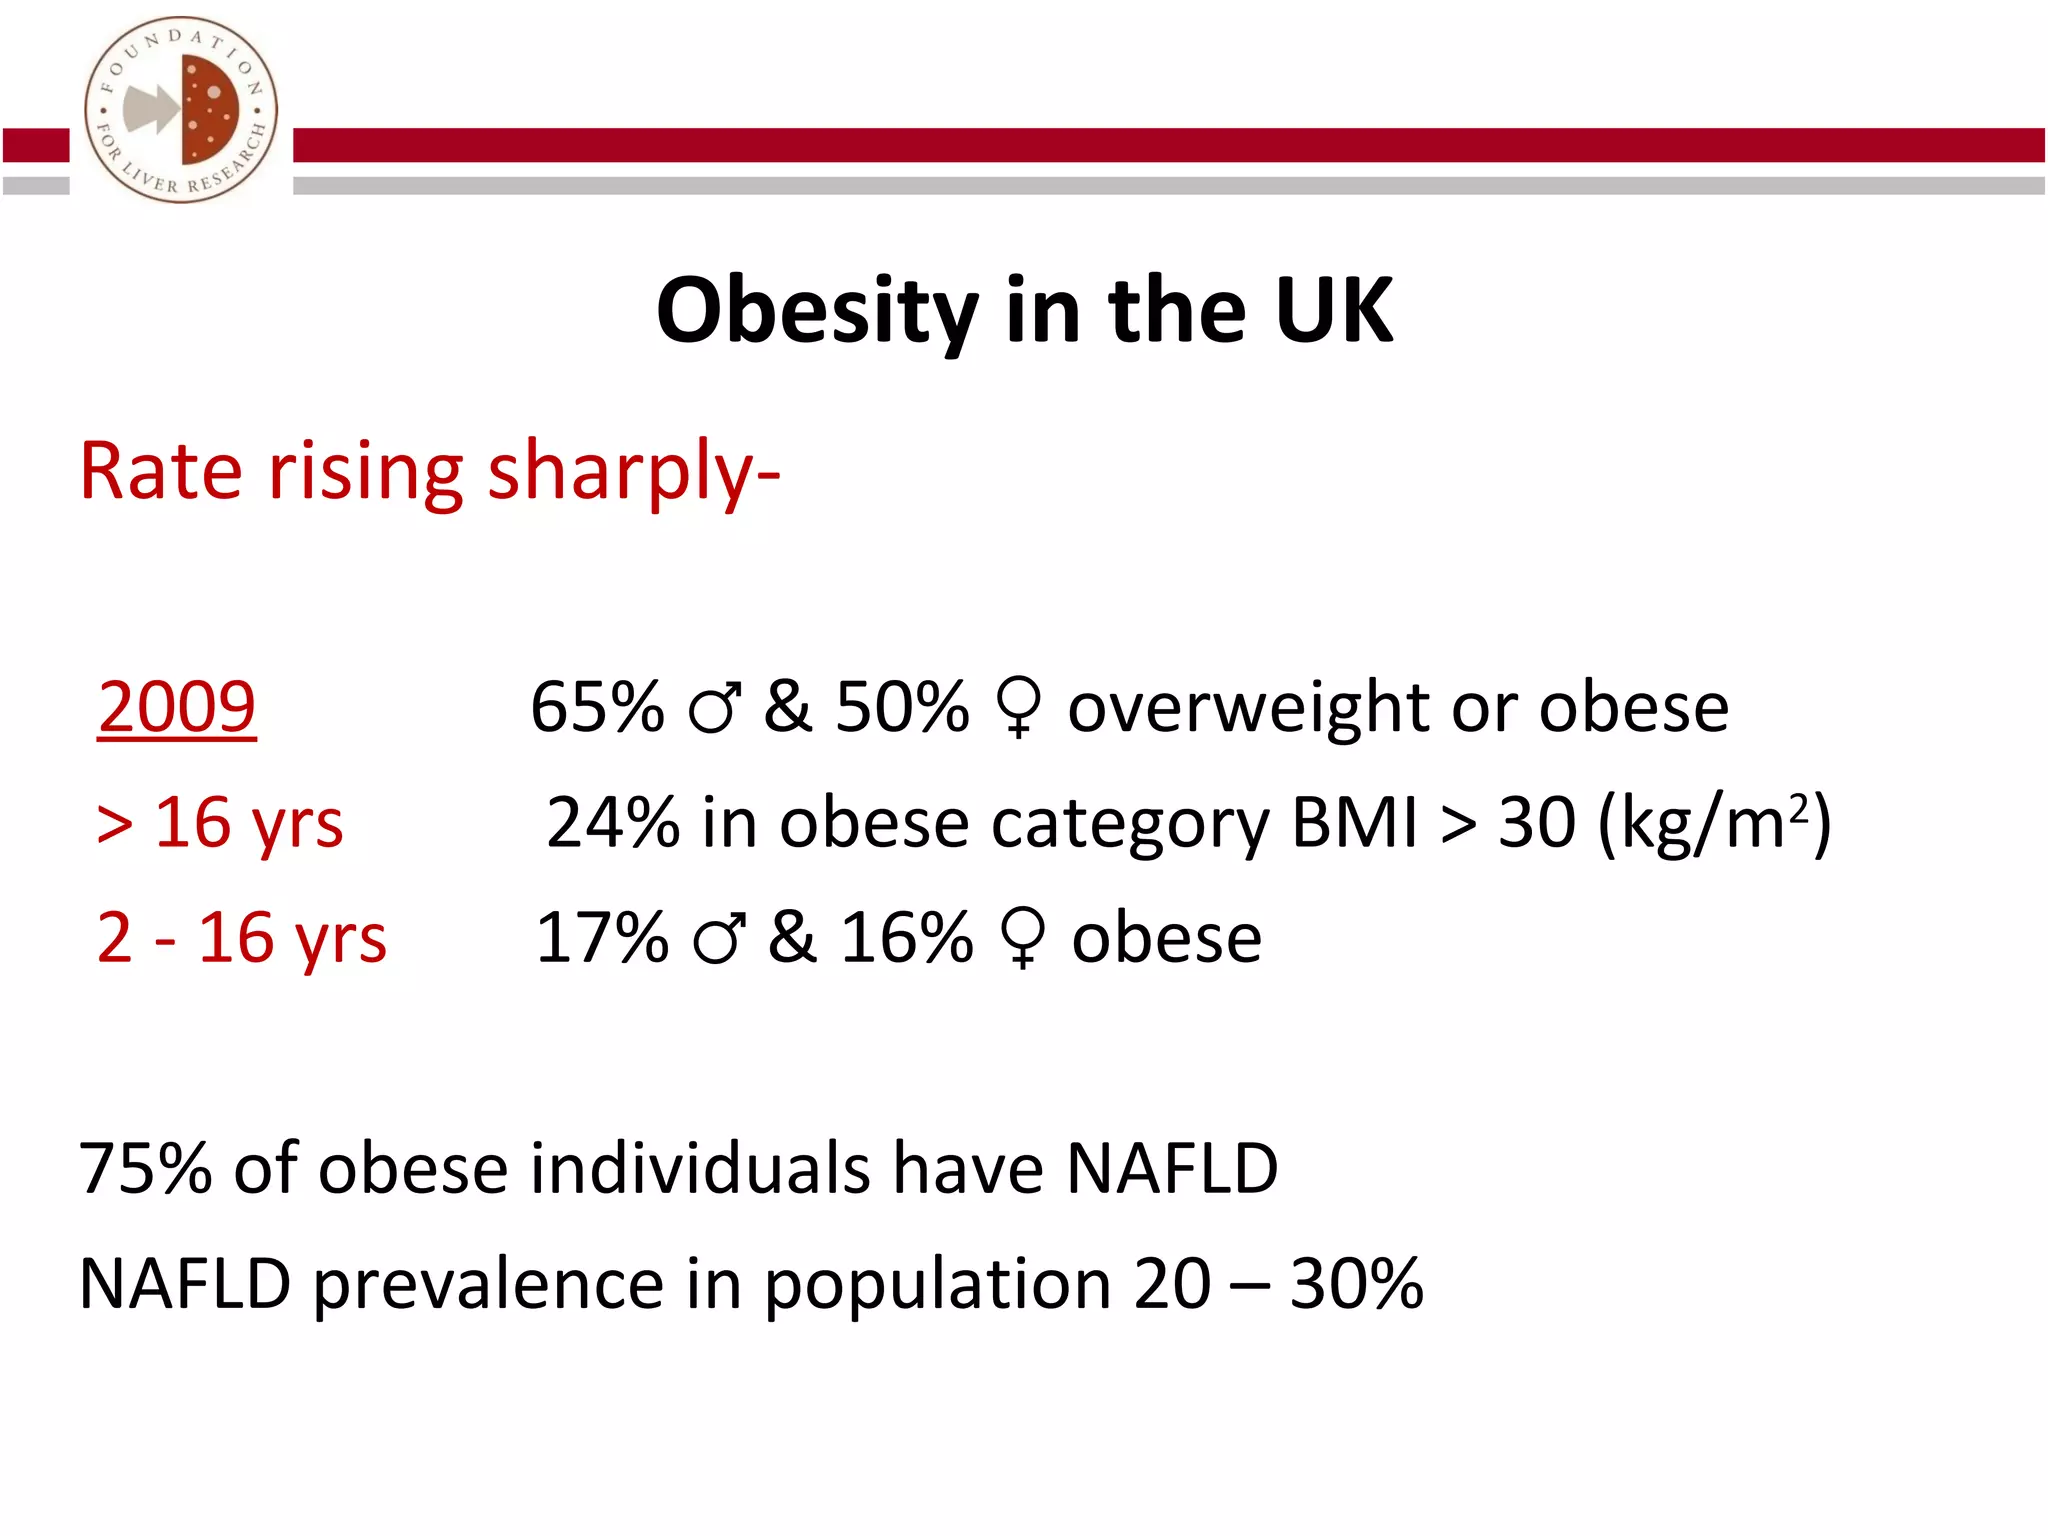
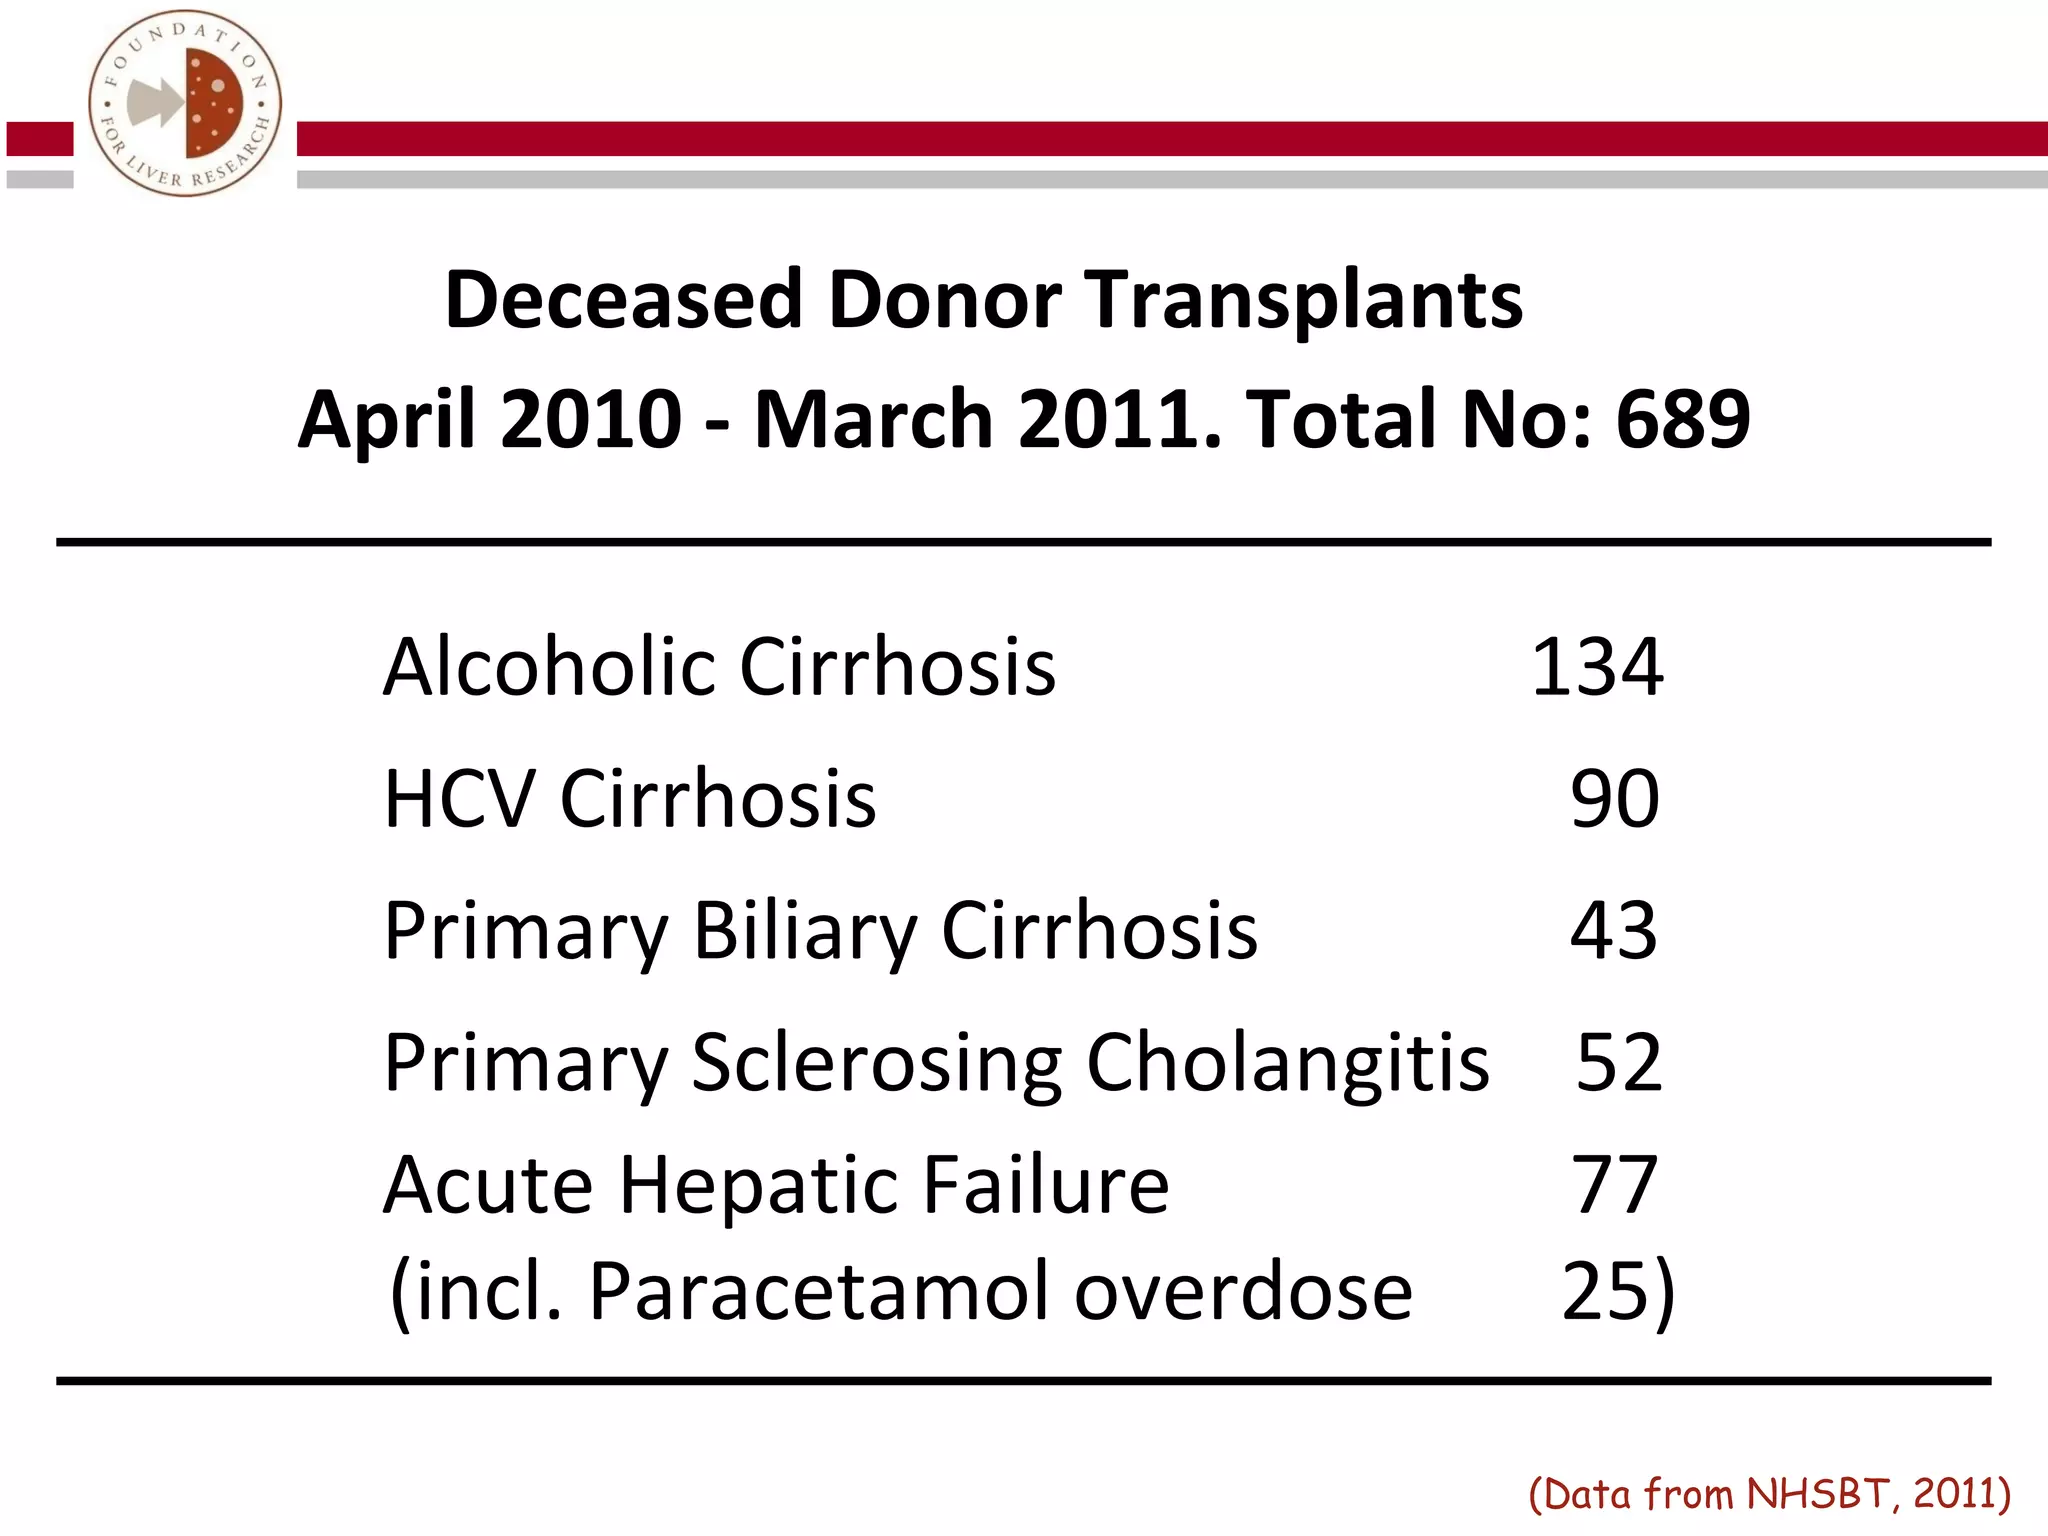
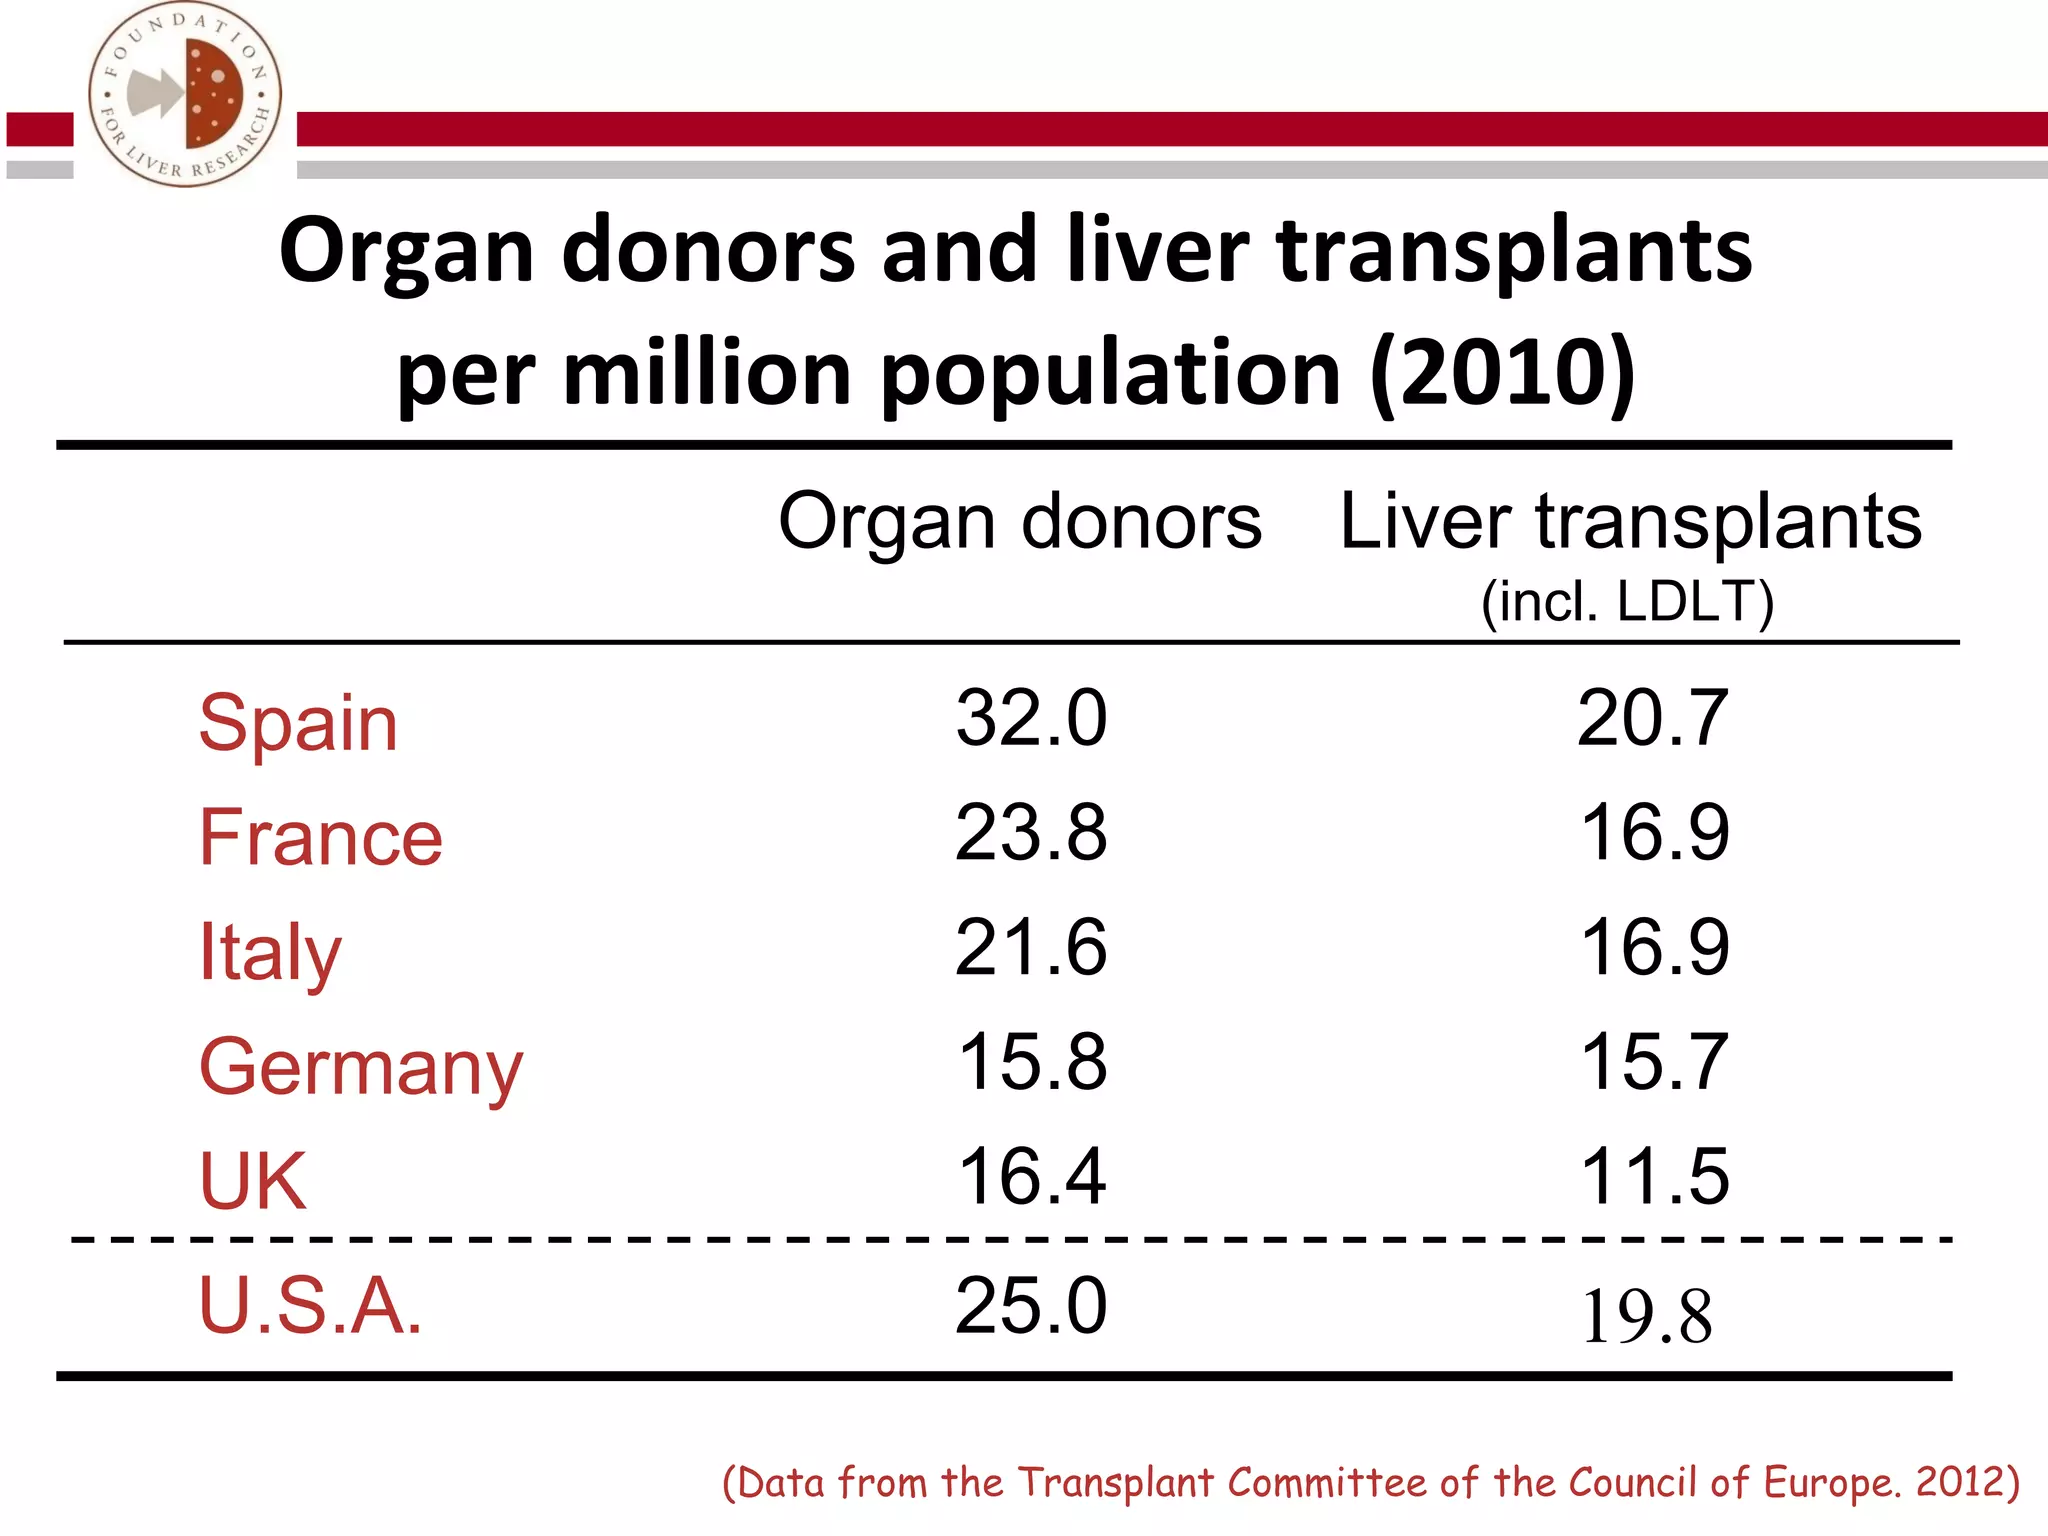
Salisbury Café Scientifique
                   1st May 2012
Combating the harms of excessive drinking in the UK


  Institute of Hepatology & Foundation for Liver Research
             Professor Roger Williams, CBE
Latest figures on hospital admissions, deaths & costs

 2008 – 2009   945,469 hospital admissions
               - 47% increase over 5 yrs
 2008          9,031 deaths, majority from cirrhosis,
               females 34%, 8 & 7-fold increase in
               35 – 44 age group since 1998
 2006 – 2007   2.7 billion cost to NHS (78% hospital/OP)
               55.1 billion total societal cost

                (Moriatry KJ. Frontline Gastroenterology. 2010; 2: 77-81)
Adults > 16 yrs – drinking behaviour
                                             Men %   Women %
Hazardous**       Men >21 <50 units/wk
                                              31       20
                  Women >14 <35 units/wk
Harmful**         Men >50 units/wk
                                               9        6
                  Women >35 units/wk
Dependent+        Scoring of Alcohol
                                               9        4
                  Dependence Questionnaire

** General Household Survey, 2006
+ Adult Psychiatric Morbidity Survey, 2007
BBC News
         ’Wealthy areas head alcohol table’

Hazardous drinking is rife in affluent middle class
– Runnymede 26.4%, Surrey Heath 26.0%

Harmful drinking is highest in poorest areas

– Manchester 8.8%, Liverpool 8.1%
Male & female alcohol consumption & cirrhosis

                         Males                Females
Cumulative total
                         917 kg                570 kg
alcohol consumption
Percentage developing
cirrhosis                  33%                    63%


                         (Marbet UA, et al. J Hepatol. 1987; 4(3): 364-72)
Drinking amongst children aged 11 – 15 yrs
 (Annual survey across 264 English secondary schools)


One-third consuming >15 units a wk
= 178,560 children

31% of children in drinking vs 5% in non-drinking

households

                                      (NHS Information Centre 2008)
Screening for excess alcohol consumption

• Blood tests – SGOT, AST, MCV identify misuse in
  two thirds of hospital patients but only 25% in
  primary care

• Audit – Alcohol use disorders identification test
  self administered 10 questions on consumption
  (3), drinking behaviour (4) & dependence (3)
Effective management of the social health
and economic problems caused by alcohol
requires a much broader collaborative
approach, led ultimately by Government if
alcohol consumption in the population as a
whole is to be reduced.


                       (Stubbs MA, et al. Clin Med. 2011; 11(2): 189-93)
Overall alcohol consumption reduced


  IF     AFFORDABILITY
         ACCESS
         ADVERTISING
                    ARE RESTRICTED
2009 – 2010
£17.6 million      – Government expenditure
                     on alcohol awareness
£600 – 800 million – Drinks industry on
                     promoting consumption
Effects of changes in alcohol controls
                                  Alcohol                     Change in
                                consumption                   indicator
1917 Denmark: increase                -76%              DTs cases                      -93%
in spirits & beer taxes                                 Alcohol deaths                 -83%
1955 Sweden: abolition                +25%              DTs cases                     +438%
of alcohol rationing
1969 Finland: beer                    +46%              Alcohol deaths                 +58%
purchases grocery stores
1985-88 Russia: anti-                 -25%              Alcohol deaths                  -54%
alcohol campaign                                        Male suicides                   -37%

                (Source: Alcohol related harm – a growing crisis, time for action! R. Room, 2005)
Obesity in the UK
Rate rising sharply-

2009         65% ♂ & 50% ♀ overweight or obese
> 16 yrs     24% in obese category BMI > 30 (kg/m2)
2 - 16 yrs   17% ♂ & 16% ♀ obese

75% of obese individuals have NAFLD
NAFLD prevalence in population 20 – 30%
Deceased Donor Transplants
April 2010 - March 2011. Total No: 689

  Alcoholic Cirrhosis              134
  HCV Cirrhosis                     90
  Primary Biliary Cirrhosis         43
  Primary Sclerosing Cholangitis    52
  Acute Hepatic Failure             77
  (incl. Paracetamol overdose       25)

                                   (Data from NHSBT, 2011)
Organ donors and liver transplants
    per million population (2010)
              Organ donors Liver transplants
                                                   (incl. LDLT)

Spain                   32.0                            20.7
France                  23.8                            16.9
Italy                   21.6                            16.9
Germany                 15.8                            15.7
UK                      16.4                            11.5
U.S.A.                  25.0                            19.8
            (Data from the Transplant Committee of the Council of Europe. 2012)

Combating the harms of excessive drinking in the UK

  • 1.
    Salisbury Café Scientifique 1st May 2012 Combating the harms of excessive drinking in the UK Institute of Hepatology & Foundation for Liver Research Professor Roger Williams, CBE
  • 2.
    Latest figures onhospital admissions, deaths & costs 2008 – 2009 945,469 hospital admissions - 47% increase over 5 yrs 2008 9,031 deaths, majority from cirrhosis, females 34%, 8 & 7-fold increase in 35 – 44 age group since 1998 2006 – 2007 2.7 billion cost to NHS (78% hospital/OP) 55.1 billion total societal cost (Moriatry KJ. Frontline Gastroenterology. 2010; 2: 77-81)
  • 3.
    Adults > 16yrs – drinking behaviour Men % Women % Hazardous** Men >21 <50 units/wk 31 20 Women >14 <35 units/wk Harmful** Men >50 units/wk 9 6 Women >35 units/wk Dependent+ Scoring of Alcohol 9 4 Dependence Questionnaire ** General Household Survey, 2006 + Adult Psychiatric Morbidity Survey, 2007
  • 4.
    BBC News ’Wealthy areas head alcohol table’ Hazardous drinking is rife in affluent middle class – Runnymede 26.4%, Surrey Heath 26.0% Harmful drinking is highest in poorest areas – Manchester 8.8%, Liverpool 8.1%
  • 5.
    Male & femalealcohol consumption & cirrhosis Males Females Cumulative total 917 kg 570 kg alcohol consumption Percentage developing cirrhosis 33% 63% (Marbet UA, et al. J Hepatol. 1987; 4(3): 364-72)
  • 6.
    Drinking amongst childrenaged 11 – 15 yrs (Annual survey across 264 English secondary schools) One-third consuming >15 units a wk = 178,560 children 31% of children in drinking vs 5% in non-drinking households (NHS Information Centre 2008)
  • 7.
    Screening for excessalcohol consumption • Blood tests – SGOT, AST, MCV identify misuse in two thirds of hospital patients but only 25% in primary care • Audit – Alcohol use disorders identification test self administered 10 questions on consumption (3), drinking behaviour (4) & dependence (3)
  • 8.
    Effective management ofthe social health and economic problems caused by alcohol requires a much broader collaborative approach, led ultimately by Government if alcohol consumption in the population as a whole is to be reduced. (Stubbs MA, et al. Clin Med. 2011; 11(2): 189-93)
  • 9.
    Overall alcohol consumptionreduced IF AFFORDABILITY ACCESS ADVERTISING ARE RESTRICTED
  • 10.
    2009 – 2010 £17.6million – Government expenditure on alcohol awareness £600 – 800 million – Drinks industry on promoting consumption
  • 11.
    Effects of changesin alcohol controls Alcohol Change in consumption indicator 1917 Denmark: increase -76% DTs cases -93% in spirits & beer taxes Alcohol deaths -83% 1955 Sweden: abolition +25% DTs cases +438% of alcohol rationing 1969 Finland: beer +46% Alcohol deaths +58% purchases grocery stores 1985-88 Russia: anti- -25% Alcohol deaths -54% alcohol campaign Male suicides -37% (Source: Alcohol related harm – a growing crisis, time for action! R. Room, 2005)
  • 12.
    Obesity in theUK Rate rising sharply- 2009 65% ♂ & 50% ♀ overweight or obese > 16 yrs 24% in obese category BMI > 30 (kg/m2) 2 - 16 yrs 17% ♂ & 16% ♀ obese 75% of obese individuals have NAFLD NAFLD prevalence in population 20 – 30%
  • 13.
    Deceased Donor Transplants April2010 - March 2011. Total No: 689 Alcoholic Cirrhosis 134 HCV Cirrhosis 90 Primary Biliary Cirrhosis 43 Primary Sclerosing Cholangitis 52 Acute Hepatic Failure 77 (incl. Paracetamol overdose 25) (Data from NHSBT, 2011)
  • 14.
    Organ donors andliver transplants per million population (2010) Organ donors Liver transplants (incl. LDLT) Spain 32.0 20.7 France 23.8 16.9 Italy 21.6 16.9 Germany 15.8 15.7 UK 16.4 11.5 U.S.A. 25.0 19.8 (Data from the Transplant Committee of the Council of Europe. 2012)

Editor's Notes